LOCAL ECONOMIC DEVELOPMENT DESK STUDY
LOCAL ECONOMIC DEVELOPMENT DESK STUDY
LOCAL ECONOMIC DEVELOPMENT DESK STUDY

Create successful ePaper yourself
Turn your PDF publications into a flip-book with our unique Google optimized e-Paper software.
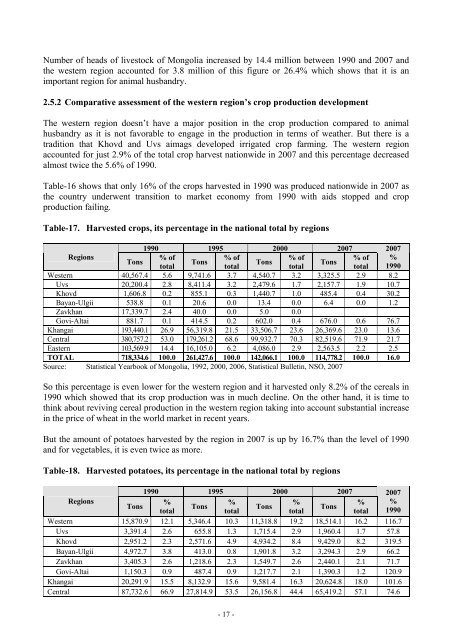
Number of heads of livestock of Mongolia increased by 14.4 million between 1990 and 2007 and<br />
the western region accounted for 3.8 million of this figure or 26.4% which shows that it is an<br />
important region for animal husbandry.<br />
2.5.2 Comparative assessment of the western region’s crop production development<br />
The western region doesn’t have a major position in the crop production compared to animal<br />
husbandry as it is not favorable to engage in the production in terms of weather. But there is a<br />
tradition that Khovd and Uvs aimags developed irrigated crop farming. The western region<br />
accounted for just 2.9% of the total crop harvest nationwide in 2007 and this percentage decreased<br />
almost twice the 5.6% of 1990.<br />
Table-16 shows that only 16% of the crops harvested in 1990 was produced nationwide in 2007 as<br />
the country underwent transition to market economy from 1990 with aids stopped and crop<br />
production failing.<br />
Table-17. Harvested crops, its percentage in the national total by regions<br />
1990 1995 2000 2007 2007<br />
Regions<br />
% of<br />
% of<br />
% of<br />
% of %<br />
Tons<br />
Tons<br />
Tons<br />
Tons<br />
total<br />
total<br />
total<br />
total 1990<br />
Western 40,567.4 5.6 9,741.6 3.7 4,540.7 3.2 3,325.5 2.9 8.2<br />
Uvs 20,200.4 2.8 8,411.4 3.2 2,479.6 1.7 2,157.7 1.9 10.7<br />
Khovd 1,606.8 0.2 855.1 0.3 1,440.7 1.0 485.4 0.4 30.2<br />
Bayan-Ulgii 538.8 0.1 20.6 0.0 13.4 0.0 6.4 0.0 1.2<br />
Zavkhan 17,339.7 2.4 40.0 0.0 5.0 0.0<br />
Govi-Altai 881.7 0.1 414.5 0.2 602.0 0.4 676.0 0.6 76.7<br />
Khangai 193,440.1 26.9 56,319.8 21.5 33,506.7 23.6 26,369.6 23.0 13.6<br />
Central 380,757.2 53.0 179,261.2 68.6 99,932.7 70.3 82,519.6 71.9 21.7<br />
Eastern 103,569.9 14.4 16,105.0 6.2 4,086.0 2.9 2,563.5 2.2 2.5<br />
TOTAL 718,334.6 100.0 261,427.6 100.0 142,066.1 100.0 114,778.2 100.0 16.0<br />
Source: Statistical Yearbook of Mongolia, 1992, 2000, 2006, Statistical Bulletin, NSO, 2007<br />
So this percentage is even lower for the western region and it harvested only 8.2% of the cereals in<br />
1990 which showed that its crop production was in much decline. On the other hand, it is time to<br />
think about reviving cereal production in the western region taking into account substantial increase<br />
in the price of wheat in the world market in recent years.<br />
But the amount of potatoes harvested by the region in 2007 is up by 16.7% than the level of 1990<br />
and for vegetables, it is even twice as more.<br />
Table-18. Harvested potatoes, its percentage in the national total by regions<br />
1990 1995 2000 2007 2007<br />
Regions<br />
%<br />
%<br />
%<br />
% %<br />
Tons<br />
Tons<br />
Tons<br />
Tons<br />
total<br />
total<br />
total<br />
total 1990<br />
Western 15,870.9 12.1 5,346.4 10.3 11,318.8 19.2 18,514.1 16.2 116.7<br />
Uvs 3,391.4 2.6 655.8 1.3 1,715.4 2.9 1,960.4 1.7 57.8<br />
Khovd 2,951.2 2.3 2,571.6 4.9 4,934.2 8.4 9,429.0 8.2 319.5<br />
Bayan-Ulgii 4,972.7 3.8 413.0 0.8 1,901.8 3.2 3,294.3 2.9 66.2<br />
Zavkhan 3,405.3 2.6 1,218.6 2.3 1,549.7 2.6 2,440.1 2.1 71.7<br />
Govi-Altai 1,150.3 0.9 487.4 0.9 1,217.7 2.1 1,390.3 1.2 120.9<br />
Khangai 20,291.9 15.5 8,132.9 15.6 9,581.4 16.3 20,624.8 18.0 101.6<br />
Central 87,732.6 66.9 27,814.9 53.5 26,156.8 44.4 65,419.2 57.1 74.6<br />
- 17 -