Medium range order of bulk metallic glasses determined by variable ...
Medium range order of bulk metallic glasses determined by variable ...
Medium range order of bulk metallic glasses determined by variable ...

You also want an ePaper? Increase the reach of your titles
YUMPU automatically turns print PDFs into web optimized ePapers that Google loves.
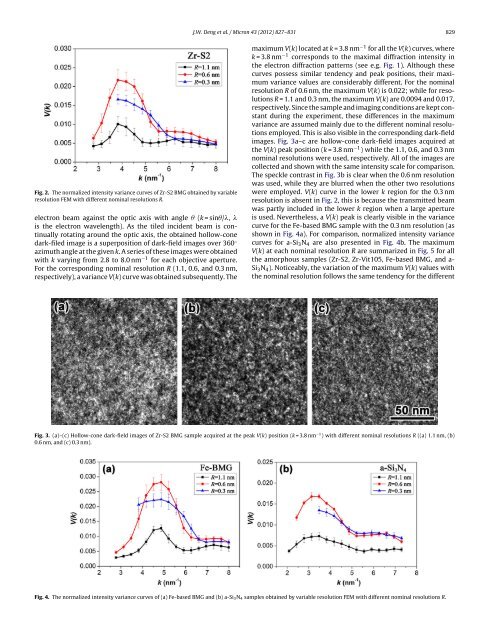
J.W. Deng et al. / Micron 43 (2012) 827–831 829<br />
Fig. 2. The normalized intensity variance curves <strong>of</strong> Zr-S2 BMG obtained <strong>by</strong> <strong>variable</strong><br />
resolution FEM with different nominal resolutions R.<br />
electron beam against the optic axis with angle (k = sin/, <br />
is the electron wavelength). As the tiled incident beam is continually<br />
rotating around the optic axis, the obtained hollow-cone<br />
dark-filed image is a superposition <strong>of</strong> dark-field images over 360 ◦<br />
azimuth angle at the given k. A series <strong>of</strong> these images were obtained<br />
with k varying from 2.8 to 8.0 nm −1 for each objective aperture.<br />
For the corresponding nominal resolution R (1.1, 0.6, and 0.3 nm,<br />
respectively), a variance V(k) curve was obtained subsequently. The<br />
maximum V(k) located at k = 3.8 nm −1 for all the V(k) curves, where<br />
k = 3.8 nm −1 corresponds to the maximal diffraction intensity in<br />
the electron diffraction patterns (see e.g. Fig. 1). Although these<br />
curves possess similar tendency and peak positions, their maximum<br />
variance values are considerably different. For the nominal<br />
resolution R <strong>of</strong> 0.6 nm, the maximum V(k) is 0.022; while for resolutions<br />
R = 1.1 and 0.3 nm, the maximum V(k) are 0.0094 and 0.017,<br />
respectively. Since the sample and imaging conditions are kept constant<br />
during the experiment, these differences in the maximum<br />
variance are assumed mainly due to the different nominal resolutions<br />
employed. This is also visible in the corresponding dark-field<br />
images. Fig. 3a–c are hollow-cone dark-field images acquired at<br />
the V(k) peak position (k = 3.8 nm −1 ) while the 1.1, 0.6, and 0.3 nm<br />
nominal resolutions were used, respectively. All <strong>of</strong> the images are<br />
collected and shown with the same intensity scale for comparison.<br />
The speckle contrast in Fig. 3b is clear when the 0.6 nm resolution<br />
was used, while they are blurred when the other two resolutions<br />
were employed. V(k) curve in the lower k region for the 0.3 nm<br />
resolution is absent in Fig. 2, this is because the transmitted beam<br />
was partly included in the lower k region when a large aperture<br />
is used. Nevertheless, a V(k) peak is clearly visible in the variance<br />
curve for the Fe-based BMG sample with the 0.3 nm resolution (as<br />
shown in Fig. 4a). For comparison, normalized intensity variance<br />
curves for a-Si 3 N 4 are also presented in Fig. 4b. The maximum<br />
V(k) at each nominal resolution R are summarized in Fig. 5 for all<br />
the amorphous samples (Zr-S2, Zr-Vit105, Fe-based BMG, and a-<br />
Si 3 N 4 ). Noticeably, the variation <strong>of</strong> the maximum V(k) values with<br />
the nominal resolution follows the same tendency for the different<br />
Fig. 3. (a)–(c) Hollow-cone dark-field images <strong>of</strong> Zr-S2 BMG sample acquired at the peak V(k) position (k = 3.8 nm −1 ) with different nominal resolutions R ((a) 1.1 nm, (b)<br />
0.6 nm, and (c) 0.3 nm).<br />
Fig. 4. The normalized intensity variance curves <strong>of</strong> (a) Fe-based BMG and (b) a-Si 3N 4 samples obtained <strong>by</strong> <strong>variable</strong> resolution FEM with different nominal resolutions R.