Powering the energy debate
Powering the energy debate
Powering the energy debate
Create successful ePaper yourself
Turn your PDF publications into a flip-book with our unique Google optimized e-Paper software.
xxx: xxx<br />
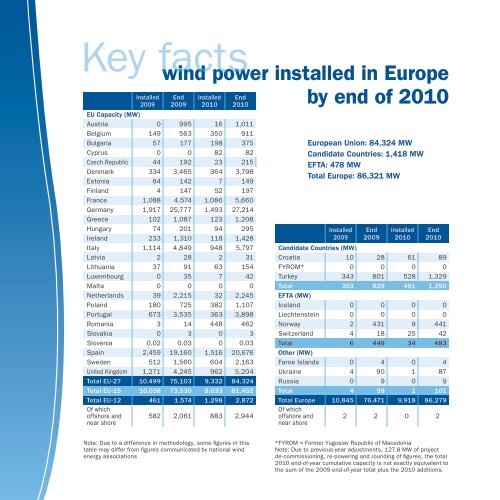
Key facts<br />
Installed<br />
2009<br />
wind power installed in Europe<br />
by end of 2010<br />
End<br />
2009<br />
Installed<br />
2010<br />
End<br />
2010<br />
EU Capacity (MW)<br />
Austria 0 995 16 1,011<br />
Belgium 149 563 350 911<br />
Bulgaria 57 177 198 375<br />
Cyprus 0 0 82 82<br />
Czech Republic 44 192 23 215<br />
Denmark 334 3,465 364 3,798<br />
Estonia 64 142 7 149<br />
Finland 4 147 52 197<br />
France 1,088 4,574 1,086 5,660<br />
Germany 1,917 25,777 1,493 27,214<br />
Greece 102 1,087 123 1,208<br />
Hungary 74 201 94 295<br />
Ireland 233 1,310 118 1,428<br />
Italy 1,114 4,849 948 5,797<br />
Latvia 2 28 2 31<br />
Lithuania 37 91 63 154<br />
Luxembourg 0 35 7 42<br />
Malta 0 0 0 0<br />
Ne<strong>the</strong>rlands 39 2,215 32 2,245<br />
Poland 180 725 382 1,107<br />
Portugal 673 3,535 363 3,898<br />
Romania 3 14 448 462<br />
Slovakia 0 3 0 3<br />
Slovenia 0.02 0,03 0 0,03<br />
Spain 2,459 19,160 1,516 20,676<br />
Sweden 512 1,560 604 2,163<br />
United Kingdom 1,271 4,245 962 5,204<br />
Total EU-27 10,499 75,103 9,332 84,324<br />
Total EU-15 10,038 73,530 8,033 81,452<br />
Total EU-12 461 1,574 1,298 2,872<br />
Of which<br />
offshore and<br />
near shore<br />
582 2,061 883 2,944<br />
European Union: 84,324 MW<br />
Candidate Countries: 1,418 MW<br />
EFTA: 478 MW<br />
Total Europe: 86,321 MW<br />
Installed<br />
2009<br />
End<br />
2009<br />
Installed<br />
2010<br />
End<br />
2010<br />
Candidate Countries (MW)<br />
Croatia 10 28 61 89<br />
FYROM* 0 0 0 0<br />
Turkey 343 801 528 1,329<br />
Total 353 829 461 1,290<br />
EFTA (MW)<br />
Iceland 0 0 0 0<br />
Liechtenstein 0 0 0 0<br />
Norway 2 431 9 441<br />
Switzerland 4 18 25 42<br />
Total 6 449 34 483<br />
O<strong>the</strong>r (MW)<br />
Faroe Islands 0 4 0 4<br />
Ukraine 4 90 1 87<br />
Russia 0 9 0 9<br />
Total 4 99 1 101<br />
Total Europe 10,845 76,471 9,918 86,279<br />
Of which<br />
offshore and<br />
near shore<br />
2 2 0 2<br />
Note: Due to a difference in methodology, some figures in this<br />
table may differ from figures communicated by national wind<br />
<strong>energy</strong> associations<br />
*FYROM = Former Yugoslav Republic of Macedonia<br />
Note: Due to previous-year adjustments, 127.8 MW of project<br />
de-commissioning, re-powering and rounding of figures, <strong>the</strong> total<br />
2010 end-of-year cumulative capacity is not exactly equivalent to<br />
<strong>the</strong> sum of <strong>the</strong> 2009 end-of-year total plus <strong>the</strong> 2010 additions.


