5 - TPAO
5 - TPAO
5 - TPAO

You also want an ePaper? Increase the reach of your titles
YUMPU automatically turns print PDFs into web optimized ePapers that Google loves.
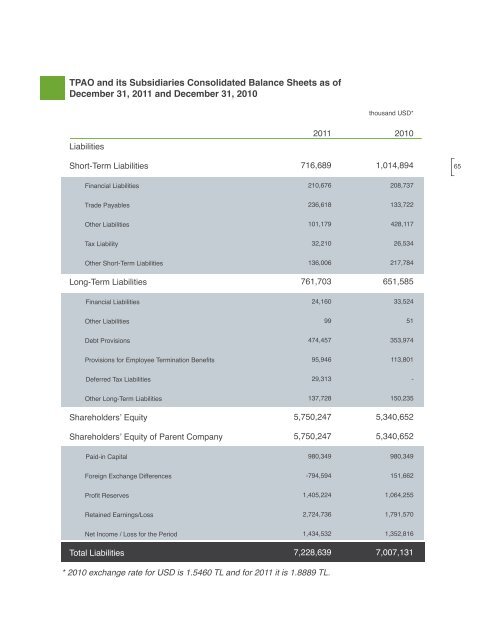
<strong>TPAO</strong> and its Subsidiaries Consolidated Balance Sheets as of<br />
December 31, 2011 and December 31, 2010<br />
thousand USD*<br />
Liabilities<br />
2011 2010<br />
Short-Term Liabilities<br />
716,689<br />
1,014,894<br />
65<br />
Financial Liabilities<br />
210,676<br />
208,737<br />
Trade Payables<br />
236,618<br />
133,722<br />
Other Liabilities<br />
101,179<br />
428,117<br />
Tax Liability<br />
32,210<br />
26,534<br />
Other Short-Term Liabilities<br />
136,006<br />
217,784<br />
Long-Term Liabilities<br />
761,703<br />
651,585<br />
Financial Liabilities<br />
24,160<br />
33,524<br />
Other Liabilities<br />
99<br />
51<br />
Debt Provisions<br />
474,457<br />
353,974<br />
Provisions for Employee Termination Benefits<br />
95,946<br />
113,801<br />
Deferred Tax Liabilities<br />
29,313<br />
-<br />
Other Long-Term Liabilities<br />
137,728<br />
150,235<br />
Shareholders’ Equity<br />
5,750,247<br />
5,340,652<br />
Shareholders’ Equity of Parent Company<br />
5,750,247<br />
5,340,652<br />
Paid-in Capital<br />
980,349<br />
980,349<br />
Foreign Exchange Differences<br />
-794,594<br />
151,662<br />
Profit Reserves<br />
1,405,224<br />
1,064,255<br />
Retained Earnings/Loss<br />
2,724,736<br />
1,791,570<br />
Net Income / Loss for the Period<br />
1,434,532<br />
1,352,816<br />
Total Liabilities<br />
7,228,639<br />
7,007,131<br />
* 2010 exchange rate for USD is 1.5460 TL and for 2011 it is 1.8889 TL.