<strong>TPAO</strong> and its Subsidiaries Consolidated Income Statement for the year ended December 31, 2011 and December 31, 2010 thousand USD* 2011 2010 Sales Income 3,295,138 2,850,823 66 Cost of Sales (-) 1,536,637 1,424,624 Gross Profit (Loss) 1,758,501 1,426,199 Marketing and Sales Expenses (-) 74,949 123,291 General Administrative Expenses (-) 213,068 235,683 Research and Development Expenses (-) 230,614 166,395 Other Operating Revenues (-) 82,091 269,630 Other Operating Expenses (-) 188,467 139,880 Operating Profit (Loss) 1,133,494 1,030,580 The Investment’s Shares in Gains/Losses 3,324 1,545 Non-operating Financial Revenues 966,801 772,038 Non-operating Financial Expenses (-) 362,611 288,073 Continued Operations Before Tax Profit (Loss) 1,741,007 1,516,090 Continued Operation of Tax Profit (Loss) 306,476 163,274 Tax Losses for the Period 268,319 177,269 Deferred Tax Gains (Losses) - 38,157 13,994 Net Income (Loss) 1,434,532 1,352,816 * 2010 exchange rate for USD is 1.5265 TL and for 2011 it is 1.7175 TL.
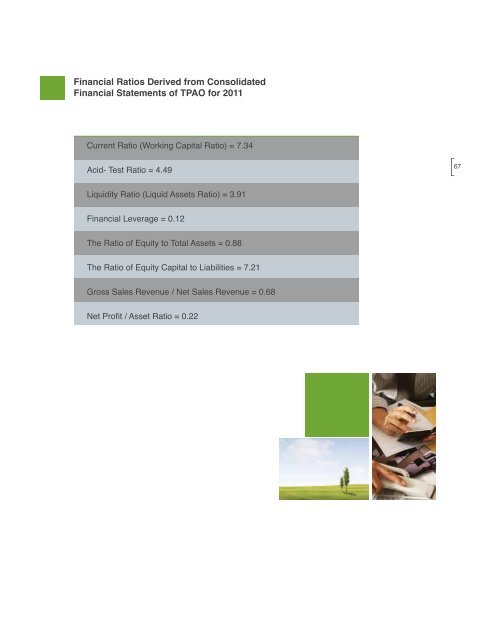
Financial Ratios Derived from Consolidated Financial Statements of <strong>TPAO</strong> for 2011 Current Ratio (Working Capital Ratio) = 7.34 Acid- Test Ratio = 4.49 67 Liquidity Ratio (Liquid Assets Ratio) = 3.91 Financial Leverage = 0.12 The Ratio of Equity to Total Assets = 0.88 The Ratio of Equity Capital to Liabilities = 7.21 Gross Sales Revenue / Net Sales Revenue = 0.68 Net Profit / Asset Ratio = 0.22