Topological basis of signal integration in the transcriptional ...
Topological basis of signal integration in the transcriptional ...
Topological basis of signal integration in the transcriptional ...

Create successful ePaper yourself
Turn your PDF publications into a flip-book with our unique Google optimized e-Paper software.
BMC Bio<strong>in</strong>formatics 2006, 7:478<br />
http://www.biomedcentral.com/1471-2105/7/478<br />
<strong>in</strong>g evolutionary adaptation to chang<strong>in</strong>g environmental<br />
conditions (see, e.g., Refs. [19-21]).<br />
To elucidate <strong>the</strong> type and <strong>in</strong>formation process<strong>in</strong>g role <strong>of</strong><br />
such overrepresented subgraphs, we exam<strong>in</strong>ed <strong>the</strong> abundance<br />
<strong>of</strong> three-node subgraphs <strong>in</strong> <strong>the</strong> S. cerevisiae TR network.<br />
Us<strong>in</strong>g a standard l<strong>in</strong>k-randomization algorithm<br />
(see Methods) we found that <strong>the</strong> feed-forward loop (FFL),<br />
<strong>the</strong> s<strong>in</strong>gle regulatory <strong>in</strong>teraction with mutual regulation<br />
(SMR) and <strong>the</strong> convergence with mutual regulation (CMR)<br />
are overrepresented, i.e., <strong>the</strong>y are motifs (Fig. 1A), while<br />
<strong>the</strong> divergence (DIV), cascade (CAS) and convergence (CNV)<br />
subgraphs are underrepresented, i.e., <strong>the</strong>y are anti-motifs<br />
[18] (Table 1). We also exam<strong>in</strong>ed <strong>the</strong> position <strong>of</strong> <strong>the</strong>se 3-<br />
node subgraphs with respect to <strong>in</strong>dividual origons, and<br />
found that (i) similarly to <strong>the</strong> E. coli TR network [13], only<br />
a subset <strong>of</strong> origons conta<strong>in</strong>s FFL, SMR, and CMR motifs<br />
(Fig. 1B), and (ii) <strong>the</strong> majority (83%) <strong>of</strong> CNV subgraphs<br />
perform <strong>signal</strong> <strong><strong>in</strong>tegration</strong>: <strong>the</strong>y receive regulatory <strong>signal</strong>s<br />
(directly or <strong>in</strong>directly) from two different sources (<strong>in</strong>put<br />
TFs) and transmit <strong>the</strong> jo<strong>in</strong>t <strong>signal</strong> to a s<strong>in</strong>gle node (Fig.<br />
1A).<br />
Functional cartography <strong>of</strong> <strong>the</strong> yeast TR network<br />
External <strong>signal</strong>s, conveyed by various <strong>signal</strong><strong>in</strong>g mechanisms,<br />
may be perceived by <strong>signal</strong>-specific TFs or relatively<br />
non-specific TFs. To understand how <strong>the</strong> responses to<br />
<strong>the</strong>se <strong>signal</strong>s are encoded <strong>in</strong>to <strong>the</strong> topology <strong>of</strong> <strong>the</strong> TR network<br />
we first exam<strong>in</strong>ed <strong>the</strong> degree <strong>of</strong> overlap among <strong>the</strong><br />
genes regulated by <strong>in</strong>put- and <strong>in</strong>termediate TFs. As shown<br />
<strong>in</strong> Figure 2A – where <strong>the</strong> width <strong>of</strong> a l<strong>in</strong>k between two TFs<br />
is proportional to <strong>the</strong> number <strong>of</strong> outputs (targets) <strong>the</strong>y<br />
both regulate – <strong>the</strong> targets <strong>of</strong> different TFs extensively<br />
overlap (only 3 TFs share no targets with o<strong>the</strong>r TFs), suggest<strong>in</strong>g<br />
that most genes are comb<strong>in</strong>atorially regulated by<br />
several TFs. In contrast, direct regulatory <strong>in</strong>teractions<br />
among TFs are more limited (Fig. 2B): <strong>the</strong> largest connected<br />
component <strong>of</strong> <strong>the</strong> network <strong>of</strong> direct regulatory<br />
<strong>in</strong>teractions among TFs (conta<strong>in</strong><strong>in</strong>g 62 nodes) is sparse,<br />
and 30 <strong>of</strong> <strong>the</strong> rema<strong>in</strong><strong>in</strong>g 37 TFs have no regulatory <strong>in</strong>teractions<br />
with o<strong>the</strong>r TFs at all, i.e., <strong>the</strong>y act <strong>in</strong> isolation.<br />
To characterize <strong>the</strong> type <strong>of</strong> comb<strong>in</strong>atorial regulation performed<br />
by each TF, we color coded each <strong>of</strong> <strong>the</strong> 99 TFs<br />
accord<strong>in</strong>g to <strong>the</strong> function(s) <strong>of</strong> <strong>the</strong> genes <strong>the</strong>y regulate. To<br />
this end, we resorted to <strong>the</strong> 33 GO Slim biological process<br />
terms [22], which we grouped <strong>in</strong>to eight GO Slim categories<br />
described <strong>in</strong> <strong>the</strong> Methods. It is evident, that all TFs regulate<br />
genes with various functions (Fig. 2B). For example,<br />
genes with<strong>in</strong> two overlapp<strong>in</strong>g origons – def<strong>in</strong>ed by <strong>the</strong><br />
<strong>in</strong>put TFs Ino4 and Stb1 – display a multitude <strong>of</strong> functions<br />
(Fig. 2C). Stb1 takes part <strong>in</strong> <strong>the</strong> regulation <strong>of</strong> transcription<br />
at <strong>the</strong> G1/S transition [23], while Ino4 is a<br />
positive regulator <strong>of</strong> phospholipid biosyn<strong>the</strong>sis [24].<br />
Similarly to Stb1, <strong>the</strong> two <strong>in</strong>termediate TFs, Swi5 and<br />
Ndd1, regulate temporal expression patterns: Ndd1 is<br />
essential for <strong>the</strong> activation <strong>of</strong> many late S-phase specific<br />
genes [25], while Swi5 activates genes <strong>in</strong> <strong>the</strong> G1 phase and<br />
at <strong>the</strong> M/G1 boundary [26]. Notably, <strong>in</strong> <strong>the</strong> overlap <strong>of</strong> <strong>the</strong><br />
origons Ino4 and Stb1 two major regulatory tasks are <strong>in</strong>tegrated<br />
(Fig. 2C). Among <strong>the</strong> genes conta<strong>in</strong>ed exclusively<br />
by <strong>the</strong> Ino4 origon participation <strong>in</strong> metabolism is very<br />
common, while only one gene is known to perform a cellcycle<br />
related function. For genes conta<strong>in</strong>ed exclusively by<br />
origon Stb1 this relation is reversed, while <strong>in</strong> <strong>the</strong> overlap<br />
<strong>of</strong> <strong>the</strong> two origons both functions are common. Thus, <strong>the</strong><br />
overlap <strong>of</strong> <strong>the</strong>se two origons illustrates <strong>the</strong> coord<strong>in</strong>ation<br />
<strong>of</strong> a temporally regulated event (cell cycle) with ano<strong>the</strong>r<br />
general task (phospholipid metabolism).<br />
For a concise analysis <strong>of</strong> regulatory task <strong><strong>in</strong>tegration</strong> by<br />
overlapp<strong>in</strong>g origons, <strong>in</strong> each <strong>of</strong> <strong>the</strong> 418 overlapp<strong>in</strong>g<br />
origon pairs (A, B), we listed <strong>the</strong> GO Slim biological process<br />
terms for <strong>the</strong> regions A^B (overlap), A\B and B\A<br />
(genes conta<strong>in</strong>ed exclusively by origon A or B). We found<br />
that <strong>the</strong> distribution <strong>of</strong> GO Slim biological processes <strong>in</strong><br />
<strong>the</strong> set A^B is <strong>in</strong> general significantly similar (average Z<br />
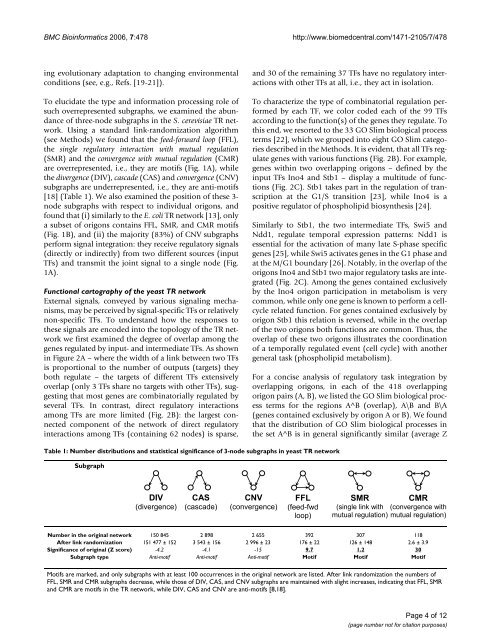
Table 1: Number distributions and statistical significance <strong>of</strong> 3-node subgraphs <strong>in</strong> yeast TR network<br />
Subgraph<br />
DIV<br />
(divergence)<br />
CAS<br />
(cascade)<br />
CNV<br />
(convergence)<br />
FFL<br />
(feed-fwd<br />
loop)<br />
SMR CMR<br />
(s<strong>in</strong>gle l<strong>in</strong>k with (convergence with<br />
mutual regulation) mutual regulation)<br />
Number <strong>in</strong> <strong>the</strong> orig<strong>in</strong>al network 150 845 2 898 2 655 392 307 118<br />
After l<strong>in</strong>k randomization 151 477 ± 152 3 543 ± 156 2 996 ± 23 176 ± 22 126 ± 148 2.6 ± 3.9<br />
Significance <strong>of</strong> orig<strong>in</strong>al (Z score) -4.2 -4.1 -15 9.7 1.2 30<br />
Subgraph type Anti-motif Anti-motif Anti-motif Motif Motif Motif<br />
Motifs are marked, and only subgraphs with at least 100 occurrences <strong>in</strong> <strong>the</strong> orig<strong>in</strong>al network are listed. After l<strong>in</strong>k randomization <strong>the</strong> numbers <strong>of</strong><br />
FFL, SMR and CMR subgraphs decrease, while those <strong>of</strong> DIV, CAS, and CNV subgraphs are ma<strong>in</strong>ta<strong>in</strong>ed with slight <strong>in</strong>creases, <strong>in</strong>dicat<strong>in</strong>g that FFL, SMR<br />
and CMR are motifs <strong>in</strong> <strong>the</strong> TR network, while DIV, CAS and CNV are anti-motifs [8,18].<br />
Page 4 <strong>of</strong> 12<br />
(page number not for citation purposes)