wavefront sensor operated with a faint object
wavefront sensor operated with a faint object
wavefront sensor operated with a faint object

Create successful ePaper yourself
Turn your PDF publications into a flip-book with our unique Google optimized e-Paper software.
Accuracy analysis of a Hartmann-Shack<br />
<strong>wavefront</strong> <strong>sensor</strong> <strong>operated</strong> <strong>with</strong> a <strong>faint</strong> <strong>object</strong><br />
Genrui Cao<br />
Xin Yu<br />
Beijing Institute of Technology<br />
Department of Optical Engineering<br />
Beijing 1 00081 , China<br />
Abstract. A detailed analysis of the characteristics, regularities, and relationships<br />
of the centroiding errors of image spots caused by discrete<br />
and limited sampling, photon noise, and readout noise of the detector in<br />
a Hartmann-Shack <strong>wavefront</strong> <strong>sensor</strong>, wherein an image intensified<br />
charge-coupled device used as a photon detector is presented. The theoretical<br />
analysis and experimental results herein prove useful for optimum<br />
design and application of the <strong>sensor</strong>.<br />
Subject terms: adaptive optics; <strong>wavefront</strong> <strong>sensor</strong>; statistics.<br />
Optical Engineering 33(7), 2331—2335 (July 1994).<br />
1 Introduction<br />
As a servo ioop error <strong>sensor</strong>, the <strong>wavefront</strong> <strong>sensor</strong> is one of<br />
the key parts in the adaptive optical system. Numerous as<br />
the types of <strong>wavefront</strong> <strong>sensor</strong> may be, the choice is critically<br />
restricted by the limited signal photons and limited detect<br />
time for astronomical applications. It is preferable to use the<br />
Hartmann-Shack (H-S) <strong>wavefront</strong> <strong>sensor</strong> using an intensified<br />
charge-coupled device (ICCD) as a photon detector because<br />
they are highly sensitive, flexible, and complex. We first<br />
discuss in detail the characteristics, regularities, and relationships<br />
of centroiding enors of image spots, caused by<br />
limited and discrete sampling, photon noise, and readout<br />
noise. Then we introduce an experimental device of the H-S<br />
<strong>wavefront</strong> <strong>sensor</strong>. Finally, we provide an experimental and<br />
theoretical estimation of its performance.<br />
2 Analyses of Centroiding Accuracy<br />
where<br />
A schematic configuration of the H-S <strong>wavefront</strong> <strong>sensor</strong> is<br />
shown in Fig. 1. As is well known, the radical limitation of<br />
the H-S type <strong>wavefront</strong> <strong>sensor</strong> is that of centroiding image<br />
spot accuracy. Centroiding errors, as a matter of fact, come<br />
mainly from the incident photon noise, the discrete and limited<br />
sampling of the image intensity distribution, and the<br />
readout noise of the detector unit. Goad et al.,1 Kane et al.,2<br />
and Morgan et al.3 indicated the degradation factor of centroiding<br />
accuracy connected <strong>with</strong> the pixel dimensions, quantity,<br />
and duty ratio of pixels. Morgan et al. derived an approximate<br />
equation from the estimation of image spot<br />
centroiding error in the presence of readout noise <strong>with</strong> the<br />
assumption of uniform image intensity distribution on the<br />
pixels. Here, we provide a detailed theoretical and experimental<br />
analysis based on our own work.<br />
Paper 08063 submitted by Acta Optica Sinica; received June 12, 1993; revised<br />
manuscript received Nov. 8, 1993; accepted for publication Nov. 8, 1993.<br />
1994 Society of Photo-Optical Instrumentation Engineers. 0091-3286/94/$6.00.<br />
2.1 Sampling Error<br />
The centroid position of an image spot <strong>with</strong> profile 1(X)is<br />
defined as (for the 1-D case, which is similar to the 2-D case)<br />
J1(X)X dX<br />
Xct =<br />
JJ(X) dX<br />
For an ideal photodetector array of finite size, quantity,<br />
and duty ratio of pixels, the detected centroid position of<br />
image spot would be<br />
Xcd = XiPiI/ Pi,j , (2)<br />
ryj±b/2<br />
(Xi±a/2<br />
P,1 = D(X)W(X) dY dX<br />
J<br />
y1—b/2 J X,—a/2<br />
is the detected photon events in the (i,j)'th pixel;<br />
L/2<br />
D(X) = i=-L/2<br />
[(X— 0.5 —<br />
(1)<br />
is the structure function of detector array; W(X) =l1(X/L) is<br />
the subwindow function divided for the subaperture on a<br />
detector array; "/is the duty ratio of pixels in the X direction;<br />
a and b are the sizes of pixels in the X and Y directions,<br />
respectively; and L and M are the numbers of pixels in the<br />
Xand Ydirections, respectively, <strong>with</strong>in the same subwindow.<br />
Figure 2 shows the geometrical significance of D(X) and<br />
W(X). Figure 3 indicates the sampling errors ofthe centroiding<br />
for different image spot widths. It can be seen from Fig. 3 that<br />
OPTICAL ENGINEERING I July 1 994 I Vol. 33 No. 7 I 2331
CAO and VU<br />
Incoming<br />
distorted waves<br />
0.4<br />
0.2<br />
—0.0<br />
—0.8<br />
—1.0<br />
—1.2<br />
Reference<br />
source<br />
Etor<br />
Lenslet<br />
array<br />
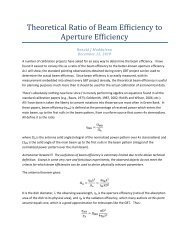
Fig. 1 Schematic configuration of the H-S <strong>wavefront</strong> <strong>sensor</strong>.<br />
D(X)<br />
Inhn .nInInl<br />
-3 —2 —1 0 1 2 3 (pixels)<br />
Fig. 2 Geometrical significance of the CCD structure and subwindow<br />
functions.<br />
Source position (pels)<br />
-0.15<br />
-0.30<br />
0.46<br />
—0.77<br />
1.08<br />
Fig. 3 Sampling error of the centroiding for different image spot<br />
widths.<br />
as the Gaussian width irA of an image spot increases, the<br />
magnitude of the discrete sampling errors will decrease<br />
sharply. But it will be restricted by the cutoff errors at the<br />
window edge and the readout noise, discussed later. Calculations<br />
made have also shown that if the duty ratio of pixels<br />
goes down, the discrete sampling errors will go up. However,<br />
they are almost independent of the subwindow size. If the<br />
ratio of the image spot width to the pixel size ffA/a is larger<br />
than about 0.5, the root mean square of centroiding error<br />
caused by discrete and limited sampling will be less than<br />
°•°2A' whose effects can therefore be neglected.<br />
2.2 Readout Noise Error<br />
Various and complicated as noise sources in a <strong>wavefront</strong><br />
<strong>sensor</strong> may be, they are mainly made up of the so-called<br />
readout noise at the output or input sides of the <strong>sensor</strong>. If<br />
only the readout noise of the detector is taken into consideration,<br />
the variance of detected centroid positions of an image<br />
spot can be derived from Eq. (2) as<br />
2 U Uff%/ 2Ucr<br />
O):— + (3)<br />
cr v2 V4 V3<br />
= XS +<br />
i,j ij/=kl<br />
i,j<br />
i,j<br />
L,M<br />
s+ S,fkl,<br />
ij*kl<br />
XS +<br />
L,M<br />
where U = X, P,3 V = P1 r and r, are the variances<br />
of U and V, respectively; and is the covariance of U and<br />
V. From the calculation, it can be deduced that<br />
S,11X<br />
ij1=kl<br />
where S is the variance of photon events P,3 counted at the<br />
(i,j)'th pixel and S,fkl is the covariance for the (i,j)'th and<br />
(k, l)'th pixels in a subwindow.<br />
If only the readout noise or is taken into account, and a<br />
uniform response of pixels is assumed, we have<br />
S,21=j . (5)<br />
Because the number of pixels assigned for each subwindow<br />
is usually big enough, we are justified to set S,Jkl =0.<br />
Substituting Eqs. (4) and (5) into Eq. (3), we find<br />
2<br />
L,M L,M<br />
cr ( 2 LMX— 2X<br />
x)<br />
2 L<br />
=M( xi+i.x)<br />
7L2_1 \<br />
=ML 12 +X) ,<br />
(6)<br />
where X is the average centroid position of image spot in<br />
the subwindow as the image spot is wobbled by the air turbulence.<br />
Because the average centroid position of image spot in<br />
each subwindow can be shifted to be coincident <strong>with</strong> its origin<br />
of coordinates by adjustment, the variance of image spot<br />
centroid position (X) can be related to the variance of incident<br />
<strong>wavefront</strong> tilt (a2) <strong>with</strong>in subaperture. In the case of<br />
subaperture diameter being equal to the atmospheric coherence<br />
length r0, the variance of incident <strong>wavefront</strong> tilt by<br />
definition4 should be<br />
(4)<br />
2332/OPTICAL ENGINEERING/July 1994/Vol. 33 No.7
ACCURACY ANALYSIS OF A HARTMANN-SHACK WAVEFRONT SENSOR<br />
(ct2) = 6.88/(K2r)<br />
where K = 2'rr/X. From geometrical optics, we can relate X<br />
and a as<br />
X =<br />
=O.417XF# (8)<br />
where F# is the f/# of lenslet and r0/d refers to the angle<br />
magnification at the entrance pupil of lenslet.<br />
Generally, the intensity distribution of a diffracted image<br />
spot can be denoted by the Gaussian distribution matched at<br />
the e1 points. The rms width of an image spot diffracted<br />
by the circular aperture (CA) or the square aperture (SA) are,<br />
respectively,<br />
Therefore, Eq. (6) can be rewritten as<br />
if2<br />
1L2_1<br />
criMM 12 +0.936ff4) (for CA)<br />
or ff 2 ML(L12<br />
1<br />
.36ff) (for SA) . (14)<br />
It can be found that the centroiding errors of image spots<br />
are dependent not only on the readout noise itself but also<br />
on the size of the subwindow assigned for each image spot<br />
on the ICCD and the total number of photons included in<br />
each subaperture. Reducing the size of the subwindow can<br />
help to reduce effectively the centroiding errors caused by<br />
the readout noise, as shown in the experimental results of<br />
Table 1. However, it will be also restricted by the sampling<br />
errors and dynamic range of image spot wobbling. Therefore,<br />
a trade-off should be made between the readout noise and<br />
the subwindow size, pixel size, and image spot size.<br />
As to the influence of photon noise on the centroiding<br />
error or image spot, substituting o in Eq. (5) <strong>with</strong> P,1, we<br />
find the well-known equation,<br />
o=o-N . (15)<br />
(7) spot can be summarized as<br />
(16)<br />
Within a subaperture, the maximum optical path difference<br />
(OPD) error concerned <strong>with</strong> the centroiding error of<br />
image spot is<br />
Wmax = \/°x , (17)<br />
and the rms of OPD error is<br />
LWrms = VX(41)<br />
=O.lS2XffX/crA (for CA) , (18)<br />
or =<br />
= 0.43 1XF# (for CA) , (9)<br />
=0. l46Xo/cr8 (for SA) . (19)<br />
or crB=O.358XF (for SA) . (10)<br />
Note that in the case of square subaperture, F# is understood<br />
Comparing the Eqs. (9) and (10) <strong>with</strong> Eq. (8), we can deduce as the ratio of focal length of the lenslet to its clear aperture<br />
size of square. For example, if we have B= 0.5, L = M = 12,<br />
(X) = O.936r (for CA)<br />
( 1 1) °r 01 V= 100, and a = b, then the variance of centroiding<br />
errors calculated from the preceding related equations can be<br />
or (XC) = 1 .36r (for SA)<br />
( 1 2)<br />
deduced as<br />
ff? cr0+00025 + 0.0018 = 0.0043<br />
(13) and WrmsO.l46XffX/ffBX/52 (for SA)<br />
where the units of o•, L, M, and r are the pixel size, whereas<br />
the units of (Tr and V are the photon event.<br />
3 Experimental Results<br />
Figure4 shows an experimental H-S <strong>wavefront</strong> <strong>sensor</strong> device<br />
using an ICCD as a photon detector in which the lens array<br />
consists of 76 lenslets <strong>with</strong> the 255-mm focal length and a<br />
clear aperture of 1 .5 X 1 .5 mm2. The image spot array is thus<br />
enhanced by an image intensifier coupled to a high-framerate<br />
CCD <strong>with</strong> a most powerful relay lens. An associated<br />
photon counter is used for calibrating magnitude of the light<br />
source.5 An optical wedge is used for simulation of the wave-<br />
Reference<br />
source<br />
2.3 Performance Estimation<br />
Because all of the previously mentioned errors are independent<br />
of each other, the complete centroiding errors of image<br />
filter<br />
Table 1 Experimental results for centroiding errors and the corresponding<br />
subwindow sizes.<br />
MXL(pixels) 13X13 21X21 33X33 41X41<br />
cx.(pixels) 0. 46X 10 0. 98X 102 1. 9X 10.2 44X 10.2<br />
Fig. 4 Experimental H-S <strong>wavefront</strong> <strong>sensor</strong> device.<br />
OPTICAL ENGINEERING / July 1994 / Vol. 33 No. 7 / 2333
CAO and YU<br />
front tilt. The V(X) filter in the system can be used to eliminate<br />
the spectral response difference between the photon counter<br />
and the ICCD.<br />
For an actual ICCD detector, the major source of the centroiding<br />
errors comes from the readout noise and the photon<br />
noise. Therefore it is meaningful to measure the readout noise<br />
of the detector unit directly. Generally speaking, the noise<br />
made in an ICCD detector <strong>operated</strong> in multiphoton mode<br />
consists mainly of the inherent photon noise of the photon<br />
signals and the readout noise of detector and its associated<br />
circuits. Because they are independent of each other, the<br />
variance of the total noise can be measured at the output end<br />
of ICCD as6'7<br />
20<br />
10<br />
a ,=2.87 photons/pixel<br />
Fig. 5 Experimental results of the readout noise ff and the gain G<br />
of an ICCD detector. (ADU—the minimum unit of digital readout from<br />
AID converter.)<br />
ff = g2o- + g2o , (20)<br />
where g is the photon gain of ICCD detector and r is the<br />
variance of photon events, which is equal to its mean value<br />
pi according to the Poisson distribution. Hence, we have<br />
o=g2p+g2o<br />
=gp0+g2o , (21)<br />
where Po 5 the mean number of photons at the output side<br />
of the ICCD. For computer data processing convenience, this<br />
equation can be modified as<br />
k2o = k2gp0 +k2g2o<br />
where k is the convertor factor of single photon event into<br />
digits in the calculations. If we let ka0 = n0, kg =G, and<br />
kp0 = P0, then we have<br />
n=GP0+G2o . (23)<br />
It is evident that by recording two frames of flat-field P0 and<br />
P; and one frame of dark-field D for different photon signal<br />
levels, we can deduce a series of data about total noise variances<br />
and their corresponding mean signals calculated from<br />
the following equations, respectively,<br />
n=; : (P01-P1)<br />
and P0 =<br />
L, M<br />
[(P0 — D1) + (P1 — D,1)]<br />
Figure 5 shows the experimental results of the readout<br />
noise r and the digitalized photon gain G of an ICCD detector,<br />
where the readout noise is quite significant, because<br />
the ICCD was not being cooled. The experiments also show<br />
that an accuracy of X/14 rms OPD has been achieved corresponding<br />
to a 100 X 100mm2 subaperture and 1 ms of sampling<br />
time for a sixth visible magnitude of <strong>object</strong>.<br />
4 Conclusions<br />
The ICCD detector has displayed a good performance <strong>with</strong><br />
an H-S <strong>wavefront</strong> <strong>sensor</strong> <strong>operated</strong> <strong>with</strong> the <strong>faint</strong> <strong>object</strong>s, but<br />
its readout noise, in addition to the photon noise, may seriously<br />
degrade the centroiding accuracy of image spot. The<br />
readout noise comes mainly from the image intensifier and<br />
can be significantly reduced by cooling its photocathode.<br />
The influence of readout noise on the centroiding errors<br />
for the H-S <strong>wavefront</strong> <strong>sensor</strong> can be reduced to a considerable<br />
degree by appropriately limiting the size of the window assigned<br />
for each subaperture on the ICCD and shifting the<br />
centers of wobbling image spots to be coincident <strong>with</strong> their<br />
origins of coordinates in each subwindow.<br />
Acknowledgments<br />
This work was supported by the Hightech Project of China.<br />
(22) We would like to thank Prof. Dazun Zhao for helpful discussion<br />
and Mr. Guihua Cui for partial work on computer<br />
programming of sampling error.<br />
References<br />
1. L. Goad, F. Roddier, J. Beckers, and P. Eisenhardt, "Criteria for the<br />
<strong>wavefront</strong> <strong>sensor</strong> selection,' ' The NNTT Technology Development Program<br />
Report No. 9 (March 1986).<br />
2. T. Y. Kane, B. M. Welsh, C. S. Gardner, and L. A. Thompson, "Wavefront<br />
detector optimization for laser guided adaptive telescope,' ' Proc.<br />
SPIE 1114, 160—171 (1990).<br />
3. J. S. Morgan, D. C. Slater, J. G. Timothy, and E. B. Jenkins, "Centroid<br />
position measurements and subpixel sensitivity variations <strong>with</strong> the<br />
MAMA detector," Appi. Opt. 28(6), 1 178—i 192 (1989).<br />
4. V. Tatarski, Wave Propagation in a Turbulent Medium, McGraw-Hill,<br />
New York (1961).<br />
(24) 5. G. Cao, X. Yu, R. Gu, R. Zhou, and D. Zhao, ' 'An experimental study<br />
on photon noise limited wave front <strong>sensor</strong>,' ' Proc. SPIE 1230, 456—460<br />
(1990).<br />
6. B. Ye, Xinming, and C. Wang, ''The characteristics of CCDs and their<br />
evaluation,' ' Publications of Purple Mountain Observatory, 2(4), 8 1—92<br />
(25) (1983) (in Chinese).<br />
7. S. Marcus, R. Nelson, and R. Lynds, "Preliminary evaluation of a fairchild<br />
CCD-21 1 a new camera system,"Proc. SPIE 172,207—231(1979).<br />
Genrui Cao graduated from the Department<br />
of Optical Engineering, Beijing Institute<br />
of Technology, China, in 1963, where<br />
he has been a faculty member for about<br />
30 years. Prof. Cao's areas of research<br />
are optical testing, image assessment, interferometry,<br />
optical fabrication, adaptive<br />
optics, and <strong>wavefront</strong> sensing. He has developed<br />
a series of instruments and has<br />
published a series of papers and books in<br />
these fields. From 1985 to 1987 he worked<br />
as a visiting scholar in the fields of large optics testing and scattering<br />
at the Optical Sciences Center, University of Arizona.<br />
2334/ OPTICAL ENGINEERING / July 1994 / Vol. 33 No. 7
ACCURACY ANALYSIS OF A HARTMANN-SHACK WAVEFRONT SENSOR<br />
Xin Vu is a professor in and director of the<br />
Department of Optical Engineering, Beijing<br />
Institute of Technology, China. His research<br />
includes infrared technology, gas<br />
laser devices, and optoelectronic metrology<br />
methods. He currently heads a project<br />
in the adaptive optics system <strong>with</strong> <strong>wavefront</strong><br />
distortion through atmospheric turbulence,<br />
low-light-level <strong>wavefront</strong> <strong>sensor</strong>s,<br />
signal processing, and wide-field and partial<br />
correction adaptive optics theory. Prof.<br />
Yu graduated from Beijing Institute of Technology in 1963 and studied<br />
as a visiting scholar at State University of New York at Stony<br />
Brook from 1984 to 1986.<br />
OPTICAL ENGINEERING / July 1994 / Vol. 33 No. 7 / 2335