WP3: Rail Passenger Transport - TOSCA Project
WP3: Rail Passenger Transport - TOSCA Project
WP3: Rail Passenger Transport - TOSCA Project

Create successful ePaper yourself
Turn your PDF publications into a flip-book with our unique Google optimized e-Paper software.
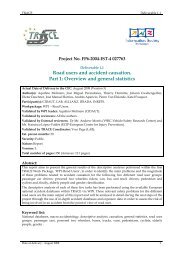
Technology Opportunities and Strategies toward Climate-friendly trAnsport<br />
FP7-TPT-2008-RTD-1<br />
Coordination and Support Action (Supporting)<br />
Deliverable D4 (<strong>WP3</strong> report No 1)<br />
<strong>Rail</strong> passenger transport<br />
Techno-economic analysis of energy and greenhouse gas reductions<br />
Royal Institute of Technology (KTH), Stockholm, Sweden<br />
2011-03-29<br />
Evert Andersson, Mats Berg, Bo-Lennart Nelldal, Oskar Fröidh<br />
Dissemination level<br />
Public PU X<br />
Restricted to other programme participants (including Commission Services)<br />
Restricted to a group specified by the consortium (including Commission<br />
Services)<br />
Confidential, only for members of the consortium (including Commission<br />
Services)<br />
PP<br />
PE<br />
CO
Coordinator<br />
Dr. Andreas Schaefer<br />
University of Cambridge<br />
Institute for Aviation and the Environment<br />
AIM Group Dept of Architecture<br />
1-5 Scroope Terrace, Cambridge CB2 1PX, UK<br />
Tel: +44-1223-760-129<br />
Fax: +44-341-2434-133<br />
E-mail: as601@cam.ac.uk<br />
Internet: www.toscaproject.org<br />
Contact:<br />
Royal Institute of Technology (KTH)<br />
Dept. of Aeronautical and Vehicle Engineering<br />
Teknikringen 8<br />
SE - 100 44 Stockholm, Sweden<br />
Internet:<br />
www.kth.se/ave<br />
Prof. Evert Andersson<br />
Tel: +46 8 790 7628<br />
Fax: +46 8 790 7629<br />
E-mail: everta@kth.se<br />
Prof. Mats Berg<br />
Tel: +46 8 790 8476<br />
Fax: +46 8 790 7629<br />
E-mail: mabe@kth.se<br />
The <strong>TOSCA</strong> project (Technology Opportunities and Strategies toward Climate-friendly trAnsport)<br />
aims to identify promising technology and fuel pathways to reduce transportation-related<br />
greenhouse gas emissions through mid century about 2050. An important building block of this<br />
project is the techno-economic specification of low-GHG emission transportation technologies and<br />
other means, which are input into a scenario analysis. <strong>TOSCA</strong> considers all major modes of<br />
passenger and freight transport, along with transportation fuels and technologies capable of<br />
enhancing infrastructure capacity. This report on rail passenger transport is thus one out of a<br />
number of such techno-economic studies.<br />
Deliverable D4 – <strong>WP3</strong><br />
II
CONTENTS<br />
CONTENTS<br />
ABBREVIATIONS AND DEFINITIONS<br />
ABSTRACT 1<br />
1. INTRODUCTION 3<br />
2. REFERENCE SYSTEMS CHARACTERISTICS 4<br />
3 TECHNOLOGY DEVELOPMENT 6<br />
3.1 General 6<br />
3.2 Technology trajectories 7<br />
3.3 Technology descriptions 8<br />
3.4 Incremental improvements and higher speed 12<br />
3.5 Technology scenarios to be further considered and investigated 13<br />
4. CONSTRAINTS FOR REDUCING GHG EMISSIONS 16<br />
5. RESULTS 18<br />
5.1 Technology readiness and R&D requirements 18<br />
5.2 Energy and GHG emissions 19<br />
5.3 Cost for reducing GHG emissions 24<br />
5.4 Scalability 30<br />
5.5 Social acceptability 31<br />
5.6 User acceptability 32<br />
6. SUMMARY AND CONCLUSIONS 34<br />
6.1 Summary 34<br />
- Low-GHG electricity 34<br />
- Eco-driving 35<br />
- Space efficiency 35<br />
- Energy recovery 35<br />
- Low-drag 36<br />
- Low-mass 36<br />
- Incremental improvements 36<br />
- Combination of measures 37<br />
- Higher speeds and combinations 37<br />
- Incentives needed 37<br />
6.2 Conclusions 37<br />
REFERENCES 39<br />
III<br />
IV<br />
Deliverable D4 – <strong>WP3</strong><br />
III
ABBREVIATIONS AND DEFINITIONS<br />
Articulated train<br />
Carbody<br />
Train unit where two carbody ends are supported by the same running gear<br />
(wheels, suspension etc).<br />
The part of a rail vehicle, above the running gear, where the payload<br />
and/or the train crew is carried.<br />
CO2-eq<br />
Carbon dioxide (CO2) equivalents of greenhouse gases, so that the global<br />
warming potential of a mix of gases can be directly compared.<br />
DMU Diesel Multiple Unit, i.e. a train unit consisting of self-propelled rail cars<br />
powered by diesel engines.<br />
Dual mode<br />
In this context, a rail vehicle being able o run both in the electric mode (fed<br />
by an external overhead electrical wire) or by diesel engines.<br />
Eco-driving<br />
Driving style with intention to reduce or minimise energy use.<br />
Energy recovery Train technology where the (electric) motors are used as generators while<br />
braking, to send generated energy back to the electric supply system or to<br />
storage on board the train.<br />
Energy use<br />
Net energy intake to the train or to the railway system, after subtraction of<br />
energy recovered when braking.<br />
EMU<br />
Electrical Multiple Unit, i.e. a train unit consisting of self-propelled rail cars<br />
powered by an electric drive system.<br />
EU-12 The newest 12 member states of the EU, joining after year 2000.<br />
EU-15 The first 15 member states of the EU, joining before year 2000.<br />
EU-27 All 27 member states of the EU (2009).<br />
GHG<br />
Greenhouse gas<br />
High-speed train In this context, trains with an admissible top speed of at least 250 km/h.<br />
Incremental improvement Improvements in small steps.<br />
KTH<br />
Kungliga Tekniska Högskolan, the Technical University of Stockholm, also<br />
called the Royal Institute of Technology.<br />
Load factor<br />
Same as ‘seat occupancy rate’, i.e. occupied seat-km divided by the total<br />
number of run seat-km of a train. Load factor is usually determined over a<br />
period of time.<br />
MEUR<br />
Million Euros<br />
pkm<br />
<strong>Passenger</strong>-km<br />
<strong>Rail</strong>energy<br />
EU-funded project on energy efficiency for railways. www.railenergy.org<br />
R&D<br />
Research and Development<br />
Sales price<br />
Price to customer, excluding taxes and other duties, with general price<br />
levels and currency rates as in 2009.<br />
Specific energy (or GHG) Energy use (or GHG emissions) per passenger-km.<br />
STEC<br />
Simulation of Train Energy Consumption (software developed by KTH).<br />
Technology readiness In this context, time when a new product or system is developed to a state<br />
where it can be offered for sale.<br />
Top speed<br />
Maximum operational speed<br />
UIC<br />
International Union of <strong>Rail</strong>ways.<br />
WP<br />
Work Package (of the <strong>TOSCA</strong> project).<br />
Deliverable D4 – <strong>WP3</strong><br />
IV
ABSTRACT<br />
In Stage 1 of the EU/FP7-funded project <strong>TOSCA</strong> (Technology Opportunities and Strategies<br />
toward Climate-friendly trAnsport) the techno-economical feasibility of different technologies<br />
and means to reduce greenhouse gas (GHG) emissions is being analysed for the different<br />
modes of transport. This is made in the long-term perspective until 2050, with 2009 as the<br />
reference year. This is the report on rail passenger transport, applicable to the European Union<br />
(EU-27).<br />
The present report has been subject to review among railway experts, representing train<br />
suppliers, railway operators as well as academia. They have also responded to a questionnaire.<br />
Further, a workshop was held, where the report with assumptions and results was discussed.<br />
In the analysis presented in this report it is estimated that a number of efficient improvements<br />
that, individually and in combination, are available in order to significantly reduce energy use<br />
and the resulting GHG emissions on the rail passenger market until 2050. The analysis has<br />
considered different technologies and means:<br />
– low air drag<br />
– low train mass<br />
– energy recovery<br />
– eco-driving, including traffic flow management<br />
– space efficiency in trains (increasing payload per metre of train)<br />
– incremental improvements of energy efficiency, in particular reduced losses.<br />
Despite anticipated higher average train speeds in the future these combined approaches will,<br />
according to the analysis, have the potential to reduce the average specific energy use per<br />
passenger-km (pkm) in the order of 45–50 % in the very long term until 2050. As a consequence<br />
also the direct and indirect GHG emissions will be reduced. The highest reductions are<br />
possible in city and regional rail operations. Reductions are more limited in high-speed operations,<br />
because of the advanced technologies already applied. However, high-speed rail has<br />
today a comparatively low energy use per passenger-km, partly due to its high average load<br />
factor. To be consistent with other work packages of <strong>TOSCA</strong>, energy use and GHG emissions<br />
are measured per passenger-km, assuming representative load factors in different operations.<br />
Irrespective of reductions in energy use, by far the most effective mean of reducing GHG<br />
emissions from European rail operations is the provision of low-GHG electricity, which<br />
depends on technologies that will be introduced outside the railway sector; the end result being<br />
dependent of the degree of GHG reductions in the future European mix of electricity.<br />
A 60–80 % reduction of GHG content in future average European electric power, is approximately<br />
within the different scenarios of <strong>TOSCA</strong> WP6. The resulting CO 2 -eq emissions are then<br />
estimated to 4–11 g CO 2 -eq per passenger-km, which is very favourable.<br />
The results might be seen as optimistic, but they are due to the combination of a number of<br />
technologies, which to some extent also reinforce each other. It should also be pointed out that<br />
some options are not analysed in detail at this stage, and not included in the above estimations,<br />
i.e. (1) increased average load factor on trains, (2) modular trains with capacity according to<br />
actual need, (3) dual-mode operations (diesel and electric) and hybrid trains, (4) introduction of<br />
bio fuels in diesel engines and (5) additional electrification of railways or increased investment<br />
in rail infrastructure. A thorough analysis of these options involves many uncertain technical,<br />
economical, operational and societal considerations. They are all out of the scope and time<br />
frame of this study. In particular heavy investment in rail infrastructure above levels of 1995-<br />
2010 would further reduce per-unit operation cost, specific energy use and GHG emissions.<br />
Deliverable D4 – <strong>WP3</strong> passenger 1
Magnetic levitation is excluded from further analysis, since it is considered not to be an<br />
efficient mean of reducing energy use and GHG emissions. These systems are not even interoperable<br />
with existing rail systems and have serious cost implications.<br />
Cost and incentives<br />
In most cases the proposed technologies have modest implications for the asset price of trains<br />
and will in the long term pay for themselves through lower cost of maintenance and energy.<br />
However, many train operators and leasing companies are expected to be conservative and<br />
hesitate to introduce new technologies that will result in additional investment and technical<br />
risks. In the rail sector there is currently a tendency to prioritize the first cost (investment cost)<br />
and pay less attention to the long-term life cycle cost and to the income side of the account.<br />
For the above reasons some evident economic incentives (or possibly legislation) within the<br />
EU would be useful to help bring railways onto a still more ambitious environmental path. In<br />
particular, low-drag and low-mass trains, as well as dual-mode trains, may need additional<br />
incentives to be introduced.<br />
The energy performance is often unclear and uncertain for the corporate decision maker when<br />
purchasing a new train.. Therefore it is essential to have a standard for mandatory declaration<br />
and certification of energy performance, as is done for some road vehicles. Such<br />
standardization would contribute to confidence in energy-saving features.<br />
Support for R&D is important. Substantial research is needed for low-mass trains, and partly<br />
also for reduced air drag and eco-driving.<br />
Acceptability<br />
It is anticipated that society and users would not present any strong positive or negative<br />
attitudes to the proposed measures, provided that noise and vibration emissions are kept within<br />
accepted limits. However, public resistance might, from time to time, occur against new<br />
railway infrastructure undertakings, in particular if new railway links are planned.<br />
Infrastructure upgrading<br />
EU-27 has a low market share (8 %) for passenger rail transport (including metros and<br />
tramways) in comparison to some other highly developed countries outside EU, in particular<br />
Japan (32 %) and and Switzerland (16 %). In order to achieve a considerably higher market<br />
share, European passenger rail must be developed according to “best practice” in the world,<br />
through reduced journey time as well as improved reliability and cost efficiency.<br />
If a considerable modal shift to rail is envisaged a major restriction is the need for capacity and<br />
overall performance in the rail transport system and, consequently, funding for improvement of<br />
the railway infrastructure. A comparatively large share of investments in transport<br />
infrastructure must be directed toward rails systems. New high-speed railway links are needed<br />
in addition to upgrading of the existing infrastructure. Besides enhancing capacity, also speed,<br />
noise abatement, reliability and general flexibility must be improved.<br />
Upgrading the existing infrastructure is also partly necessary to fully implement proposed<br />
technologies. On some rail networks it is desirable to enlarge the loading gauge (useful cross<br />
section of vehicles) and on some networks the electric supply systems should be upgraded in<br />
order to fully be able to recover electric energy. These improvements are anticipated to be<br />
consistent with average 1995-2010 levels of rail infrastructure investment (0.3 % of GDP).<br />
Generally the cost and GHG implications for improving and maintaining new or existing rail<br />
infrastructure is not part of this study, as is also the case for the equivalent studies for road, air<br />
and maritime transport. Current track-access charges are however included in cost estimations<br />
for rail operations. Taxes and similar duties are not included.<br />
Deliverable D4 – <strong>WP3</strong> passenger 2
1 INTRODUCTION<br />
<strong>Rail</strong> passenger transport in the EU-27 totalled in 2007 a volume of 480 billion passenger-km,<br />
of which metros and trams made accounted for some 85 billion (EU, 2009). The market share<br />
was almost 8 % of the total passenger transport volume (in passenger-km, intra-EU), although<br />
with large variations between countries. In comparison some non-EU countries with well<br />
established and managed rail networks had considerably higher market shares; as shown in<br />
Table 1-1 below.<br />
Table 1-1<br />
Market shares in passenger transport by 2007 (passenger-km, pkm)<br />
Source: EU (2009): EU energy and transport in figures<br />
Road (car, bus) EU-27 83 %<br />
Air EU-27 9 %<br />
<strong>Rail</strong> EU-27 8 %<br />
cf. Switzerland 16 %<br />
Japan (approx) 32 % (2006)<br />
The market share for the rail mode declined in Europe for a long time until the mid 1990´s.<br />
After 1995 the decline has continued in the new member states (EU-12). However, in the old<br />
member states (EU-15) rail passenger transport has recovered to some extent, as result of new<br />
EU and national rail policies leading to investments in new trains and infrastructure, as well as<br />
the ongoing attempts of market liberalization. The most successful countries in this respect are<br />
France, UK and Sweden. Table 1-2 shows the development of the passenger rail market<br />
(excluding trams and metros) in some areas and countries in the period 1995–2007, in<br />
comparison to the average development of all transport modes.<br />
Table 1-2<br />
Development of passenger transport (passenger-km) in EU-27 in the<br />
period 1995-2007, rail and average of all modes. Source: EU (2009)<br />
Average all modes EU-27 +22 %<br />
<strong>Rail</strong> EU-27 +13 %<br />
EU-12 (new members, average) -33 %<br />
EU-15 (old members, average) +25 %<br />
France+UK+Sweden +52 %<br />
It is concluded that these new policies have started a revitalization of railways in Europe,<br />
although not yet in all member states.<br />
<strong>Rail</strong> passenger transport is widely considered to have low specific energy consumption and low<br />
direct or indirect greenhouse gas (GHG) emissions, in comparison to competing modes of<br />
transport. Although this is not always true, it is usually the case in electric train operations, in<br />
particular when the electricity mix is dominated by renewable primary energy sources or<br />
nuclear power. Diesel trains are usually not outstanding in energy and emission performance,<br />
but can in many cases also be very competitive in the energy and GHG respect.<br />
The main reasons for the low energy consumption are the following technical characteristics<br />
that are inherent in the basic rail technology:<br />
- Rolling resistance is very low with smooth hard wheels running on smooth hard rails.<br />
- Most vehicles in a long train are (to a large extent) shielded from the air drag by other<br />
vehicles ahead or behind.<br />
Deliverable D4 – <strong>WP3</strong> passenger 3
- An electrical wire (so-called catenary) can be positioned over the track, thus facilitating<br />
a simple mean of electricity supply and energy recovery. In some cases the overhead<br />
catenary is replaced by a third rail for supply of electricity.<br />
- Electric energy can, with modern technology, be partly recovered and fed back to other<br />
trains, by using the electrical motors as generators when braking (retarding or<br />
maintaining speed on descents).<br />
There are also technical features in today’s technologies that are less favourable with regard to<br />
energy and GHG emissions. For example, the vehicle mass and space per passenger seat is<br />
usually high, some trains have an unfavourable exterior shape with regard to aerodynamic<br />
drag, and there are still substantial losses in the power equipment. In some cases (e.g. in lower<br />
traffic flows) the quite long trains may not be fully utilized. Furthermore, about 10–12 % of the<br />
total rail passenger transport (in passenger-km) in Europe still relies on diesel powered trains<br />
(i.e. not using external sources of electricity). In conclusion the favourable inherent technical<br />
characteristics of the rail mode have for a long time not been fully utilized. A reason for not<br />
prioritizing energy issues is likely that railway companies have, until quite recently, felt that<br />
the energy cost is not an essential part of the total cost. Recently, however, there is a steadily<br />
increasing awareness of the economical and ethical implications of energy consumption and<br />
GHG emissions.<br />
For the above reasons there is potential for further improvement, partly be relatively simple<br />
means. Some of the necessary technologies and measures are known and partly already<br />
implemented. Due to increasing awareness of environmental responsibility as well as<br />
economical incentives they are expected to be more widely used in the future.<br />
2 REFERENCE SYSTEMS CHARACTERISTICS<br />
To facilitate a consistent evaluation of different technologies for the reduction of energy<br />
consumption and its resulting GHG emissions, four reference trains are defined in Table 2-1.<br />
These reference trains are estimated to represent around 95 % of the total rail passenger<br />
transport volume in Europe (in passenger-km, pkm). Metro trains are included in the group<br />
‘Local city trains’, being quite similar with regard to energy and operational characteristics.<br />
Based on EU and national statistics, the approximate market shares for different types of trains<br />
and train services are estimated within <strong>TOSCA</strong> <strong>WP3</strong>; see Table 2-1.<br />
It should be noted that the defined reference trains are typical new trains that are put into<br />
service in the reference year 2009. They will to some degree differ in performance from the<br />
average fleet of trains in service. The techno-economical lifetime of European trains are<br />
usually in the order of 25 years, sometimes longer. The principle of using the average new<br />
reference vehicles delivered in 2009 is used throughout the Tosca project, also in workpackages<br />
for road, air and maritime transport. In all cases there will be delays in their<br />
introduction.<br />
Energy estimations are made from several sources (Andersson et al, 2006), (Kemp et al, 2007),<br />
(Lukaszewicz, 2001), (Lukaszewicz et al, 2009), (RSSB, 2007), (<strong>Rail</strong>energy, 2009) as well as<br />
un-published data. Energy data have been judged and confirmed with the KTH simulation<br />
software STEC (Simulation of Train Energy Consumption). Included in this stage of <strong>TOSCA</strong><br />
<strong>WP3</strong> is the direct energy for propulsion, auxiliaries and comfort, also including losses in the<br />
railway’s dedicated electric supply system.<br />
Cost estimates are made by experts within <strong>WP3</strong>, with cost models used at KTH. Note that<br />
operating cost at this stage excludes energy cost, as energy cost is a variable in Stage 2 of<br />
<strong>TOSCA</strong>.<br />
Deliverable D4 – <strong>WP3</strong> passenger 4
Table 2-1<br />
Reference characteristics (average new 2009 systems in operation)<br />
High-speed<br />
train unit<br />
Electric<br />
Intercity or<br />
regional<br />
Electric<br />
Intercity<br />
or<br />
regional<br />
Diesel<br />
Local<br />
city train<br />
Electric<br />
Train configuration a 2 PU + 8 Tda L + 8 T 6 DMU 12 EMUa<br />
Train length (m) 200 230 150 214<br />
Capacity (seats) ∙ load factor 510 ∙ 0.65 480 ∙ 0.40 330 ∙0.40 750 ∙ 0.35<br />
Operational mass, incl. average load (tonnes) 410 480 280 430<br />
Typical max operational speed b (km/h) 300 160 140 140<br />
Average scheduled stopping distance (km) 120 24 20 3<br />
Average speed, incl. stops (km/h) 200 105 85 55<br />
Running distance per year (1000 km) 500 250 200 120<br />
Max power at rail (kW) 9000 6000 1500 8500<br />
European rail market share (% pass-km) f 20 43 12 25<br />
Energy use – at train intake c (MJ/pass-km) 0.22 0.32 0.73 0.35<br />
Energy – from public grid (MJ/pass-km) 0.24 0.36 - 0.38<br />
GHG emissions (g CO 2 -eq per pass-km) 31 d 46 d 65 49 d<br />
of which direct emissions 0 0 54 0<br />
Sales price of train unit (MEUR) 28 16 12 14<br />
Operating costs e (EUR per pass-km) 0.063 0.101 0.127 0.095<br />
Average lifetime (years) g 25 25 25 25<br />
a<br />
DMU = Diesel multiple unit cars; EMU = Electric multiple unit cars; L = locomotive; PU = Power unit;<br />
T = trailer car; Index “a” = articulated train; Index “d” = double decker.<br />
b Maximum speed is not reached on all sections of the line and not on all lines.<br />
c<br />
Net electricity as intake to the train, i.e. energy recovery is subtracted. Intake to the railway facility into<br />
converter or transformer station) is assumed to be 10 % higher on average.<br />
For liquid fuels: energy content as delivered into the fuel tank.<br />
d Average EU-27 electricity mix (2009): 460 g CO2 -eq per kWh or 128 g per MJ, at intake to consumer.<br />
e Excl. energy, i.e. train capital + maintenance + crew + track & station & dispatch charges + train formation +<br />
f<br />
sales and adm.<br />
In percent of the considered part of passenger rail transport. Trams and local rural trains, as well as night hotel<br />
trains (together around 5–7 %) are excluded from consideration in this context.<br />
Comments<br />
There is a large variety of train types throughout Europe, and the reference selection is not<br />
representative for each member state of the EU. Of the selected trains the ‘Intercity or regional’<br />
loco-hauled electric train is expected to have slightly higher energy use and indirect GHG<br />
emissions than the European average, while the selected ‘High-speed train unit’ is expected to<br />
be slightly better in these aspects than the average.<br />
Average energy cost in European electric rail operations is in the order of 10 % of total cost.<br />
Deliverable D4 – <strong>WP3</strong> passenger 5
3 TECHNOLOGY DEVELOPMENT<br />
3.1 General<br />
In this section technologies and operational measures are presented, which offer a technical<br />
potential for reducing energy consumption and (indirect or direct) GHG emissions. Most of<br />
these technologies are listed and described in the ‘Energy efficiency strategies for rolling stock<br />
and train operation’ (UIC, 2010), published continuously by UIC (International Union of<br />
<strong>Rail</strong>ways) as a result of on-going research and development. Some of these technologies and<br />
operational measures are also preliminary results from the EU-funded project <strong>Rail</strong>energy<br />
(<strong>Rail</strong>energy, 2009). Earlier research at KTH (Andersson, 1994), (Lukaszewicz, 2001),<br />
(Lukaszewicz et al, 2009) is also used.<br />
All the above-mentioned technologies are subject to critical evaluations and judgement within<br />
<strong>TOSCA</strong> WP 3. These assessments were complemented with simulations and other estimations<br />
where necessary.<br />
A special case where development outside the railway sector is important, is the prospected<br />
change of the electricity mix in Europe’s energy market. In 2009 the average CO 2 -eq emissions<br />
within the EU-27 electricity generation was about 435 g per kWh of electricity, according to<br />
<strong>TOSCA</strong> WP4 (Perimenis et al, 2010). At the consumer level (taking into account losses in the<br />
electricity transmission) the emissions were 460 gCO 2 -eq per consumed kWh, or 128 g per MJ<br />
of electricity. Very significant reductions in railway GHG emissions can be achieved with a<br />
declining share of fossil fuels and increasing shares of bio fuels and wind power, likely also<br />
solar, geothermal and nuclear power. Another promising technology is the introduction of<br />
carbon capture and storage (CCS) for fossil fuel power plants. Low-carbon electricity is further<br />
discussed as a technology denoted PJ in Section 3.3.<br />
The different technologies and measures (PA – PK presented below) are referred to as technology<br />
trajectories, including the projected approximate year of technology readiness, i.e. when a<br />
technology is ready for commercial sale. In some cases the energy-saving technology is<br />
already partly introduced. The indicated amount of improvement should be interpreted as the<br />
potential for further improvement in comparison with the reference cases of 2009 in Table 2.1.<br />
Before marketing the improved technologies they must be integrated into products, even if the<br />
basic technology is available in 2009. In these cases the improved technology is anticipated to<br />
be ready for commercial sale by about 2015, provided that corporate decisions on product<br />
development are taken by 2011–12. Another 4–5 years are needed for delivery and introduction<br />
in full-scale regular service. In order to be considered as “standard” for newly delivered<br />
systems will finally take some additional 3–5 years.<br />
Summing up this chain means that new systems ready for market introduction (sales) by 2015<br />
can be a standard for modern systems by about 2022–2025. Even then most of the older<br />
technology, say from the reference year 2009, will be used in daily operations, although less<br />
intensively. However, compared with the situation by the reference year an improvement will<br />
take place, because even older technology was used in 2009. The practical lifetime of trains –<br />
i.e. with intensive use – is usually in the order of 25 years, although many trains will survive<br />
for a longer time as operational reserve or used at peak periods.<br />
In some cases commercial introduction is anticipated at a later stage, by 2020 or 2025. A<br />
second estimate is on the very long term (2050) anticipating a continuous or stepwise development.<br />
This is further explained in Section 3.5.<br />
Note that the full implementation of most technologies will usually take some 20-25 years<br />
from the first commercial delivery, due to the long life of railway equipment. In some cases<br />
Deliverable D4 – <strong>WP3</strong> passenger 6
improvements of the rail infrastructure are required, that sometimes take even more time. All<br />
transport modes have long time scales for their introduction, although this time scale is usually<br />
shorter in road transport than for the air, maritime and rail modes.<br />
Commercial introduction on a larger scale may for some technologies require stronger<br />
economic incentives and/or legislation. However, the liberalization and deregulation of the<br />
European rail transport market is expected to force operators to make their operations more<br />
efficient, which in many cases is expected to reduce also the specific energy use and GHG<br />
emissions.<br />
Finally, only technologies and measures that are foreseen today (2010) are included. In the<br />
very long term some new technologies, not known today, may be invented and developed. On<br />
the other hand, some of the technologies described below may for one reason or another not be<br />
developed, or developed to a lower level than anticipated.<br />
3.2 Technology trajectories<br />
The following chart summarizes the technology trajectories for technology domain “rail<br />
passenger transport”. It shows the various technology opportunities independently.<br />
PA. Low-drag train (aerodynamic)<br />
PB. Low-mass train<br />
PC. Energy recovery<br />
PD. Space-efficient train (long-distance)<br />
PE. Modular short train<br />
PF. Eco-driving - driving advice or automatic operation<br />
PG. Dual mode and hybrid (diesel/bio fuel + electric)<br />
PH. Bio fuels in diesel engines<br />
PI. Electrification of non-electrified lines<br />
PJ. Low-GHG electric power<br />
PK. Magnetic levitation<br />
2010 2015 2020 2025 2030 2035 2040<br />
2050<br />
Figure 3-1<br />
Technology readiness for various technologies<br />
Deliverable D4 – <strong>WP3</strong> passenger 7
3.3 Technology descriptions<br />
The potential for reducing energy use or GHG emissions is presented in percent per unit load<br />
(passenger-km), assuming the same average speed, in comparison with the reference system of<br />
2009. Change of speed is taken into consideration in Sections 3.4 and 3.5. In most technology<br />
descriptions below (except FH, FI. FJ) energy savings is the immediate target, but these<br />
savings directly translate into GHG reductions proportionally.<br />
At this stage technologies are mainly described independently of cost effectiveness. In Sections<br />
4 and 5 economic, social and user considerations are also taken into account.<br />
PA. Low-drag train<br />
Technologies are basically available for reducing air drag by 15–30 %, compared with the<br />
reference trains in Table 2-1. Some of them will need further maturity and acceptance (UIC,<br />
2010) (Diedrichs, 2010). Low air drag is most important for high-speed long-distance trains,<br />
but has a significant impact also on fast regional trains and local trains as the two latter trains<br />
have today usually a modest aerodynamic performance. The low-drag train is estimated to have<br />
a long-term energy-savings potential of around 15 % – with an intermediate step at about 10 %<br />
– compared with the reference ‘High-speed’ as well as for the ‘Intercity and regional’ segment.<br />
PB. Low-mass train<br />
Lower mass will reduce energy consumption and related GHG emissions per pkm, in particular<br />
on stopping trains (local trains and metros), although re-generation of braking energy in<br />
electric operations to some extent will reduce the positive impact of low mass. Technologies<br />
are today not available for a major reduction of train mass (around 20 %), but may become<br />
available as a result of massive R&D. New materials and/or designs are needed and likely also<br />
economic incentives. The potential of energy savings is estimated to 10 % in local or metro<br />
trains - ‘City trains’- less in other train types, all compared with reference trains in Table 2-1.<br />
PC. Energy recovery<br />
Today’s modern electric passenger trains use the (electric) motors as generators when braking,<br />
thus feeding back electric energy to other trains on the line, or (sometimes) to the public<br />
electric grid. Alternatively, electric energy can be stored onboard in batteries or supercapacitors,<br />
for storage of braking energy until the next acceleration; the latter is of special<br />
interest for non-electric trains (diesel fuel and similar) with no external electric connection. All<br />
this is called energy recovery or regeneration. Energy recovery braking will also reduce the<br />
maintenance of the mechanical brakes.<br />
This technology is partly introduced already today. The feed-back ability is however usually<br />
smaller than optimum due to the limited power (in kW) of the propulsion equipment of the<br />
train and/or by the limited number of powered axles, as well as of the limited recovery capacity<br />
of the electric supply chain. With the rapid development of electric power equipment it is<br />
increasingly technically and economically feasible to install more power in trains and in the<br />
supply network, and also to improve possibilities of feeding electricity back to the general grid.<br />
Energy recovery has been subject to extensive simulations in this study and is estimated to be<br />
able to save energy use and related GHG emissions by up to 20 % over the long-term, in<br />
relation to today’s ‘Local city trains’. This potential is smaller in high-speed operations with<br />
only few stops, although also downhill gradients contribute to energy recovery. In some cases<br />
the electric supply system must be modified or rebuilt. A continuous improvement of<br />
regeneration and energy recovery is anticipated over the years.<br />
Energy recovery interacts with other technologies, such as ‘Eco driving’, ‘Low drag’ and ‘Low<br />
mass’. To fully understand and evaluate the impact of Energy recovery combination scenarios<br />
are needed; see further Section 3.5.<br />
Deliverable D4 – <strong>WP3</strong> passenger 8
PD. Space-efficient train<br />
According to (RSSB, 2007) and author’s estimations European long-distance high-speed trains<br />
have an average of about 2.2 seats per metre of train length, while most Japanese high-speed<br />
long-distance trains (Shinkansen) have an average of 3.3. About half of this effect is due to the<br />
use of wide carbodies in Japan but also due to less space for catering facilities and a more<br />
space-efficient interior layout in general. In Europe double-decker trains are used to a certain<br />
extent to improve space utilization, while wide-bodied trains (exterior width > 3.2 m) are only<br />
possible on a small number of rail networks, because of space restrictions by the rail<br />
infrastructure. Double-decker trains currently accommodate 2.5–2.7 seats per metre of train in<br />
the high-speed versions; sometimes more on regional trains. With a consequent use of spaceefficient<br />
train interiors - including intelligent seat design - some 10–15 % of energy and GHG<br />
emissions (per seat-km) could be saved (Kottenhoff et al, 2009) compared with reference<br />
trains. Note however, that the reference high-speed train in Table 2-1 is a double-decker which<br />
already has a comparatively high amount of seats per unit length of train. In local ‘City trains’,<br />
and many regional trains, there is already a high degree of space utilization, including<br />
sometimes also standing passengers, so in these cases no further improvement is anticipated.<br />
A particular mean of improved space utilization is the exchange of locomotive-hauled trains<br />
for so-called multiple unit trains (EMU=Electrical, DMU=diesel), having their propulsion<br />
equipment installed in the passenger cars. Usually train performance can also be enhanced<br />
(acceleration, speed, regenerative braking, etc) and the train mass per seat can be reduced.<br />
PE. Modular short train<br />
Today many trains have a length of 5–16 cars (or equivalent if shorter carbodies than normal)<br />
due to the required capacity during peak hours. A large proportion of these trains is running in<br />
the same formation all the time, without shortening the train length during off-peak hours. This<br />
is due either to the fixed long train configuration, which does not allow any decoupling (in selfpropelled<br />
multiple units), or to the cost and time needed for decoupling cars in a loco-hauled<br />
train. If trains are made in shorter self-propelled modules (3–6 cars) these modules can quite<br />
easily be de-coupled, and the train length is halved when the full size is not needed. A halfsize-train<br />
would save some 40 % of energy compared with a full-size one. To some extent<br />
these principles are already applied in today’s operations, but they could be extended to further<br />
areas. With an assumed 20 % (more than today) of the trains running at half-size some 6–8 %<br />
of energy should be saved. However, it is at this stage uncertain to what extent these principles<br />
can be effectively used within Europe. In some EU member states safety regulations presently<br />
require some 5–10 m of empty (i.e. no passenger) space at each end of the train, which would<br />
neutralize the benefits of shorter trains.<br />
PF. Eco-driving - driving advice or automatic operation<br />
Optimization of driving style means, for example, coasting before braking and downhill<br />
approach, use of regenerative brakes as the ordinary brake, running slowly when time allows,<br />
etc. Such optimization is estimated to have a saving potential in the order of 10–15 % in its<br />
first generation, compared with the average manual driving of 2009 which is the reference in<br />
Table 2-1 (<strong>Rail</strong>energy, 2009) (Lindemann, 2010) (Luijt, 2010).<br />
Driving can be optimized by training for skilled driving, by on-line computerized support and<br />
advice to drivers or by automatic train operation. The latter may be used on metros and<br />
dedicated commuter railways. To a small extent this technology is already commercially<br />
introduced, but is estimated to be improved and fully implemented in modern trains within the<br />
next 10 years. These improvements are relatively inexpensive to introduce and are applicable<br />
to most types of trains.<br />
Deliverable D4 – <strong>WP3</strong> passenger 9
At a later stage (say by 2025 and beyond) this technology may be co-ordinated with rail traffic<br />
control, i.e. traffic flow management, which would lead to further improvement. Such measures<br />
would also enhance railway’s transport capacity to some extent. In the long term (2050) ecodriving<br />
is estimated to save a further 5–10 % compared over the first generation, used as a<br />
single technology. However, there are interactions with other technologies; see further<br />
combination scenarios in Section 3.5.<br />
PG. Dual mode and hybrid trains<br />
In a dual mode train electricity is used on electrified sections while diesel or bio fuels are used<br />
on non-electrified parts of the operation. Today most trains running on both electrified and<br />
non-electrified sections use diesel power only. Depending on the share of electrified sections in<br />
the actual operation, and carbon content of electricity, energy savings and emission reductions<br />
can be in the order of 20–50 % and sometimes more, compared with pure diesel operation.<br />
Another possibility is hybrid diesel-electric propulsion with on-board energy storage. These<br />
technologies are available today, but are sparsely used. It is expected to be further matured and<br />
accepted during the next 10 years. Maximum market penetration is limited to diesel-hauled rail<br />
services, i.e. around 10–12 %. Further incentives are likely necessary for a wider introduction.<br />
PH. Bio fuels in diesel engines<br />
As an alternative to diesel fuel, diesel engines can be powered with liquid or gaseous bio fuels,<br />
which can reduce life-cycle GHG emissions. WP4 of <strong>TOSCA</strong> (Perimenis et al, 2010), suggests<br />
Hydrogenated Vegetable Oil (HVO) as the most promising alternative available today. The net<br />
life-cycle content of CO2-eq is about 45 % lower than for ordinary diesel fuel, while<br />
production cost for HVO is about 50 % higher. In the longer term a new generation of bio<br />
fuels, produced from wood, is anticipated to be available.<br />
Most important, the future availability of biomass for energy purposes depends on the amount<br />
of land that is not needed for food production (non-food areas) and other purposes. This is a<br />
very uncertain issue. Therefore, the biomass potential is also highly uncertain and requires<br />
much further analysis. This is out of scope in this study on rail passenger transport.<br />
Due to the limited market penetration in rail operations (an absolute maximum of 12 %, i.e. the<br />
share of diesel operations) and, in particular, the high uncertainties in future large-scale<br />
availability, this option will not be further analysed in this report. The bio fuel option will be<br />
further evaluated by WP6 in Stage 2 of <strong>TOSCA</strong>, as a scenario variable.<br />
PI. Electrification of non-electrified lines<br />
Electric rail operations are usually more energy efficient than less GHG-intensive than diesel<br />
operations, in particular if electricity is partly generated by other means than fossil fuels. This<br />
is shown in Table 2-1, where the electric ‘Intercity or regional’ train has lower GHG emissions<br />
per passenger-km than the diesel train, despite higher speed and higher train mass per seat.<br />
Today, several European countries have very limited part of their rail networks electrified.<br />
Plans for improvements have been presented, for example in the UK. In these countries<br />
substantial reductions of GHG emissions from rail operations are expected, in particular if<br />
‘Low-GHG electric power’ is used in the future (see further FJ below). Massive electrification<br />
to cover, say, 95 % of all European rail passenger transport volumes (instead of the present-day<br />
88 %) would reduce GHG emissions by 3–8 % depending on the electricity mix.<br />
The limited general impact – because of the low additional market penetration – and the<br />
associated cost of electrification is a matter of optimization (i.e. what lines should be converted<br />
to electric operation). This is however outside the scope of this study. Therefore no further<br />
analysis of electrification is made here. This does not exclude that certain lines could and<br />
should be electrified after a thorough analysis.<br />
Deliverable D4 – <strong>WP3</strong> passenger 10
PJ. Low-GHG electric power<br />
Electric power is by 2009 produced by a number of means in Europe, some of them using<br />
fossil fuels (mainly coal and natural gas), some of them with renewable energy (hydro, with<br />
increasing shares of wind and biomass). Nuclear power is also an essential source of nonrenewable<br />
energy, but with zero direct GHG emissions. Fossil fuels had by 2007 about 50 %<br />
share of the total. The electric power production is part of the European Trading Scheme<br />
(ETS), which means that GHG emissions will have a monetary price. Tomorrow’s electric<br />
power mix must have substantially diminishing dependence of fossil fuels if GHG emission<br />
targets are to be met. Further, long-term technology options include carbon capture and storage<br />
(CCS) as well as geothermal energy, and possibly also solar and sea wave power. Also, an<br />
increasing share of combined heat and electric power (CHP) production (with fossil or bio<br />
fuels) increases the efficiency and reduces specific emissions related to electric power.<br />
The GHG emissions from today’s electric power mix are estimated in <strong>TOSCA</strong> WP4 as being<br />
460 gCO 2 -eq per kWh of electricity at consumer's outlet. GHG emissions from future<br />
European electric power is a scenario variable in stage 2 and will be determined by WP6 in cooperation<br />
with other work packages.<br />
Substantially reduced average GHG emissions from electric power production will be a very<br />
effective means of reducing emissions from the European transport sector, not only for<br />
railways but possibly also for passenger cars in the road sector. For example, a reduction of<br />
GHG content per kWh of electricity by 80 % will reduce specific emissions of electric trains<br />
by the same amount. Maximum market penetration in the rail sector is about 90 % (i.e. current<br />
and future diesel operation is excluded).<br />
PK. Magnetic levitation (Maglev)<br />
Magnetic levitation has been technically developed for commercial introduction since about<br />
2000, both in Germany and Japan. However, only one commercial magnetic railway for higher<br />
speeds has been built, i.e. the Shanghai airport Maglev system. In addition, a long-distance line<br />
of 200 km is reported to be planned outside Shanghai. Magnetic levitation trains achieve<br />
commercial top speeds in the range of 400 to 500 km/h; the horizontal curves may be tighter<br />
and the gradients steeper than on conventional railways for the same design speed. Despite<br />
these advantages, the cost of constructing magnetic railways is high, partly due to the<br />
installation of continuous high-powered linear drives and levitation equipment along the line.<br />
Another drawback is the non-existing interoperability with conventional railway systems. In<br />
addition, the difference in average speed between Maglev and conventional high-speed rail<br />
has been successively reduced in comparison with the situation 40 years ago, when the<br />
development of magnetic levitation started.<br />
Energy consumption is estimated to be in the same order as on conventional high-speed stateof-the-art<br />
trains at the same speed (Kemp et al, 2007). Other sources end up with almost the<br />
same conclusion, or somewhat higher energy consumption for magnetic rail, all comparing the<br />
same speed. However, if the full speed potential of magnetic levitation is to be achieved the<br />
total energy demand will increase. This is in spite of the fact that the above-mentioned<br />
technology options PA, PB, and PD (see above) are already included in existing proposals for<br />
magnetic levitation systems.<br />
The option of Maglev trains will not be further studied in the context of Tosca, as this option is<br />
not suited for reduction of energy consumption and GHG emissions.<br />
Deliverable D4 – <strong>WP3</strong> passenger 11
3.4 Incremental improvements and higher speed<br />
General trends<br />
Despite slightly higher average speeds and a modest priority for energy-saving measures in the<br />
rail sector until recently, specific energy consumption has declined. For example, in the period<br />
1990–2007 the Deutsche Bahn reduced its specific primary energy use by about 20 % in<br />
passenger transport and about 35 % in freight (UIC, 2008), while Swedish railways reduced its<br />
specific final electric and diesel energy use by about 11 % on average (SIKA, 2008). The<br />
German case means an average saving of about 2 % per year, including efficiency improvements<br />
both in electric power generation and in train efficiency, as well as higher load factors.<br />
The Swedish case relates to train and feeding systems efficiency only and is about 0.7 % per<br />
year. At least half of these improvements are estimated to be due to larger steps in new<br />
passenger train technology, while the rest is due to continuous incremental improvements.<br />
In the future increased attention is expected to be paid on energy and emission issues.<br />
Therefore, the general historical trend of incremental improvement is supposed to continue at<br />
least at the same rate as in the Swedish case, i.e. by about 0.3 % per year in relation to the total<br />
rail energy consumption, excluding increased efficiency due to larger steps and improvements.<br />
Incremental improvements – in particular reduced energy losses<br />
Incremental improvements – besides the larger measures PA–PI in the railway system as<br />
described above – are possible. Examples include: comfort energy reduction, traction and<br />
auxiliary systems with reduced losses as well as reduced losses in the railway’s electric supply<br />
systems. Until 2050 it is anticipated that a saving of 12 % will be reached compared with the<br />
2009 reference, considered here as a single measure. This is equivalent to 30 % reduction of<br />
the losses in electric rail operations, as losses, auxiliaries and comfort constitute about 40 % of<br />
total energy consumption as an average. It is estimated that an energy saving of around 7 %<br />
(out of 12) would be in reach for new trains until 2025 (UIC, 2010) (<strong>Rail</strong>energy, 2009), with<br />
another 5 % assumed until 2050. Reduction in comfort energy can be facilitated by recovery of<br />
heat, better controlled ventilation, heat pumps etc. Also losses in electric power equipment (on<br />
trains and in supply systems) are assumed to be reduced, for example by introduction of<br />
permanent magnet motors and more efficient converters. Similar improvements (totally 12 %<br />
until 2050) are expected in diesel railway operations as well, due to improved efficiency in<br />
diesel engines and in energy use for comfort and auxiliaries.<br />
Rapid improvements are constrained by the long life of railway equipment (vehicles and fixed<br />
installations). In the long term (say more than 15–20 years) the potential is higher if<br />
progressive decisions are taken within the next 5–10 years. Many of these measures will be<br />
motivated also for economic reasons.<br />
Higher speed<br />
There is a strong tendency to reduce travel time for several reasons, in particular increased<br />
attractiveness against other modes but also improved productivity for trains and train crew.<br />
These positive factors contribute to a modal shift to rail. In many cases (although not all)<br />
reduced travel time will imply increased top speed, which, in turn, will imply increased energy<br />
use with all other conditions equal. However, train technology is usually adapted to speed.<br />
For the ‘Intercity or regional’ (electric) segment top speeds are estimated to increase (on<br />
average) by 0.9 % per year, i.e. by 15 % until 2025 and by about 40-45 % until 2050. This<br />
follows a general trend in top speeds for the last 150 years and there is no tendency or reason<br />
that this continuing development should decline for the intercity or regional segment. This<br />
segment is heterogeneous with top speed ranging from 100–120 km/h up to 220–240 km/h in<br />
2009. The typical top speed is however quite low – about 160 km/h. For 2050 typical top<br />
Deliverable D4 – <strong>WP3</strong> passenger 12
speeds in the range of 220–250 km/h are expected. This may an underestimation, as some<br />
networks already today partly run this class of trains at top speeds in the range 200–230 km/h<br />
(Germany, France, Spain, Sweden, UK, etc).<br />
For ‘High-speed trains’ the commercial top speed in Europe (2009) is 320 km/h, while a more<br />
common operating top speed is 300 km/h that is also defined as the reference case in Table 2-1.<br />
In China trains for 380 km/h are already on order, although it is uncertain when and to what<br />
extent such speeds will be utilized commercially in the near future. European high-speed trains<br />
are assumed to have a typical top speed around 370 km/h in 2050, corresponding to an average<br />
annual increase of 0.5 % per year. Thus, the historical trend of about 0.9 % long-term annual<br />
speed increase is assumed to be broken. This is due to assumed difficulties to abate noise<br />
emissions as well as increased cost for infrastructure investment and maintenance.<br />
In local train services however, with shorter stopping distances, the top speed will increase at a<br />
slower rate, estimated to be 0.3–0.4 % per year. In diesel operations the average speed is<br />
assumed not to increase at all, as the more competitive routes are assumed to be electrified,<br />
although exceptions may occur.<br />
It should be pointed out that the average speed, including stops and other delays, will usually<br />
increase at a lower rate than the top speed. This will be shown in Table 5-2 of Section 5.2.<br />
Load factor - seat occupancy<br />
Many railway operations have a comparatively low average seat occupancy rate or load factor<br />
(30–50 %) if compared for example with airlines. High-speed trains however, usually have an<br />
average load factor of 60–75 %, which is more comparable with domestic airlines. Too many<br />
empty seats are, of course, not desirable neither from an economic nor from a specific energy<br />
point of view. With deregulation, increasing competition and more business-oriented railway<br />
companies the load factor would improve, by flexible fares and by other means. This is to a<br />
large extent what has happened to the airlines in Europe and North America after deregulation.<br />
Increased load factor is not a “technology”, its future potential is hard to quantify with<br />
precision and is therefore not considered in the following analysis. This factor could be an<br />
option of additional improvement in energy and GHG emissions per passenger-km.<br />
3.5 Technology scenarios to be further considered and investigated<br />
Some of the technologies described in Section 3.3 are very promising for the future, as they<br />
offer large energy and GHG savings in at least some types of services and also experience high<br />
possible market penetration, i.e. in several types of rail services with considerable total market<br />
share. These promising technologies constitute five scenarios (1–5) to be further considered<br />
and investigated in this study.<br />
1 PA. Low-drag<br />
2 PB. Low-mass<br />
3 PC. Energy recovery<br />
4 PD. Space efficiency<br />
5 PF. Eco-driving<br />
The following combined scenarios are also studied:<br />
6 Pcomb electric: PA + PB + PC + PD + PF + Incremental<br />
7 Pcomb HS electric: As (6) + Higher Speed<br />
8 Pcomb as (7) + low GHG electric power<br />
9 Pcomb diesel: PA + PB + PC + PD + PF + Incremental<br />
Deliverable D4 – <strong>WP3</strong> passenger 13
Note that technology ‘Modular short train’ (PE) or ‘Electrification of non-electrified lines’ (PI)<br />
is not explicitly part of the scenarios, since it is not possible within the scope of this study to<br />
estimate their future feasibility and implementation. PE and PI are therefore also nonquantified<br />
options for additional improvement.<br />
Note also that ‘Bio fuels’ (PH) is not either part of the scenarios at this stage, because the<br />
potential of this option is dependent on uncertain variables being assessed in Stage 2 of<br />
<strong>TOSCA</strong>. The same is e.g. the case for ‘Low-GHG electric power’ (PJ) but a tentative<br />
improvement is anyhow studied in Scenario 8 above, just to understand the possible impact of<br />
low-GHG electric power.<br />
Scenarios 1 to 5 with single measures are comparatively easy to estimate. The combined scenarios<br />
are, however, much more complicated since there are considerable interactions and<br />
dependences between the different measures, if combined. In this context a thorough and<br />
validated simulation software (STEC) is used, taking all factors into consideration in the same<br />
run. In the simulations with STEC the full estimated potential of improvement until year 2050<br />
is used.<br />
As it is very hard to find qualified estimates on rail technology for 2050, the total time 2009-<br />
2050 is divided in two periods. Due to the current lack of future estimates for the railway<br />
sector, the following procedure is being applied:<br />
Period 1 The techno-economic potential for in-service introduction during the next 10–15<br />
years (i.e. until 2025) is estimated according to the earlier mentioned sources.<br />
Period 2<br />
Development is assumed to continue after 2025. For most technologies it is<br />
assumed that 2/3 of the first period achievement can be achieved in the second<br />
period, i.e. 2025–2050, provided there are no obvious physical or economic<br />
obstacles. The exception is technology PB (Low-mass train) that requires more<br />
substantial research before technology readiness (see Table 3-1), which will<br />
delay most to its possible introduction to Period 2.<br />
This means that, for most technologies, 60 % of the total achievement until 2050 is what today<br />
is known or assumed as appropriate technologies, possible to introduce in regular service<br />
during the Period 1, while 40 % is assumed to be achieved during Period 2. As the latter period<br />
is longer than the first one, the annual rate of improvement is assumed to be slower in the<br />
second period. This assumption is justified as the first steps are considered as technically and<br />
economically quite well-founded, while the following steps would likely require more<br />
advanced technologies, also being closer to the physical and economic limits.<br />
If – for example - the total combined improvement is 50 % reduction of specific energy in the<br />
total period (41 years), then the energy will be reduced by 30 % under the first period and by a<br />
further 20 % (of the original amount) in the second of 25 years. This ends up with 2.2 %<br />
average reduction per year until 2025 and 1.4 % reduction per year during 2025–2050. With<br />
the same percentage annual rate the assumed 50 % reduction until 2050 is equivalent to an<br />
annual reduction by 1.7 % per year.<br />
Table 3-1 presents examples of changes for improvement in the first period (until 2025). These<br />
changes have been judged as possible with reference to (mainly) UIC Energy efficiency<br />
strategies for rolling stock and train operation as well as (<strong>Rail</strong>energy, 2009) and (Diedrichs,<br />
2010), i.e. essentially the same as in Section 3.3. They are included in the earlier mentioned 9<br />
scenarios and are investigated both as individual technologeis and in combination. Results are<br />
presented in Section 5.<br />
Deliverable D4 – <strong>WP3</strong> passenger 14
It should be noted that it is not for sure that all these changes in technology will really be<br />
implemented: At this stage they will only be studied in the context of their potential of<br />
reducing energy use and GHG emissions.<br />
Table 3-1<br />
Examples of changes until 2025, in relation to reference trains.<br />
High-speed Intercity Local city<br />
or regional<br />
Aerodynamic drag - 16 % - 21 % a<br />
Seats per metre of train + 9 % +22 % a + 0 %<br />
Train mass per metre of train - 0 % - 4 % b - 7 % b<br />
Per cent of energy recovery at braking c 75 % to 84 % (2050) 44 % to 72 % (2050)<br />
Energy loss in power systems, per car e - 18 % - 18 %<br />
Energy use for auxiliary and comfort e - 18 % - 18 %<br />
Eco-driving<br />
Speed profile smoothing and coasting before<br />
braking, within a time margin of 3 % d<br />
Increase in top speed 15 % 26 % 12 %<br />
__________________________________________<br />
a Including transition from locomotive-hauled electric trains to multiple units.<br />
b 1/3 of total reduction of tare train mass (until 2050) is estimated to be introduced as state-of-the-art on new trains<br />
until 2025, while 2/3 is introduced in the period 2025–2050.<br />
c In relation to the theoretically possible amount after energy losses, air resistance and rolling resistance, braking<br />
only with electric regenerative brakes. Note that it is assumed that also the reference “state of the art” case have a<br />
substantial average amount of energy recovery in electric rail services, which is not the case in all recent rail<br />
operations. The average real improvement in relation to the present situation for new trains could therefore in<br />
some cases be larger.<br />
d<br />
Driving style is adjusted until 3 % of time-tabled time is used. Usually the total time margin is in the order of 10<br />
%. The use of 3 % of time-tabled time for Eco-driving is an average, sometimes it can be done, sometimes not and<br />
sometimes more, depending on the actual time-keeping situation for the actual train.<br />
e As an example, energy efficiency in the train is originally 82 %, i.e. losses are 18 %. With 18 % reduction of<br />
losses (until 2025) the resulting energy efficiency increases to 85.2 %. In similar way energy efficiency of the<br />
railway’s supply system is increased from 91 % to 92.6 % until 2025. In the very long term (until 2050) energy<br />
losses are assumed to be reduced by 30 %.<br />
Deliverable D4 – <strong>WP3</strong> passenger 15
4 CONSTRAINTS FOR REDUCING GHG EMISSIONS<br />
Most of the proposed technologies are essentially neutral in the public and end user opinions.<br />
The end users or rail operators are not expected to show any opposition or resistance to trainbased<br />
technologies such as lower mass, energy recovery, eco-driving, modular trains or<br />
multiple units instead of conventional locomotives and cars, and not even hybrid or dual-mode<br />
trains. On the contrary, most end users and operators will likely react positively to a more<br />
pronounced aerodynamic design, newly designed multiple unit trains and advanced<br />
technologies in general. Higher speeds and reduced travel time is a very positive factor and<br />
will strengthen the competitiveness of rail systems. All this together would most likely strengthen<br />
the rail business opportunities through a more positive public image.<br />
In many cases the new technologies will also lead to per-unit cost reductions, through lower<br />
energy bills or higher capacity for the same length of train. This is also a strongly positive<br />
factor. Also the strengthened environmental image around trains and rail services is positive,<br />
provided that external noise and vibrations remain within acceptable limits.<br />
There are not even any obvious obstacles for the scalability of proposed technologies, either<br />
regarding natural or human resources or regarding social equity. The main restriction will be<br />
rail infrastructure capacity and financial resources for infrastructure investment. Regarding<br />
infrastructure capacity a lot of improvements are needed to generate a major increase of<br />
transport capacity, i.e. new high-speed lines and rail freight corridors, double tracking of<br />
single-track lines, improved signalling systems etc. A larger loading gauge (wider and/or<br />
higher cross section of trains) is also highly beneficial. Loading gauge is most restrictive in the<br />
UK, but also continental Europe is restricted compared with most other parts of the world. This<br />
is due to different obstacles as platforms, tunnels, bridges and others.<br />
Regarding aerodynamic design we should point out a possible resistance against covers of<br />
bogies, end couplers etc that might be troublesome and time-consuming in operation and<br />
maintenance, if not designed and handled in the right way. On the other hand, sometimes<br />
covers are beneficial to protect sensitive equipment from snow, dust etc. Also, very long nose<br />
and tails of a train, as may be required for superior aerodynamics at very high speed, will<br />
reduce space for paying passengers, in particular for short trains (6 cars and below). Thus long<br />
nose or tail would to some extent hamper the economic and efficient use of the train.<br />
It is not even for sure that mass reduction is always profitable from a pure economic point of<br />
view, if more advanced materials and manufacturing processes must be used. There is also a<br />
risk of safety implications and a more modest comfort regarding noise, vibrations and others. A<br />
substantial amount of research and development is required. The positive effects are highest for<br />
stopping trains with much acceleration and stops (suburban and metro trains).<br />
There are mainly two issues identified that could be troublesome in the customer and public<br />
opinions. The first one is the issue of improved space utilization. If the space for each<br />
passenger is felt to be reduced to an extent that is hampering the feeling of privacy or comfort<br />
or ability to eat, read, use lap-tops or carry luggage, it will certainly be negative. Done in the<br />
right way it must not be negative however. There are, for example, possibilities of smart spacesaving<br />
chairs (Kottenhoff et al, 2009) and of more rational and space-efficient food services<br />
than today, while still maintaining good comfort. However, there is some risk that improvement<br />
is not made in a proper way so that passenger acceptance will really be reduced, or that<br />
decision makers feel that this is the case. However, space utilization can also be improved by<br />
using multiple unit trains instead of a locomotive plus cars, or double deckers, which is usually<br />
not felt as negative.<br />
Deliverable D4 – <strong>WP3</strong> passenger 16
The second issue that may be troublesome is the provision of low-GHG electricity. One way is<br />
to use nuclear power, for which a strong opposition is active on some occasions. Something<br />
similar could possibly also be the case for carbon capture and storage (CCS), if the public<br />
opinion feels that this storage is not sustainable and absolutely safe. However, on the positive<br />
side of these opinions are the prospects of “greener” generation of electricity and heat.<br />
Anyhow, if EU targets on GHG reduction are to be met, a dramatic change must take place in<br />
electric power generation.<br />
In addition, there is an identified risk that many train operators and leasing companies will be<br />
conservative and hesitate to introduce new technologies that will result in additional<br />
investment and technical risks. There is sometimes a feeling that railways and rail operations<br />
are already superior in energy performance compared with other transport modes, so that no<br />
substantial efforts are needed.<br />
Another limiting factor is the increased tendency to prioritize the first cost (investment cost of<br />
new trains) and pay less attention to the long-term life cycle cost and to the income side of the<br />
account. In theory, at 6 % interest rate and 25 years amortization, the annual cost (annuity) for<br />
energy-saving investment is 7.8 % of the additional investment, equivalent to a required payoff<br />
time of maximum 13 years. In reality however the pay-off time should rather be 3–8 years,<br />
because vehicle investors expect to have a substantial benefit before they are willing to take the<br />
risk of investing in new technology at a higher first cost. This tendency is negative for any<br />
useful energy-saving measure that increases train’s sales price and investment cost.<br />
For the above reasons some evident economic incentives - or legislation - within the EU,<br />
would be useful to help bring railways onto a still more ambitious environmental path. It<br />
should be pointed out that economic incentives not necessarily call for subsidies; also taxes can<br />
be used for environmentally less friendly products. If EU and national governments want to<br />
reduce GHG emissions they have to support the change. Support for R&D is also required.<br />
Another support for introducing energy-saving measures, with extra initial cost, is to support<br />
and introduce a standard mandatory declaration and certification of energy consumption<br />
performance. Such standardization will contribute to the consideration and confidence in<br />
energy-saving features in the procurement process of new trains and in the adoption of new<br />
operational practices.<br />
Deliverable D4 – <strong>WP3</strong> passenger 17
5 RESULTS<br />
5.1 Technology readiness and R&D requirements<br />
In this section the time of technology readiness, i.e. the technically possible first market<br />
introduction (sales) is estimated, if corporate decisions are taken in the next 2 years. Also the<br />
needed amount and depth of research and development (R&D) is estimated.<br />
In many cases the basic technology for the first step already exists in the reference year 2009.<br />
However, before marketing the improved technologies they must be integrated into products.<br />
In some cases, also the rail infrastructure must be further developed for European conditions<br />
and requirements, although the basic technology already exists. These considerations postpone<br />
market introduction.<br />
In some cases in Table 5-1 below, both company-level and EU-wide research programs are<br />
needed, although not indicated in the table. This means that different parts of technology<br />
development require different levels of R&D.<br />
Table 5-1 Technology readiness and R&D requirements<br />
Technology readiness<br />
Most<br />
likely<br />
LB<br />
UB<br />
R&D requirements (rel. to marketreadiness)<br />
Insignificant<br />
Significant<br />
(companylevel)<br />
PA Low drag 2018 2015 2022 X<br />
Substantial<br />
(EU-wide<br />
program)<br />
PB Low mass 2020 2017 2025 X<br />
PC Energy recovery 2015 2012 2020 X<br />
PD Space-efficiency 2015 2012 2020 X<br />
PE Modular short 2015 2012 2020 X<br />
PF Eco-driving 2015 2011 2018 X<br />
PG Dual mode 2009 2009 2009 X<br />
PH Bio fuels 2009 2009 2009 X<br />
PI Electrification 2009 2009 2009 X<br />
PJ Low-GHG electric a 2025 2020 2030 X<br />
PK Magnetic levitation b 2025 2020 never X<br />
a Estimated year of large-scale market introduction, taking technological maturity and necessary permissions into<br />
consideration. In particular CCS (Carbon Capture and Storage), but also other technologies, are anticipated.<br />
b Estimated year of maturity and adaption for European conditions, however, excluding economical and financial<br />
considerations.<br />
Deliverable D4 – <strong>WP3</strong> passenger 18
5.2 Energy and GHG characteristics<br />
With the approach and assumptions outlined in Sections 3.1–3.5, supported by KTH simulation<br />
with STEC, the potential of individual technologies, as well as their combined impact, are<br />
evaluated. Results are presented in detail in Tables 5-2 to 5-4 and more briefly in Figures 5-1<br />
to 5-3. Detailed results are presented in Table 5-2. In scenarios 1 to 5 individual technologies<br />
are studied separately, while scenarios 6 to 9 represent their combined effect.<br />
Table 5-2 Energy use per passenger-km, as estimated for the different types of rail<br />
passenger services by 2050, measured as electricity at public grid or at the train’s<br />
fuel tank. NB: 1 MJ = 0.278 kWh.<br />
Bold figures are the main results to be compared.<br />
High-speed<br />
train unit<br />
Electric<br />
(MJ/pkm)<br />
Intercity or<br />
regional<br />
Electric<br />
(MJ/pkm)<br />
Intercity<br />
or regional<br />
Diesel<br />
(MJ/pkm)<br />
Local<br />
city train<br />
Electric<br />
(MJ/pkm)<br />
Technologies and scenarios<br />
Reference 2009 (Table 2-1) at train 0.22 0.33 0.73 0.35<br />
at public grid 0.243 0.359 -- 0.382<br />
1. PA Low-drag at public grid / tank 0.203 0.314 0.65 0.370<br />
2. PB Low-mass a “ --- 0.337 0.68 0.346<br />
3. PC Energy recovery “ 0.236 0.317 0.64 0.305<br />
4. PD Space efficiency c “ 0.213 0.275 0.62 ---<br />
5. PF Eco-driving “ 0.220 0.312 0.63 0.305<br />
6. Pcomb electric (incl. incremental) 0.126 0.162 --- 0.149<br />
7. Pcomb HS el: As (6) + higher speed 0.165 0.193 --- 0.175<br />
8. Pcomb HS (7) + low GHG el power b 0.165 0.193 --- 0.175<br />
9. Pcomb diesel (incl. incremental) --- --- 0.36 ---<br />
Max operational speed 2009→2050 (km/h) 300 → 370 160 → 230 140 140 → 165<br />
Average speed 2009→2050 (km/h) 200 → 240 105 → 123 85 55 → 60<br />
Average load factor (%) 65 40 40 35<br />
European rail market share (% of pass-km) d 20 43 12 25<br />
a ‘High-speed train’ mass per metre is assumed constant, however, the number of seats per metre is assumed to<br />
increase by 14 % to 2.9 seats per metre of train over the time until 2050. ‘Intercity or regional’ electric trains are<br />
assumed to change from locomotive-hauled conventional trains to lighter multiple units (with a further mass<br />
reduction per metre of 10 %), thus reducing the overall mass per seat by 25 %. The reference diesel train is<br />
already a multiple unit; here a mass reduction of 15 % is assumed. For the ‘Local city train’ mass per metre, and<br />
per seat, is assumed to be reduced by 20 % from 2009 until 2050.<br />
b The GHG content of average European electricity is tentatively assumed to be reduced by 80 % until 2050.<br />
c<br />
‘Intercity or regional’ and ‘High-speed’ are assumed to have 2.9 seats per metre of train by 2050. ‘Local city<br />
trains’ are assumed to have the same as in the reference case: 3.5 seats per metre train.<br />
d At this stage assuming the same market share as in the reference year 2009; see further discussion on page 20.<br />
Deliverable D4 – <strong>WP3</strong> passenger 19
Figure 5-1 summarizes estimated trends of energy use over time as per cent of the reference<br />
year, for different types of rail services, with all technologies aggregated in combination. For<br />
electric trains higher speeds are included; for diesel trains speeds are assumed to be constant<br />
over time.<br />
2050 2025 2009 reference<br />
High speed<br />
67.9%<br />
80.7%<br />
100.0%<br />
Intercity &<br />
Regional electric<br />
53.8%<br />
72.3%<br />
100.0%<br />
Intercity &<br />
Regional diesel<br />
49.3%<br />
69.6%<br />
100.0%<br />
Local city<br />
45.8%<br />
67.5%<br />
100.0%<br />
Figure 5-1<br />
Trends in specific energy use (per passenger-km) over time for different types<br />
of rail passenger services (new trains).<br />
All technologies and influence of higher speeds are aggregated.<br />
All types of rail passenger transport – from ‘High-speed trains’ to ‘Local city trains’ - are<br />
competing with road transport, i.e. cars and buses. Air transport (in the range 300 - 1000 km) is<br />
mainly competing with ‘High-speed trains’ and to some extent with fast intercity trains (i.e.<br />
part of the ‘Intercity or regional’ segment). To compare with road and air transport respectively<br />
energy and GHG characteristics for the rail mode is therefore divided in two tables, where<br />
- Table 5-3a summarizes energy use and the resulting GHG emissions aggregated and<br />
weighted over intercity, regional and city rail services, for comparison mainly with<br />
road transport. For diesel trains only the results of combinations are presented;<br />
- Table 5-3b summarizes energy use and the resulting GHG emissions for high-speed<br />
rail, for comparison also with air transport.<br />
Estimated lower (LB) and upper (UB) bounds are also indicated.<br />
Inter-rail mode shift (i.e. between different types of rail services) is not considered in the<br />
aggregated estimations in Figure 5-1, i.e. the percentage share in passenger-km is as for the<br />
reference trains according to Table 2-1. In reality a shift from ‘Intercity or regional’ trains to<br />
‘High-speed trains’ is anticipated. However, as the estimated future energy use and GHG<br />
content (per passenger-km) only have a modest difference for these two types of trains, an<br />
internal mode-shift will only have a modest influence (likely less than 5 %) on the total<br />
average, although toward reduced emissions. Also, an internal mode shift from diesel to<br />
electric trains is anticipated, although uncertain to what degree. However, as diesel trains have<br />
just a minor market share today (about 12 %), such a limited mode shift will also only have a<br />
minor, however positive, influence on the average GHG emissions from rail operations. The<br />
assumed two mode shifts will both contribute to reduced GHG emissions and can be considered<br />
as an extra margin in the estimated improvements.<br />
Deliverable D4 – <strong>WP3</strong> passenger 20
In most cases it is assumed that the GHG content of the electricity mix is as in 2009 (128<br />
gCO 2 -eq per MJ el), except for scenario 8, where it is assumed to be reduced by 80 % by 2050.<br />
Scenario 8 is just an example, as the GHG content of electricity is a scenario variable of Stage<br />
2 of Tosca. GHG emissions from diesel trains are direct emissions (75 gCO 2 -eq per MJ fuel),<br />
assumed to use fossil fuels only.<br />
Table 5-3a<br />
Energy use and GHG emissions (per passenger-km) by technology, as an<br />
average over intercity, regional and city passenger trains, estimated for new<br />
trains by 2050 compared with reference trains, at public grid or fuel tank.<br />
Most<br />
likely<br />
Energy Use<br />
(MJ / pass-km)<br />
LB<br />
UB<br />
GHG Emissions<br />
(g CO 2 -eq / pass-km)<br />
Most<br />
likely<br />
Reference electric trains (2009) 0.368 47<br />
1. PA Low-drag 0.334 0.32 0.35 43 41 45<br />
2. PB Low-mass 0.343 0.33 0.36 44 42 46<br />
3. PC Energy recovery 0.313 0.29 0.33 40 37 41<br />
4. PD Space efficiency 0.314 0.30 0.34 40 38 42<br />
5. PF Eco-driving 0.310 0.29 0.33 40 37 41<br />
6. Pcomb electric (incl. incremental) 0.157 0.13 0.19 20 17 24<br />
7. Pcomb HS: As (6) + higher speed 0.187 0.16 0.23 24 20 29<br />
8. As 7. + low-GHG electric mix 0.187 0.16 0.23 5 4 6 a<br />
LB<br />
UB<br />
Reference diesel train (2009) 0.75 54<br />
9. Pcomb diesel 0.37 0.34 0.43 27 25 32<br />
a<br />
With the GHG content of average electricity reduced by 60 % (instead of 80 % as assumed tentatively) the<br />
resulting GHG emissions are estimated to 8–11 gCO 2 -eq per net-tonne-km. The different scenarios presented in<br />
<strong>TOSCA</strong> WP6 are approximately within the range of 60–80 % reduction.<br />
Note that diesel trains by 2050 in Table 5-3a seem to be almost as good as the average electric<br />
train, assuming that GHG content of electricity is the same as in 2009. This will however not<br />
be the case if the average carbon content of European electricity is reduced. Another important<br />
aspect is that the average speed of electric trains by 2050 is 60 % higher than for diesel trains,<br />
which makes such a comparison inappropriate.<br />
Deliverable D4 – <strong>WP3</strong> passenger 21
Table 5-3b<br />
Energy use and GHG emissions (per passenger-km, at public grid), for highspeed<br />
electric trains, as estimated for new trains by 2050 compared with<br />
reference train, at public grid or fuel tank.<br />
Most<br />
likely<br />
Energy Use<br />
(MJ / pass-km)<br />
LB<br />
UB<br />
GHG Emissions<br />
(g CO 2 -eq / pass-km)<br />
Most<br />
likely<br />
Reference high-speed train (2009) 0.243 31<br />
1. PA Low-drag 0.203 0.18 0.23 26 44 47<br />
6. Pcomb electric (incl incremental) 0.126 0.11 0.15 16 23 32<br />
7. Pcomb (as 6) + higher speed 0.165 0.15 0.20 21 19 25<br />
8. Pcomb (as 7) + low-GHG el mix 0.165 0.15 0.20 4 4 5<br />
Results are presented graphically in Fig 5-2 (energy use) and Fig 5-3 (greenhouse gas emissions),<br />
in both cases aggregated over all types of electric rail passenger services. In Fig 5-2<br />
Scenario 8 with low-GHG electric power is omitted because energy use is equal to Scenario 7.<br />
In Fig 5-3 the combination Scenario 6 (with constant speed) is omitted for simplicity reasons.<br />
2050 2025 2009 reference<br />
LB<br />
UB<br />
Low drag<br />
100.0%<br />
93.8%<br />
89.7%<br />
Low mass<br />
100.0%<br />
97.5%<br />
93.8%<br />
Energy recovery<br />
100.0%<br />
92.2%<br />
87.0%<br />
Space efficiency<br />
100.0%<br />
91.5%<br />
85.8%<br />
Eco drive<br />
100.0%<br />
91.1%<br />
85.2%<br />
All comb<br />
44.3%<br />
66.6%<br />
100.0%<br />
All comb + Higher<br />
speed<br />
53.7%<br />
72.2%<br />
100.0%<br />
Figure 5-2<br />
Estimated trends of energy use (per passenger-km) by technology over time,<br />
including all combinations and higher speeds, aggregated and weighted over<br />
all types of electric rail passenger services.<br />
Deliverable D4 – <strong>WP3</strong> passenger 22
2050 2025 2009 reference<br />
Low drag<br />
100.0%<br />
93.8%<br />
89.7%<br />
Low mass<br />
100.0%<br />
97.5%<br />
93.8%<br />
Energy recovery<br />
100.0%<br />
92.2%<br />
87.0%<br />
Space efficiency<br />
100.0%<br />
91.5%<br />
85.8%<br />
Eco drive<br />
100.0%<br />
91.1%<br />
85.2%<br />
All comb + Higher<br />
speed<br />
53.7%<br />
72.2%<br />
100.0%<br />
All comb + Higher<br />
speed + Low GHG el<br />
14.4%<br />
10.7%<br />
100.0%<br />
Figure 5-3<br />
Estimated trends of GHG emissions (per passenger-km) by technology over<br />
time, including all combinations and higher speeds, aggregated and weighted<br />
over all types of electric rail passenger services.<br />
NB: The first six rows assumes a GHG content of EU-27 electricity mix in 2009<br />
(128 g CO2-eq per MJ), while the lowest row assumes GHG to be reduced by 80 %.<br />
Summary<br />
- By far the most efficient single means of reducing greenhouse gas emissions (GHG)<br />
originates outside the railway sector, namely the provision of Low-GHG electric power. In<br />
the example above this reduction is assumed to be 80 % by 2050, although this is a variable<br />
in Stage 2 of Tosca.<br />
- The most efficient means of reducing energy use and GHG emissions within the railway<br />
sector are Eco-driving, Space efficiency, Energy recovery as well as incremental<br />
development in reduced losses. For ‘High-speed’ and ‘Intercity or regional’ trains<br />
aerodynamic design to reduce air drag is also important and for ‘Local city trains’ mass<br />
reduction.<br />
- The combination of different means has the ability of producing a very significant longterm<br />
reduction in energy use and GHG emissions.<br />
- Higher speeds are in the long term expected for electric ‘Intercity or regional’ trains as well<br />
as for ‘High-speed trains’. Some increase in speed is expected also for ‘Local city’ trains.<br />
This will increase energy use, all other factors being equal. However, due to improvements<br />
in technology still very significant reductions of energy and GHG emissions are expected.<br />
Deliverable D4 – <strong>WP3</strong> passenger 23
5.3 Cost for reducing GHG emissions<br />
The costs for reducing GHG emissions are dependent on both the additional cost for vehicle<br />
investment and on the change in operating cost (at this stage excluding energy). Estimations<br />
are made with cost models developed at and used by KTH. However, it should be noted that it<br />
is extremely difficult to make thorough and reliable predictions for the year 2050. In particular,<br />
estimates on future sales prices of trains are uncertain. In this study future sales prices are<br />
assumed to be the same in real terms as for the reference year 2009, provided that trains are<br />
equivalent in performance.<br />
Operating costs, other than depreciation and interest cost for trains, are also assumed to be the<br />
same as in 2009 in real terms. Only those changes in operating cost (maintenance, track<br />
charges, etc) that are motivated by changes in technology or average speed are considered in<br />
this study. No considerations are taken to possible effects of a deregulated European rail<br />
market, which would make rail freight services more cost-efficient.<br />
Energy cost is excluded from operating costs, as energy cost is a variable in Stage 2 of<br />
<strong>TOSCA</strong>. However, to provide a holistic picture, the estimated energy savings are indicated in<br />
the right column of Table 5-4 below.<br />
Assumptions<br />
- Sales price for trains is proportional to suppliers cost for development and manufacture with<br />
the same cost structure as in 2009.<br />
- Depreciation in 25 years, 6 % interest → equal payment (annuity) of 7.82 % each year.<br />
This is practically almost equivalent with 8 % capital cost per year, which is the resulting<br />
capital cost by using the following simple estimate used throughout in <strong>TOSCA</strong><br />
C = I · (r + 1/n),<br />
where C = annual capital cost; I = investment; r = average interest rate = 0.04;<br />
n = life time = 25 years.<br />
The above used interest rates are chosen from a long-term socio-economic perspective and<br />
are not including profit margins.<br />
- Tonnage-dependent track charges: 0.003 EUR/grosstonne-km, which is an approximate<br />
average in Europe, according to (Nash, 2005)<br />
- Value of saved train crew time on trains, average per time-tabled hour:<br />
70 EUR (conductors and similar) – 100 EUR (drivers).<br />
- No other improvements than the earlier mentioned technologies for improving energy and<br />
GHG performance are studied, irrespective of their potential for per-unit cost<br />
reductions. Examples of improvement not considered in this context are: higher load<br />
factor, reduced maintenance or improved train crew or rolling stock utilization.<br />
Comparison with road and air transport<br />
To compare with road and air transport, cost characteristics for the rail mode are divided in two<br />
tables:<br />
- Table 5-4a presents cost characteristics aggregated over intercity, regional and city rail<br />
services, for comparison mainly with road transport;<br />
- Table 5-4b presents cost characteristics for high-speed rail service, for an approximate<br />
comparison also with air transport.<br />
Deliverable D4 – <strong>WP3</strong> passenger 24
Table 5-4a Cost characteristics, aggregated and weighted over intercity, regional and city<br />
trains (electric and diesel), as estimated for new trains by 2050, compared with<br />
reference trains.<br />
Note: In this table energy cost is excluded from operating cost, but is indicated as the expected<br />
amount of energy consumption per passenger-km (pkm)<br />
Sales price<br />
(MEUR / train<br />
unit)<br />
Varia<br />
Estimated<br />
-tion<br />
Operating cost d<br />
(EUR / pass-km)<br />
Estimated<br />
Variation<br />
Energy e<br />
(MJ<br />
/pkm)<br />
Most<br />
likely<br />
Reference electric trains (2009) a 15.1 ±2 0.098 ±0.011 0.368<br />
1. PA Low drag b 15.4 ±2 0.099 b ±0.012 0.334<br />
2. PB Low mass 16.5 ±2.5 0.099 ±0.014 0.343<br />
3. PC Energy recovery 15.1 ±2 0.096 ±0.012 0.313<br />
4. PD Space efficiency 12.7 c ±2 0.089 ±0.012 0.314<br />
5. PF Eco-driving 15.2 ±2 0.097 ±0.011 0.310<br />
6. Pcomb electric + incremental 14.6 c ±2.5 0.088 ±0.015 0.157<br />
7. Pcomb HS (6) + higher speed 16.5 c ±2.8 0.087 ±0.016 0.187<br />
Reference diesel train (2009) a 12 ±1.5 0.127 ±0.014 0.75<br />
9. Pcomb diesel + incremental 12 ±1.5 0.120 ±0.014 0.37<br />
a<br />
At the reference year electric trains have a total estimated market share of 88 %, and diesel-hauled trains 12 %.<br />
b For high-speed trains it is assumed that a ‘Low-drag’ train will have 3 % less number seats due to longer front<br />
and tail. Other types of trains will not be influenced in this respect.<br />
c Sales price recalculated for the equivalent number of seats as for the reference of 2009. See note c) of Table 5-2.<br />
d Operating costs include capital, maintenance, crew, track & station & dispatch, train formation, sales and<br />
administration. Capital cost excludes profit margins.<br />
e Energy intake to railway’s electric supply system or to fuel tank.<br />
At the reference year 2009, the average cost of electric energy in EU-27 (taken from power grid) is<br />
0.091 EUR /kWh or 0.025 EUR /MJ. For diesel fuel the average cost is 0.015 EUR/MJ.<br />
In both cases taxes are excluded.<br />
Note that the difference in sales price per train unit, as a result of changes in technology, in<br />
most cases is smaller than the normal variation of sales price between different suppliers and<br />
depending on the actual market situation. The estimates should therefore be interpreted as<br />
average prices. Average prices are assumed to follow cost variations, on the assumption that<br />
supplier‘s profit margins will not be changed.<br />
Despite the relatively small variations in sales prices of trains with different energy-saving<br />
technologies, it is anticipated that even these differences must be justified at train acquisition.<br />
Even moderate price differences will be valued in relation to the documented or believed<br />
benefits they offer.<br />
Deliverable D4 – <strong>WP3</strong> passenger 25
Cost characteristics over time, aggregated over all types of electrical trains, are presented<br />
graphically in Figure 5-4.<br />
2050 2025 2009 reference<br />
Low drag<br />
Low mass<br />
Energy recovery<br />
Space efficiency<br />
Eco drive<br />
All comb +<br />
incremental<br />
All comb + Higher<br />
speed<br />
100%<br />
101%<br />
101%<br />
100%<br />
100%<br />
101%<br />
100%<br />
99%<br />
98%<br />
100%<br />
95%<br />
91%<br />
100%<br />
100%<br />
100%<br />
100%<br />
94%<br />
90%<br />
100%<br />
93%<br />
89%<br />
Figure 5-4<br />
Estimated trends in operating costs (excl. energy cost) by technology over time,<br />
including combinations and higher speeds, aggregated and weighted over all<br />
types of electric rail passenger services.<br />
Deliverable D4 – <strong>WP3</strong> passenger 26
Table 5-4b<br />
Cost characteristics for high-speed train services (electric),<br />
as estimated by 2050, compared with reference train (2009).<br />
Note: In this table energy cost is excluded from operating cost, but is indicated as the expected<br />
amount of energy consumption per passenger-km (pkm).<br />
Sales price<br />
(MEUR / train unit)<br />
Estimated<br />
Operating cost d<br />
(EUR / pass-km)<br />
Variation<br />
Estimated<br />
Variation<br />
Energy e<br />
(MJ /pkm)<br />
Most<br />
likely<br />
Reference high-speed train a 28 ±3 0.063 ±0.010 0.243<br />
1. PA Low-drag b 28.5 ±3.5 0.064 b ±0.010 0.203<br />
2. PB Low-mass --- --- --- --- ---<br />
3. PC Energy recovery 28 ±3 0.063 ±0.010 0.236<br />
4. PD Space efficiency 24.5 c ±3 0.058 ±0.010 0.213<br />
5. PF Eco-driving 28.1 ±3 0.062 ±0.010 0.220<br />
6. Pcomb electric + incremental 25 ±3.5 0.058 ±0.011 0.126<br />
7. Pcomb HS: (6) + higher speed 28 ±4 0.057 ±0.011 0.165<br />
a<br />
At the reference year high-speed trains is estimated to have a market share of 20 % on the rail passenger<br />
market; are however anticipated to increase until 2050.<br />
b For high-speed trains it is assumed that a ‘Low-drag’ train will have 3 % less number seats due to longer front<br />
and tail and also 2 % higher price than the reference train.<br />
c Sales price recalculated for the equivalent number of seats. See note c) of Table 5-2.<br />
d Operating costs include capital, maintenance, crew, track & station & dispatch, train formation, sales and<br />
administration. Capital cost excludes profit margins.<br />
e Energy intake to railway’s electric supply system, from public grid.<br />
At the reference year 2009, the average cost of electric energy in EU-27 (taken from power grid) is<br />
0.091 EUR /kWh or 0.025 EUR /MJ, taxes excluded.<br />
Sales price evolution over time<br />
<strong>Rail</strong> passenger vehicles are usually developed “on behalf” a specific market or customer, for<br />
series of 100–1000 four-axle vehicles. Development cost is distributed over the actual number<br />
of vehicles. For smaller series the sales price therefore will be higher. Typically, 40 vehicles<br />
instead of 400 typically increase the per-unit price by 15–20 %, but this is of course dependent<br />
on the level of development cost. For early technologies there is also a small “learning” effect,<br />
so that production cost declines over time with each doubling of cumulative output. This effect<br />
is estimated to be 10–15 % over a time span of 10–15 years, but very often new technologies<br />
are more efficient and the older (and more inexpensive) technologies would become obsolete<br />
anyhow. These conditions for the rail vehicle market are anticipated to essentially continue in<br />
the future.<br />
Deliverable D4 – <strong>WP3</strong> passenger 27
Break-even price of energy for profitable technology introduction<br />
It is important to understand which energy-saving technologies would be most beneficial in<br />
terms of operational economics, and most likely to be introduced from a train operator’s point<br />
of view. Therefore the necessary break-even price of electricity, where increased operational<br />
costs are balanced by energy cost savings, is calculated for the different types of electric train<br />
operations. Estimated operational costs of new technologies are compared with costs for<br />
reference technologies and with the amount of energy savings.<br />
Results are shown in Table 5-4c. The table shows break-even prices of electricity for profitable<br />
introduction of important technologies, for average electric train operations and for specific<br />
categories of operations where these are believed to produce results diverging from average.<br />
Table 5-4c Break-even price of electricity for long-term profitable introduction of<br />
technologies as estimated by year 2050.<br />
Note: At the reference year 2009, the average cost of electric energy in EU-27 (taken from<br />
power grid) is 0.091 EUR /kWh, excluding taxes.<br />
Profit margin for capital cost is not included.<br />
Average<br />
High-speed<br />
train unit<br />
Electric<br />
(EUR/kWh)<br />
Local<br />
city train<br />
Electric<br />
(EUR/kWh)<br />
Technologies<br />
Electric<br />
(EUR/kWh)<br />
PA Low-drag 0.06 0.08<br />
PB Low-mass 0.14 0.16<br />
PC Energy recovery – 0.15 a – 0.13 a<br />
PD Space efficiency – 0.60 a – 0.64 a NA<br />
PF Eco-driving – 0.07 a – 0.08 a – 0.09 a<br />
a Negative break-even prices of electricity should be interpreted as a beneficial technology with respect to<br />
operational cost, also if energy cost is excluded. It can also be interpreted as the payment to the operator per used<br />
kWh that is necessary to balance the cost of not using the proposed technology.<br />
Deliverable D4 – <strong>WP3</strong> passenger 28
Summary and comments<br />
- Some of the investigated technologies do not influence the total operating cost significantly<br />
if energy cost is excluded. There is however a tendency of decreasing operating cost when<br />
Energy recovery or Eco-driving is applied, because of less frequent use of the mechanical<br />
brakes, which leads to reduced maintenance of these brakes. However, on some rail<br />
networks increased energy recovery requires the electrical supply system to be rebuilt or<br />
upgraded in order to be receptive for an increased amount of feed-back electric energy. In<br />
the long term however this is anyhow an anticipated development.<br />
- The most cost-saving measure is to increase space utilization (essentially this is the number<br />
of seats per metre length of train), by changing from loco-hauled trains to multiple units<br />
and/or by increase the space efficiency of interiors.<br />
- Reduced mass per metre of train tends to increase cost if energy cost is excluded. This is<br />
due to higher production cost of the train, and thus investment and capital cost, assumed to<br />
be 20 EUR per kilogram of reduced mass (which is about half of the average price per<br />
kilogram of the whole train). However, this estimate is not confirmed, due to a lack of<br />
reliable sources for long-term estimations. Track charges and train maintenance costs will<br />
be lower for low-mass trains, which partly compensates for higher capital cost. With about<br />
50 % increased prices of electricity (relative to 2009) the ‘low-mass’ train, with assumed<br />
costs of mass reduction, is about to break even in a long-term economic perspective. For<br />
’Local city trains’ with frequent stops, low mass will save more energy and GHG per<br />
average pkm, but the relatively low utilization (km per year) of these trains will limit the<br />
benefits to moderate levels. Due to the current uncertainties on cost and the underdeveloped<br />
technology of low mass trains, a comprehensive R&D program is recommended.<br />
- Low drag is long-term beneficial for ‘High-speed trains’ and also for the ‘Intercity or<br />
regional’ segment, if current energy prices are applied, and still more at higher energy<br />
prices.<br />
- The used interest rate for increased vehicle investment is chosen from a long-term<br />
perspective and is not including profit margins in profit-making operating companies. This<br />
fact indicates that additional incentives – except energy cost savings - may be required for<br />
some technologies.<br />
- Higher speed is usually beneficial for the operator from a cost point of view, due to<br />
increased mileages both for trains and for the train crew. This is in spite of slightly<br />
increasing cost of trains as well as for maintenance and energy. In addition, considerations<br />
must be taken to the increased willingness to pay for shorter travel time; see Section 5.6, in<br />
particular Table 5-8.<br />
Deliverable D4 – <strong>WP3</strong> passenger 29
5.4 Scalability<br />
In this section technology-induced limits are considered with regard to the scalability, i.e.<br />
potential market share in EU-27. No limits with regard to the supply of technology at a<br />
sufficiently fast rate are considered.<br />
The percentage market shares are approximate and should be seen as a rough estimate. For<br />
most technologies there is a continuum with regard to the degree they are applied. Further,<br />
what is – for example – considered as “low air drag” is dependent on what type of train this<br />
measure is applied to; for a ‘High-speed train’ the targets are very high, while for an ‘Intercity<br />
or regional train’ the targets are lower, and for a ‘Local city train’ still more modest. Today’s<br />
high-speed trains have lower air drag than the ‘Local city trains’ are expected to have by 2050,<br />
at the same speed. In the example of “low-drag” technology the market share is estimated to be<br />
approximately 75 % as this is the sum of market shares for the rail operations where higher<br />
targets can be motivated (i.e. slow trains are excluded). This example shows that no exact<br />
definition of scalability is possible.<br />
However, it is anticipated that the different technologies are implemented to approximately the<br />
same amount (± 1/5) as shown in Table 3-1 in Section 3.5.<br />
Table 5-5 Scalability Characteristics, i.e. maximum possible market share by 2050.<br />
The table refers to the fraction of the market (in passenger-km) in which it<br />
could be motivated.<br />
Percent EU-27 Market<br />
Most Likely LB UB<br />
PA Low drag 75 50 90<br />
PB Low mass 30 15 50<br />
PC Energy recovery 90 70 100<br />
PD Space efficient 75 40 80<br />
PE Modular short train 20 10 40<br />
PF Eco driving 95 80 100<br />
PG Dual mode 5 2 10<br />
PH Bio fuels 5 1 12<br />
PI Electrification 6 4 10<br />
PJ Low-GHG electric power 80 50 90<br />
Higher speed 85 85 85<br />
Deliverable D4 – <strong>WP3</strong> passenger 30
5.5 Social acceptability<br />
Table 5-6<br />
Social acceptability<br />
Rates from ‒ ‒ “unacceptable adverse effect” to + + “significant benefits”;<br />
0 being “comparable to reference system”.<br />
Values within (parentheses) indicate that counter-measures are expected to be taken in order to<br />
produce a neutral outcome.<br />
Social equity<br />
implications<br />
Generation<br />
within EU<br />
of jobs<br />
<strong>Passenger</strong> safety<br />
Noise<br />
Privacy<br />
Ethical issues<br />
PA Low drag 0 + 0 0 (+) 0 +<br />
PB Low mass 0 + 0 0 (+) 0 +<br />
PC Energy recovery 0 0 0 0 0 ++<br />
PD Space efficient 0 + 0 0 - ++<br />
PE Modular short train 0 0 0 + 0 +<br />
PF Eco-driving 0 0 0 0 0 ++<br />
PG Dual mode 0 + 0 0 (+) 0 +<br />
PH Bio fuels -to + 0 to + 0 0 0 - to +<br />
PI Electrification 0 + 0 0 (+) 0 +<br />
PJ Low-GHG electric power - to 0 0 0 0 0 0 to +<br />
Higher speed 0 0 0 (-) 0 (-) 0 0 (-)<br />
Comments<br />
- Most technologies and measures are neutral or not far from neutral with respect to social<br />
acceptability, at least after that counter-measures have been taken.<br />
- All technologies that contribute to the competitiveness of the European rail industry (in this<br />
case: suppliers of rail vehicles and infrastructure in relation to non-EU suppliers) are<br />
assumed to be positive for job creation or at least job survival.<br />
- Technologies that contribute to reduction of greenhouse gases (GHG) have an inherent<br />
positive ethical value. Regarding bio fuels however this is uncertain, due to possible<br />
conflicts with land use and food production; see WP4 report.<br />
- In a narrow sense higher speed contributes to higher GHG emissions because of higher<br />
energy use, for the same type of train. However, the historical trend is that trains are<br />
adapted to the intended use, so higher speeds will force a faster and more ambitious<br />
development of energy-saving features, in particular low air drag. Moreover, if higher train<br />
speeds contribute to a higher competitiveness of rail operations, and these ‘higher speed’<br />
operations have comparative benefits from a GHG point of view, the ‘Higher speed’ factor<br />
would be even more positive.<br />
Deliverable D4 – <strong>WP3</strong> passenger 31
- Higher speed could in a narrow sense also be considered as more unsafe than lower speed,<br />
as the consequences of an accident would most likely be more serious. However, highspeed<br />
operations (say from 200 km/h and above) have since their introduction in the 1960´s<br />
shown a superior world-wide statistical record on safety (Grimvall et al, 2010). This is due<br />
to a number of safety measures that are taken when higher speeds are introduced. These are<br />
included in the cost estimations of Section 5.4. Therefore higher speed is expected to be at<br />
least as safe as “slower speed”.<br />
- Noise could in a narrow sense be reduced or increased as a result of the introduction of new<br />
technologies or speeds. However, external noise emissions are regulated by law. Therefore<br />
appropriate measures must be taken to limit noise to the prescribed level, thus maintaining<br />
noise levels at an essentially constant level, independent of technology and speed. The<br />
resulting effect will therefore be more or less countermeasures, which are included in the<br />
cost estimations of Section 5.3.<br />
- Privacy could be negatively affected by a too tight layout of seats in Space-efficient trains.<br />
<strong>Passenger</strong>s’ privacy must, as well as comfort and working-ability issues, be taken into<br />
consideration when space-efficient train interiors are created.<br />
5.6 User acceptability<br />
Acceptability of the different technologies to the end users (passengers) is rated and presented<br />
in Table 5-7. User cost is assumed to reflect costs in Table 5-4, i.e. the rail operators will<br />
transfer changes in the operating cost to the passenger, at least in the long term in a competitive<br />
market situation.<br />
Table 5-7<br />
User acceptability at given user cost.<br />
Ratings are from 0 (no adoption) to 5 (full adoption).<br />
User acceptability<br />
at given<br />
user cost<br />
PA Low drag 5<br />
PB Low mass 4<br />
PC Energy recovery 5<br />
PD Space efficient 3<br />
PE Modular short train 5<br />
PF Eco driving 5<br />
PG Dual mode 5<br />
PH Bio fuels 3<br />
PI Electrification 5<br />
PJ Low-GHG electric power<br />
Higher speed 5<br />
a Technologies and acceptability of low-GHG electric power is outside the<br />
railway sector and is therefore outside the scope of this particular study.<br />
a<br />
Deliverable D4 – <strong>WP3</strong> passenger 32
Comment<br />
- Most technologies and measures are expected to be fully accepted, although there are some<br />
uncertainties on PB Low mass, due to the slightly higher cost that would occur. Cost is<br />
however not confirmed at this stage. Some bio fuels (in particular vegetable oil) would<br />
likely be subject to resistance because of their higher cost and possibly also conflict with<br />
food production. Low-GHG electric power may partly also be subject to resistance if more<br />
nuclear or wind power plants are to be built.<br />
End user’s willingness to pay is presented in Table 5-8.<br />
Assumptions<br />
- Value of saved passenger time: 11 EUR per hour, constant until 2050.<br />
- Value of leg space at the seat: 6 % of fare per 10 % of increased experienced space<br />
(Kottenhoff, 2009).<br />
Table 5-8<br />
End user willingness to pay, as estimated by 2050, aggregated over all types of<br />
passenger rail services. LB = lower bound; UB = upper bound.<br />
End user is the average passenger.<br />
+ means: how much additional fare would end user be willing to pay<br />
– means: how much should end user be paid to fully adopt the technology<br />
Most<br />
likely<br />
Reference electric trains ±0<br />
Willingness to pay<br />
(EUR / pass-km)<br />
1. PA Low-drag a ±0 0 +0.003<br />
2. PB Low-mass ±0 0 0<br />
3. PC Energy recovery ±0 0 0<br />
4. PD Space efficiency b -0.0025 0 -0.004<br />
5. PF Eco-driving ±0 0 0<br />
6. Pcomb electric (incl. incremental) -0.0025 0 -0.004<br />
7. Pcomb (6) + higher speed +0.011 +0.010 +0.012<br />
8. As 7. + low-GHG electric mix +0.011 +0.010 +0.012<br />
LB<br />
UB<br />
Reference diesel trains ±0<br />
9. Pcomb diesel -0.0025 0 –0.004<br />
a<br />
A streamlined appearance would have a positive impact on passenger’s perception of the train,<br />
which likely induces a slightly higher willingness to pay. However, variations in appearance perception<br />
are not included in other Work Packages of <strong>TOSCA</strong>, so this consideration is excluded in the subsequent analysis.<br />
b For the ‘Intercity or regional’ segment it is assumed that loco-hauled trains are replaced by multiple-unit trains.<br />
In addition, for all trains except ‘Local city trains’ it is assumed that 2/3 of improved space efficiency in interiors<br />
is achieved by developed smart design and will therefore not influence passenger’s perception and willingness to<br />
pay negatively. However, it is assumed that the perception of space (leg-room) is reduced by 5 % until 2050,<br />
which will induce a negative willingness to pay (Kottenhoff, 2009).<br />
Deliverable D4 – <strong>WP3</strong> passenger 33
6 SUMMARY AND CONCLUSIONS<br />
It is naturally a very difficult task to estimate and foresee viable and plausible technologies that<br />
could likely be implemented in the long term from the reference year 2009 until 2050. In the<br />
rail sector there is a lack of qualified estimations on technology in the long term. The approach<br />
used in this study is to divide the total 41 year period in two periods, with the first period until<br />
2025, and the second from 2025–2050, with the following assumptions:<br />
Period 1<br />
Period 2<br />
The techno-economic potential for in-service introduction during the next<br />
10–15 years (i.e. until 2025) is estimated.<br />
Development is assumed to continue after 2025. It is assumed that 2/3 of the<br />
first period achievement can be achieved in the second period, i.e. 2025–2050.<br />
The exception is technology PB (Low-mass train) that requires more substantial<br />
research before technology readiness (see Table 3-1), which will delay most of<br />
its possible introduction to Period 2.<br />
This means that almost 60 % of the total achievement is what today is known or assumed as<br />
appropriate technologies, possible to introduce in regular service under the first period, while<br />
the rest is assumed to be achieved under the second period.<br />
This stepwise methodology is used in order to minimize uncertainties as far as possible, by<br />
basing assumptions on what is recently known or believed to be appropriate technologies in the<br />
intermediate term. The assumption that development will continue during Period 2 is plausible,<br />
although the exact rate per year or decade is uncertain. Developments will in reality likely be<br />
different for various technologies.<br />
6.1 Summary<br />
According to the analysis in Sections 2 to 5, the technologies and measures described below<br />
are the most promising in order to reduce energy use and greenhouse gas (GHG) emissions<br />
with economically viable means. They are presented in the order of their estimated potential<br />
for GHG reductions in new trains by 2050. The first seven technologies and means presented<br />
below are applied as a single mean with all other conditions being equal to the reference trains.<br />
Note that energy cost is excluded from the estimated economical savings, because energy cost<br />
is a variable in Stage 2 of <strong>TOSCA</strong>. The resulting total cost savings will therefore be higher<br />
than indicated below.<br />
PJ Low-GHG electricity<br />
With a prospected GHG reduction of 50–90 % until 2050, and a possible market penetration on<br />
all electrified rail services, this is without doubt the most promising single technology. This<br />
technology – or combination of different technologies – is developed and provided outside the<br />
railway sector but has nevertheless a large positive impact. Low-GHG electricity must<br />
therefore not be neglected in the evaluation of the future GHG performance of rail operations.<br />
Estimated overall GHG reduction from electric rail operations: 50–80 %<br />
impact on operating cost, excluding energy: 0 %<br />
end user average willingness to pay: 0 %<br />
Deliverable D4 – <strong>WP3</strong> passenger 34
PF Eco-driving<br />
With an estimated average GHG reduction of 15 % by 2050, as a single individual measure,<br />
and a market penetration in almost every type of rail operations this is the second most<br />
important technology, and the most important technology generated in the rail sector itself. It is<br />
to some extent used by train drivers already today but can be significantly improved by using<br />
computer-assisted advice (or in some cases automatic train operation). It is a low-cost<br />
technology and has no adverse effects on society, operators or end users. Operating cost will be<br />
reduced according to energy savings, although not included at this stage of <strong>TOSCA</strong>. Ecodriving<br />
will likely also lead to reduced maintenance on train braking equipment.<br />
This technology will be most efficient in frequently stopping ‘Local city train’ operations,<br />
where it is estimated to reduce energy and GHG emissions by about 20 %.<br />
Estimated overall GHG reduction from rail operations: 15 %<br />
impact on operating cost, excluding energy: -1 %<br />
end user average willingness to pay: 0 %<br />
PD Space efficiency<br />
Improved space efficiency, i.e. an increased number of seats per unit length or unit mass of the<br />
train, can be achieved in two ways; (1) by replacing the conventional train consist of<br />
locomotive + cars with multiple unit trains, having the propulsion in the same cars as<br />
passengers, or (2) by improving space utilisation within the car’s interior through smart and<br />
space-saving solutions, while still being convenient for passengers.<br />
This technology is applicable to ‘High-speed’ as well as ‘Intercity or regional’ operations,<br />
while no further improvement is anticipated on ‘Local city’ trains.<br />
Estimated overall GHG reduction from rail operations: 14 %<br />
impact on operating cost, excluding energy: - 9 %<br />
end user average willingness to pay: - 3 %<br />
PC Energy recovery<br />
Energy recovery is used already today in many electric train operations, although not in all.<br />
Due to limitations in the share of powered axles, in the propulsion and electric braking power<br />
as well as in the receptivity of the electric supply system, the energy recovery is less than<br />
optimum. In diesel-hauled trains there is no energy recovery at all, but this could change when<br />
energy-storing technologies are further developed. Besides energy saving, energy recovery will<br />
have a side-effect through reduced wear on the mechanical brake equipment, which will reduce<br />
maintenance cost. It is important that at least about 50 % of the axles of the train are powered<br />
and that the installed power for propulsion and electric braking is high, in order to guarantee a<br />
high enough braking effort at electric recovery braking. The assumed power in this study is at<br />
least 20 kW per tonne of train mass for electric trains.<br />
This technology is applicable to all types of train services, but is most efficient on stopping<br />
train services such as ‘Local city trains’. As a single measure it can save another 20 % of used<br />
energy, compared with today’s reference city trains. ‘Intercity or regional’ operations have an<br />
estimated potential for 10–12 % energy savings as an average. The full application of this<br />
technology needs upgrading of the electric supply system on some rail networks.<br />
Estimated overall GHG reduction from rail operations: 13 %<br />
impact on operating cost, excluding energy: - 2 %<br />
end user average willingness to pay: 0 %<br />
Deliverable D4 – <strong>WP3</strong> passenger 35
PA Low-drag<br />
In absolute terms low air drag is most important for high-speed trains, with an estimated longterm<br />
reduction of energy use by 17 % when applied as a single measure. The potential is large<br />
also for ordinary trains, such as ‘Intercity or regional’. For low-speed stopping trains low drag<br />
is less important due their low average speed. Operating cost will in most cases be reduced<br />
according to energy savings. Further, a streamlined train design is believed to have a positive<br />
impact on passenger’s perception of the train as a modern mean of transportation, although no<br />
quantitative estimation is proposed in this study.<br />
Estimated overall GHG reduction from rail operations: 10 %.<br />
impact on operating cost, excluding energy: + 1 %<br />
end user average willingness to pay: 0 %<br />
PB Low-mass<br />
Train mass per seat can be reduced in two basic ways; (1) by conceptual improvements, such<br />
as using multiple units (with propulsion power in the same cars as passengers) instead of<br />
locomotive-hauled trains, or by using double deckers or wide-body trains, or (2) by reducing<br />
mass of the basic train technology by using new materials and weight-optimized structures.<br />
Mass reduction is an effective mean of reducing energy use and GHG emissions for frequently<br />
stopping train such as ‘Local city trains’, where a mass reduction of 20 %, as a single mean, is<br />
estimated to reduce energy use by about 10 %. For other types of train services the energy<br />
savings are much more moderate.<br />
Ambitious mass reductions that requires radical changes in the basic train technology, could<br />
lead to increasing cost for rail vehicles that would be prohibitive for their introduction. In this<br />
study assumptions for a modest cost increase are made, however the real future cost may either<br />
be higher or lower.<br />
Estimated overall GHG reduction from rail operations: 6 %.<br />
impact on operating cost, excluding energy: + 1 %<br />
end user average willingness to pay: 0 %<br />
Incremental improvements<br />
Incremental continuous improvements in energy use are expected to continue, with an<br />
estimated reduction of total energy consumption by 12 % in the long term until 2050. In<br />
particular, the energy losses in train propulsion and electric supply systems are expected to be<br />
reduced by 25–30 %. (i.e. from 26% to about 18 % of total input energy). This will be<br />
beneficial not only for energy intake, but also for energy recovery. The same relative<br />
improvements (25–30 %) are expected in auxiliary and comfort energy use, facilitated by<br />
recovery of heat, better controlled ventilation, heat pumps etc. There are also other options for<br />
continuous incremental improvements although not analysed in detail.<br />
Estimated overall GHG reduction from rail operations: 12 %.<br />
impact on operation cost, excluding energy: + 0 %<br />
end user average willingness to pay: 0 %<br />
Deliverable D4 – <strong>WP3</strong> passenger 36
Combination of measures<br />
The combination of all measures produces very significant reductions in energy use. Even if<br />
we exclude ‘Low-GHG electric power’, the estimations and simulations end up with a<br />
reduction of energy use and GHG by about 56 % on average, with the largest reduction for<br />
stopping ‘Local city trains’ at 60 %. This is a result of both less intake of energy and increased<br />
energy recovery, so that the resulting net energy is heavily reduced. Note that train speeds are<br />
assumed to be constant at this first stage of estimation.<br />
Estimated overall energy use and GHG reduction,<br />
excluding effect of higher speed and ‘Low-GHG electric power’: 56 %<br />
impact on operation cost, excluding energy: –10 %<br />
end user average willingness to pay: –3 %<br />
Higher speeds and combinations<br />
With all other conditions being equal higher speeds will increase energy consumption and the<br />
resulting GHG emissions. These negative effects are however expected to be essentially<br />
compensated by adapting technologies to increased speed. Shorter travel time will reduce<br />
operating cost due to higher productivity of trains and train crew. Most important, shorter<br />
travel time will increase willingness to pay. In all, trains will be more competitive. Also, from<br />
a socio-economic perspective shortened travel time will in many cases have benefits.<br />
The major drawback is the need for a high-performing rail infrastructure, which in certain<br />
cases would trigger a negative public opinion and usually require public funding. It should<br />
however be noted that higher speed and improved infrastructure does not only apply to veryhigh-speed<br />
rail (top speed 250 km/h and above), but also upgrading of conventional railways<br />
for top speeds lower than 250 km/h.<br />
Estimated overall GHG reduction, excluding effect of ‘Low-GHG electricity’ 46 %.<br />
impact on operation cost, excluding energy: –11 %<br />
end user average willingness to pay: +12 %<br />
Incentives needed<br />
The used interest rate for increased vehicle investment is chosen from a long-term perspective<br />
and is not including profit margins in profit-making operating companies. This fact indicates<br />
that further incentives – subsidies or penalties – in addition to energy cost savings, may be<br />
required for some technologies, in particular for ‘low-drag’ and ‘low-mass’.<br />
6.2 Conclusions<br />
In the present analysis it is estimated that a number of efficient technologies, individually and<br />
in combination, are available in order to significantly reduce energy use and the resulting GHG<br />
emissions on the rail passenger market until 2050.<br />
The analysis has considered different technologies and means<br />
– reduced air drag<br />
– reduced train mass<br />
– energy recovery<br />
– eco-driving, including traffic flow management<br />
– space efficiency in trains<br />
– incremental improvements in energy efficiency, in particular reduced losses.<br />
Deliverable D4 – <strong>WP3</strong> passenger 37
Despite higher train speeds in the future, these technologies will, according to the estimations,<br />
reduce energy use and GHG emissions by 45–50 % in the long term until 2050.<br />
By far the most efficient mean of reducing GHG emissions from rail operations is however<br />
low-GHG electricity, that is e.g. a number of technologies to be introduced outside the railway<br />
sector; the end result being dependent on the degree of GHG reductions in the future European<br />
mix of electricity. This is expected to further reduce per-unit GHG emissions by far more than<br />
the 45–50 % mentioned above.<br />
With a 60-80 % reduction of GHG content of future average European electricity, which is<br />
approximately within the different scenarios of <strong>TOSCA</strong> WP6, the resulting GHG emissions are<br />
estimated to 4–11 g CO2-eq per passenger-km, which is very favourable in comparison to<br />
other passenger transport modes.<br />
The results might be seen as optimistic, but they are due to the combination of a number of<br />
efficient tecnologies, which to some extent also reinforce each other. It should also be pointed<br />
out that some options are not analysed in detail at this stage, and are not included in the above<br />
estimations, i.e.<br />
- increased average seat occupancy rate (load factor) on trains<br />
- modular trains with capacity according to actual need.<br />
- dual-mode operations (diesel and electric) or hybrid vehicles<br />
- use of bio fuels<br />
- additional electrification of railways or increased investment in rail infrastructure<br />
These additional options would further strengthen the potential for reductions in energy use<br />
and GHG emissions in future rail operations. These means can be considered as a “reserve” in<br />
the case that some of the studied technologies and means would not be fully implemented, for<br />
one reason or the other. Three of these additional options are applicable to diesel passenger<br />
operations, which have a modest market share (about 12 % in EU-27). Therefore most of these<br />
additional options (with exception of improved load factor) will have a limited impact on total<br />
GHG emissions from railways (roughly estimated to 10-15 % of resulting GHG after other<br />
reductions), however having the potential to substantially reduce GHG emissions from diesel<br />
operations specifically. Including also improved load factor (applicable to most rail operations)<br />
an additional GHG reduction 10–20 % may be possible. These figures are however highly<br />
uncertain..<br />
The option of magnetic levitation is excluded from further analysis, since it is considered not to<br />
be an efficient mean of reducing energy use and GHG emissions.<br />
Substantial research is needed for low-mass trains, to assure that the mass reductions are made<br />
accurately to an acceptable cost. Partly substantial research is necessary also for reduced air<br />
drag and eco-driving.<br />
It is anticipated that society and users would not present any strong positive or negative<br />
attitudes to most of the proposed measures. Public resistance would, however, from time to<br />
time occur against new railway undertakings, in particular if new railway links are being built.<br />
The main restriction is the need for rail transport capacity and improved overall performance,<br />
and thus funding for improvement of the rail infrastructure. If a substantial mode shift to rail is<br />
envisaged, a comparatively large share of the total transport investment resources should be<br />
directed to the rail system. New high-speed railway links are needed in addition to<br />
improvements of the existing rail systems.<br />
Deliverable D4 – <strong>WP3</strong> passenger 38
REFERENCES<br />
Andersson E, Lukaszewicz P (2006): Energy consumption and related air pollution for<br />
Scandinavian electric passenger trains. Stockholm, KTH/AVE 2006:46.<br />
Diedrichs B: Personal communication with aerodynamic specialist at Bombardier<br />
<strong>Transport</strong>ation, 2010.<br />
EU (2009): EU energy and transport in figures.<br />
Grimvall G, et al (Eds.): Risk in Technological Systems. ISBN 978-1-84882-641-0, London<br />
2010.<br />
Kemp R, Smith R (2007): Technical issues raised by the proposal to introduce a 500 km/h<br />
magnetically-levitated transport system in the UK. Lancaster University & Imperial College,<br />
London.<br />
Kottenhoff K, Andersson E: Attractive and Efficient Train Interiors. KTH <strong>Rail</strong>way Group,<br />
Publ 0903, Stockholm, 2009.<br />
Lindemann M: Evaluation report of the saving potential by using the Drivers Assistant System<br />
including test campaigns. Deliverable D4.3.3 of <strong>Rail</strong>energy, Bombardier <strong>Transport</strong>ation,<br />
Germany, 2010.<br />
Luijt R S: ECO-driving – the implementation challenge. International conference “<strong>Rail</strong>ways<br />
and Environment”, Delft, The Netherlands, 16-17 Dec 2010.<br />
Lukaszewicz P: Energy Consumption and Running Time for Trains. KTH <strong>Rail</strong>way<br />
Technology, ISRN KTH/FKT/D-01/25-SE, Stockholm 2001.<br />
Lukaszewicz P, Andersson E (2009): Green Train energy consumption. KTH <strong>Rail</strong>way Group,<br />
Publ 0901, Stockholm 2009.<br />
Nash C: <strong>Rail</strong> infrastructure charges in Europe. Institute of transport studies, University of<br />
Leeds.<br />
Perimenis A, Majer S, Holland M, Mṻller-Langer F: Life cycle assessment of transportation<br />
fuels. Deliverable D5 (WP4 report) of <strong>TOSCA</strong>, DBFZ, Leipzig, 2010.<br />
<strong>Rail</strong>energy (EU FP6 project): Energy Efficiency days. Tours, 23–26 Sep 2009.<br />
http://www.energy-efficiency-days.org<br />
RSSB (<strong>Rail</strong>way Safety & Standards Board, London) (2007): Traction energy metrics.<br />
SIKA (Swedish Institute for <strong>Transport</strong> Analysis) (2009): Bantrafik 2008 (eng: <strong>Rail</strong> transport<br />
2008), Report 2009:22.<br />
UIC (International Union of <strong>Rail</strong>ways, Paris 2010): Energy efficiency strategies for rolling<br />
stock and train operation. www.railway-energy.org./tfee.<br />
UIC (International Union of <strong>Rail</strong>ways, Paris) (2008): <strong>Rail</strong> <strong>Transport</strong> and Environment – Facts<br />
and figures.<br />
Deliverable D4 – <strong>WP3</strong> passenger 39