WP3: Rail Passenger Transport - TOSCA Project
WP3: Rail Passenger Transport - TOSCA Project
WP3: Rail Passenger Transport - TOSCA Project

Create successful ePaper yourself
Turn your PDF publications into a flip-book with our unique Google optimized e-Paper software.
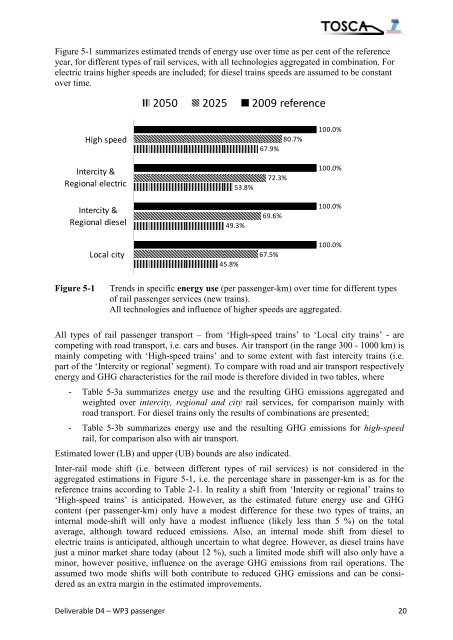
Figure 5-1 summarizes estimated trends of energy use over time as per cent of the reference<br />
year, for different types of rail services, with all technologies aggregated in combination. For<br />
electric trains higher speeds are included; for diesel trains speeds are assumed to be constant<br />
over time.<br />
2050 2025 2009 reference<br />
High speed<br />
67.9%<br />
80.7%<br />
100.0%<br />
Intercity &<br />
Regional electric<br />
53.8%<br />
72.3%<br />
100.0%<br />
Intercity &<br />
Regional diesel<br />
49.3%<br />
69.6%<br />
100.0%<br />
Local city<br />
45.8%<br />
67.5%<br />
100.0%<br />
Figure 5-1<br />
Trends in specific energy use (per passenger-km) over time for different types<br />
of rail passenger services (new trains).<br />
All technologies and influence of higher speeds are aggregated.<br />
All types of rail passenger transport – from ‘High-speed trains’ to ‘Local city trains’ - are<br />
competing with road transport, i.e. cars and buses. Air transport (in the range 300 - 1000 km) is<br />
mainly competing with ‘High-speed trains’ and to some extent with fast intercity trains (i.e.<br />
part of the ‘Intercity or regional’ segment). To compare with road and air transport respectively<br />
energy and GHG characteristics for the rail mode is therefore divided in two tables, where<br />
- Table 5-3a summarizes energy use and the resulting GHG emissions aggregated and<br />
weighted over intercity, regional and city rail services, for comparison mainly with<br />
road transport. For diesel trains only the results of combinations are presented;<br />
- Table 5-3b summarizes energy use and the resulting GHG emissions for high-speed<br />
rail, for comparison also with air transport.<br />
Estimated lower (LB) and upper (UB) bounds are also indicated.<br />
Inter-rail mode shift (i.e. between different types of rail services) is not considered in the<br />
aggregated estimations in Figure 5-1, i.e. the percentage share in passenger-km is as for the<br />
reference trains according to Table 2-1. In reality a shift from ‘Intercity or regional’ trains to<br />
‘High-speed trains’ is anticipated. However, as the estimated future energy use and GHG<br />
content (per passenger-km) only have a modest difference for these two types of trains, an<br />
internal mode-shift will only have a modest influence (likely less than 5 %) on the total<br />
average, although toward reduced emissions. Also, an internal mode shift from diesel to<br />
electric trains is anticipated, although uncertain to what degree. However, as diesel trains have<br />
just a minor market share today (about 12 %), such a limited mode shift will also only have a<br />
minor, however positive, influence on the average GHG emissions from rail operations. The<br />
assumed two mode shifts will both contribute to reduced GHG emissions and can be considered<br />
as an extra margin in the estimated improvements.<br />
Deliverable D4 – <strong>WP3</strong> passenger 20