Marine Safety in Victoria Report 2007-2008 (PDF, 1.3 MB, 72 pp.)
Marine Safety in Victoria Report 2007-2008 (PDF, 1.3 MB, 72 pp.)
Marine Safety in Victoria Report 2007-2008 (PDF, 1.3 MB, 72 pp.)

Create successful ePaper yourself
Turn your PDF publications into a flip-book with our unique Google optimized e-Paper software.
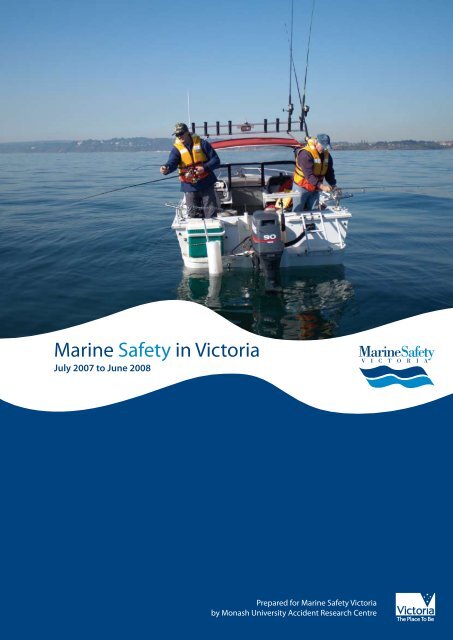
<strong>Mar<strong>in</strong>e</strong> <strong>Safety</strong> <strong>in</strong> <strong>Victoria</strong><br />
July <strong>2007</strong> to June <strong>2008</strong><br />
Prepared for <strong>Mar<strong>in</strong>e</strong> <strong>Safety</strong> <strong>Victoria</strong><br />
by Monash University Accident Research Centre<br />
<strong>Mar<strong>in</strong>e</strong> <strong>Safety</strong> <strong>in</strong> <strong>Victoria</strong>: July <strong>2007</strong> to June <strong>2008</strong><br />
A
© <strong>Mar<strong>in</strong>e</strong> <strong>Safety</strong> <strong>Victoria</strong>, Australia, 2009<br />
Published by <strong>Mar<strong>in</strong>e</strong> <strong>Safety</strong> <strong>Victoria</strong><br />
121 Exhibition Street, Melbourne VIC 3000<br />
This publication is copyright. No part may be reproduced<br />
by any process except <strong>in</strong> accordance with the provisions<br />
of the Copyright Act 1968.
Contents<br />
Summary 6<br />
1. Introduction 11<br />
1.1 Background 12<br />
1.2 Data sources 12<br />
1.2.1 <strong>Mar<strong>in</strong>e</strong> Incident <strong>Report</strong><strong>in</strong>g (MIR) 12<br />
1.2.2 <strong>Victoria</strong>n <strong>in</strong>jury surveillance datasets 13<br />
<strong>1.3</strong> Exposure data 14<br />
2. Structure of the report and def<strong>in</strong>itions 15<br />
2.1 Structure 15<br />
2.2 Def<strong>in</strong>itions 15<br />
3. Results: commercial vessel <strong>in</strong>cidents (<strong>2007</strong>/8) 17<br />
3.1 Incident frequency and trend 17<br />
3.2 ‘Response only’ <strong>in</strong>cidents (n=49) 18<br />
3.2.1 Severity of ‘response only’ commercial <strong>in</strong>cidents 18<br />
3.2.2 Waterway name 18<br />
3.2.3 Major causes (types) of <strong>in</strong>cidents 18<br />
3.2.4 Vessel details 18<br />
3.2.5 Seasonal distribution, weather and water conditions 18<br />
3.2.6 Contributory factors 19<br />
3.3 Serious <strong>in</strong>cidents (n=90) 19<br />
3.3.1 Severity of serious <strong>in</strong>cidents 19<br />
3.3.2 Major causes (types) of <strong>in</strong>cidents 21<br />
3.3.3 Vessel details 21<br />
3.3.4 Vessel occupant details, PFD wear 22<br />
3.3.5 Seasonal distribution 22<br />
3.3.6 Waterway type, location and environmental conditions 23<br />
3.3.7 Contributory factors to ‘serious <strong>in</strong>cidents’ 24<br />
3.4 Hospital-treated commercial boat<strong>in</strong>g-related <strong>in</strong>juries recorded on <strong>in</strong>jury<br />
surveillance databases (2006/7) 25<br />
3.4.1 Hospital admissions (n=4) 26<br />
3.4.2 Hospital emergency department presentations (n=13) 26<br />
4. Results: hire/drive vessel <strong>in</strong>cidents (<strong>2007</strong>/8) 27<br />
4.1 Frequency 27<br />
4.2 Incident severity 27<br />
4.3 Major causes (types) of <strong>in</strong>cidents 27<br />
4.4 Vessel and occupant details 27<br />
4.5 Type of water and environmental conditions 28<br />
4.6 Contributory factors 28
5. Results: recreational vessel <strong>in</strong>cidents (<strong>2007</strong>/8) and hospital-treated<br />
boat<strong>in</strong>g <strong>in</strong>jury (2006/7) 29<br />
5.1 Recreational vessel <strong>in</strong>cidents (<strong>2007</strong>/8) 30<br />
5.2 Response only <strong>in</strong>cidents (n=926) 30<br />
5.2.1 Severity of ‘response only’ <strong>in</strong>cidents 30<br />
5.2.2 Major causes (types) of <strong>in</strong>cidents 30<br />
5.2.3 Vessel details 30<br />
5.2.4 Seasonal distribution 30<br />
5.2.5 Contributory factors 31<br />
5.3 Serious <strong>in</strong>cidents (n=165) 33<br />
5.3.1 Severity of ‘serious <strong>in</strong>cidents’ 33<br />
5.3.2 Major causes (types) of <strong>in</strong>cidents 35<br />
5.3.3 Vessel details 37<br />
5.3.4 Vessel occupant details, PFD wear 38<br />
5.3.5 Seasonal distribution 39<br />
5.3.6 Type of water and environmental conditions 39<br />
5.3.7 Contributory factors to recreational serious <strong>in</strong>cidents 40<br />
5.4 Fatalities and hospital-treated recreational boat<strong>in</strong>g-related <strong>in</strong>juries 2006/7 42<br />
5.4.1 Deaths (n=3) 42<br />
5.4.2 Hospital-treated <strong>in</strong>jury (n=902 cases) 43<br />
5.5 Rank<strong>in</strong>g of recreational boat<strong>in</strong>g-related activities for <strong>in</strong>jury 49<br />
5.5.1 Towed water sports (n=388) 50<br />
5.5.2 Motor boat<strong>in</strong>g and boat<strong>in</strong>g not specified (n=279) 55<br />
5.5.3 Personal Watercraft (PWC)/Jet ski rid<strong>in</strong>g (n=80) 56<br />
5.5.4 Sail<strong>in</strong>g (n=53) 57<br />
5.5.5 W<strong>in</strong>dsurf<strong>in</strong>g and kitesurf<strong>in</strong>g (n=39) 58<br />
5.5.6 Fish<strong>in</strong>g from a boat (n=28) 58<br />
6. Discussion and conclusion 60<br />
7. References 66<br />
<strong>Mar<strong>in</strong>e</strong> <strong>Safety</strong> <strong>in</strong> <strong>Victoria</strong>: July <strong>2007</strong> to June <strong>2008</strong> 3
Figures<br />
Title<br />
Page<br />
Figure 1 Trend <strong>in</strong> commercial vessel <strong>in</strong>cidents by year, <strong>Mar<strong>in</strong>e</strong> Incident Database 1999/2000 to <strong>2007</strong>/8 17<br />
Figure 2 Distribution of commercial vessel <strong>in</strong>cidents by month of <strong>in</strong>cident, <strong>Mar<strong>in</strong>e</strong> Incident <strong>Report</strong><strong>in</strong>g 22<br />
system <strong>2007</strong>/8 (n=139)<br />
Figure 3 Trend <strong>in</strong> hire-drive vessel <strong>in</strong>cidents by year, <strong>Mar<strong>in</strong>e</strong> Incident <strong>Report</strong><strong>in</strong>g system 1999/2000 to 27<br />
<strong>2007</strong>/8<br />
Figure 4 Trend <strong>in</strong> recreational vessel <strong>in</strong>cidents by year, <strong>Mar<strong>in</strong>e</strong> Incident <strong>Report</strong><strong>in</strong>g system, 1999/2000 29<br />
to <strong>2007</strong>/8<br />
Figure 5 Distribution of recreational vessel <strong>in</strong>cidents by month of <strong>in</strong>cident, <strong>Mar<strong>in</strong>e</strong> Incident <strong>Report</strong><strong>in</strong>g 31<br />
system <strong>2007</strong>/8 (n=1,091)<br />
Figure 6 Frequency of recreational vessel ‘serious <strong>in</strong>cidents’ by type of vessel, <strong>Mar<strong>in</strong>e</strong> Incident 37<br />
<strong>Report</strong><strong>in</strong>g system <strong>2007</strong>/8<br />
Figure 7 Trend <strong>in</strong> the frequency and rate (per 100,000 population) of recreational boat<strong>in</strong>g-related 46<br />
hospital admissions by year, <strong>Victoria</strong> 1999/2000 to 2006/<strong>2007</strong><br />
Figure 8 Rate of recreational boat<strong>in</strong>g-related hospital admissions per 100,000 population by age and<br />
gender, <strong>Victoria</strong> July 1, 2006 to June 30, <strong>2007</strong> (n=223)<br />
47<br />
Figure 9 Frequency of recreational boat<strong>in</strong>g-related <strong>in</strong>jury ED presentations (non-admissions) by age<br />
and sex, <strong>Victoria</strong> July 1, 2006 to June 30, <strong>2007</strong> (n=679)<br />
Figure 10 Trend <strong>in</strong> the frequency of hospital-treated towed water sports <strong>in</strong>jury, <strong>Victoria</strong> July 1999 to<br />
June <strong>2007</strong><br />
Figure 11 Hospital-treated towed water sports <strong>in</strong>jury by age group, <strong>Victoria</strong> July 1, 2006 to June 30,<br />
<strong>2007</strong> (n=388)<br />
Figure 12 ED presentations for towed water sports <strong>in</strong>jury by age group, <strong>Victoria</strong> July 1 2006 to June 30,<br />
<strong>2007</strong> (n=288)<br />
Figure 13 Hospital-treated personal watercraft (PWC) <strong>in</strong>jury by age group, <strong>Victoria</strong> July 1, 2006 to June<br />
30, <strong>2007</strong> (n=388)<br />
49<br />
51<br />
52<br />
54<br />
56<br />
4
Tables<br />
Title<br />
Table 1 Commercial vessel ‘serious <strong>in</strong>cidents’ by severity of <strong>in</strong>cident and year, <strong>Mar<strong>in</strong>e</strong> Incident <strong>Report</strong><strong>in</strong>g<br />
system 2006/7 and <strong>2007</strong>/8<br />
Table 2 Commercial vessel ‘serious <strong>in</strong>cidents’ by type (cause) of <strong>in</strong>cident, <strong>Mar<strong>in</strong>e</strong> Incident <strong>Report</strong><strong>in</strong>g<br />
system 2006/7 and <strong>2007</strong>/8<br />
Table 3 Commercial ‘serious <strong>in</strong>cidents’ by environmental conditions, <strong>Mar<strong>in</strong>e</strong> Incident <strong>Report</strong><strong>in</strong>g system,<br />
<strong>2007</strong>/8<br />
Table 4 Factors contribut<strong>in</strong>g to commercial ‘serious <strong>in</strong>cidents’, <strong>Mar<strong>in</strong>e</strong> Incident <strong>Report</strong><strong>in</strong>g system <strong>2007</strong>/8<br />
(n=<strong>72</strong> factors))<br />
Table 5 Factors contribut<strong>in</strong>g to ‘response only’ recreational vessel <strong>in</strong>cidents, <strong>Mar<strong>in</strong>e</strong> Incident <strong>Report</strong><strong>in</strong>g<br />
system <strong>2007</strong>/8 (n=1,170 factors)<br />
Table 6 Recreational vessel ‘serious <strong>in</strong>cidents’ by severity and year, <strong>Mar<strong>in</strong>e</strong> Incident <strong>Report</strong><strong>in</strong>g system<br />
2006/7 and <strong>2007</strong>/8<br />
Table 7 Recreational vessel ‘serious <strong>in</strong>cidents’ by type (cause) of <strong>in</strong>cident, <strong>Mar<strong>in</strong>e</strong> Incident <strong>Report</strong><strong>in</strong>g<br />
system 2006/7 and <strong>2007</strong>/8<br />
Table 8 Recreational vessel ‘serious <strong>in</strong>cidents’ by vessel activity and year, <strong>Mar<strong>in</strong>e</strong> Incident <strong>Report</strong><strong>in</strong>g<br />
system 2006/7 and <strong>2007</strong>/8<br />
Table 9 Recreational vessel ‘serious <strong>in</strong>cidents’ by grouped vessel length and PFD wear, <strong>Mar<strong>in</strong>e</strong> Incident<br />
<strong>Report</strong><strong>in</strong>g system <strong>2007</strong>/8<br />
Table 10 Recreational ‘serious <strong>in</strong>cidents’ by environmental conditions, <strong>Mar<strong>in</strong>e</strong> Incident <strong>Report</strong><strong>in</strong>g system<br />
<strong>2007</strong>/8<br />
Table 11 Factors contribut<strong>in</strong>g to recreational ‘serious <strong>in</strong>cidents’, <strong>Mar<strong>in</strong>e</strong> Incident <strong>Report</strong><strong>in</strong>g system <strong>2007</strong>/8<br />
(n=322 factors)<br />
Table 12 Pattern of hospital-treated recreational boat<strong>in</strong>g <strong>in</strong>jury, <strong>Victoria</strong> July 1, 2006 to June <strong>2007</strong><br />
(n=902 cases)<br />
Table 13 Recreational boat<strong>in</strong>g-related <strong>in</strong>jury admissions by water craft/activity type and length of hospital<br />
stay, <strong>Victoria</strong> July 1, 2006 to June 30, <strong>2007</strong> (n=223)<br />
Table 14 Provisional rank<strong>in</strong>g of boat<strong>in</strong>g-related recreational activities based on frequency of fatal and nonfatal<br />
hospital-treated <strong>in</strong>jury cases, <strong>Victoria</strong> July 1, 2006 to June 30, <strong>2007</strong><br />
Page<br />
19<br />
21<br />
23<br />
25<br />
32<br />
33<br />
36<br />
38<br />
39<br />
40<br />
41<br />
44<br />
48<br />
50<br />
<strong>Mar<strong>in</strong>e</strong> <strong>Safety</strong> <strong>in</strong> <strong>Victoria</strong>: July <strong>2007</strong> to June <strong>2008</strong> 5
Summary<br />
This is the fifth MUARC report on mar<strong>in</strong>e <strong>in</strong>cidents and boat<strong>in</strong>g related deaths and hospital-treated <strong>in</strong>jury<br />
<strong>in</strong> <strong>Victoria</strong>. <strong>Mar<strong>in</strong>e</strong> <strong>in</strong>cident data were sourced from the <strong>Mar<strong>in</strong>e</strong> Incident <strong>Report</strong><strong>in</strong>g System (MIR), deaths<br />
from the National Coroners Information System (NCIS) and hospital admissions and Emergency<br />
Department presentations from hospital datasets held by the <strong>Victoria</strong>n Injury Surveillance Unit at MUARC.<br />
Commercial and recreational vessel <strong>in</strong>cidents recorded on the MIR system<br />
(<strong>2007</strong>/8)<br />
Commercial vessel <strong>in</strong>cidents (<strong>2007</strong>/8)<br />
• There were 139 mar<strong>in</strong>e <strong>in</strong>cidents <strong>in</strong>volv<strong>in</strong>g commercial vessels recorded on MID over the 12-month<br />
period July <strong>2007</strong> to June <strong>2008</strong>, 15 more than were reported <strong>in</strong> the previous year (exclud<strong>in</strong>g false alarm<br />
and non-mar<strong>in</strong>e ‘response only’ <strong>in</strong>cidents <strong>in</strong> both years).<br />
• 49 (35%) of the commercial mar<strong>in</strong>e <strong>in</strong>cidents were classified as ‘response only’, 90 (65%) as<br />
serious <strong>in</strong>cidents.<br />
Response only <strong>in</strong>cidents (n=49)<br />
• Response only <strong>in</strong>cidents cover vessel disablements and persons <strong>in</strong> trouble. Exclud<strong>in</strong>g false alarms and<br />
non-mar<strong>in</strong>e <strong>in</strong>cidents, there were 49 commercial ‘response only’ <strong>in</strong>cidents reported <strong>in</strong> <strong>2007</strong>/8, 15 more<br />
than <strong>in</strong> 2006/7 (n=34).<br />
• Response only <strong>in</strong>cidents peaked <strong>in</strong> Autumn (n=16, 33%), due to a high number of <strong>in</strong>cidents <strong>in</strong> May.<br />
• All were vessel disablements. Most did not result <strong>in</strong> any damage to property or person (n=38, 78%).<br />
Of the 11 <strong>in</strong>cidents that caused damage, one <strong>in</strong>cident caused serious <strong>in</strong>jury, one caused damage<br />
to property and another caused damage to another vessel. In the rema<strong>in</strong><strong>in</strong>g cases the damage was<br />
undef<strong>in</strong>ed.<br />
• Contribut<strong>in</strong>g factors were noted for 47 of the 49 ‘response only’ commercial <strong>in</strong>cidents. Eighty-two<br />
percent of the primary contributory factors noted were material factors (n=44 <strong>in</strong>cidents; either<br />
mach<strong>in</strong>ery or electrical failures), 8% were human factors (n=4; vessel disabled due to lack of fuel or<br />
lack of ma<strong>in</strong>tenance, vessel came adrift, vessel was steered <strong>in</strong>to an object/sand when the operator was<br />
try<strong>in</strong>g to free another vessel that had run aground) and 6% (n=3) were environmental (two due to tidal<br />
and bay conditions and the other to a length of canvas fire hose w<strong>in</strong>d<strong>in</strong>g around the propeller).<br />
Serious <strong>in</strong>cidents (n=90)<br />
• There were 90 commercial <strong>in</strong>cidents categorised as ‘serious <strong>in</strong>cidents’ recorded on the MIR system <strong>in</strong><br />
<strong>2007</strong>/8, the same numbers <strong>in</strong> 2006/7.<br />
• There were no recorded fatalities on the MIR system <strong>in</strong> <strong>2007</strong>/8.<br />
• Over two-thirds (68%) of these ‘serious <strong>in</strong>cidents’ did not result <strong>in</strong> any personal or property damage,<br />
11% resulted <strong>in</strong> serious or m<strong>in</strong>or <strong>in</strong>jury but no damage to vessel or property, 14% resulted <strong>in</strong> vessel loss<br />
or damage without personal <strong>in</strong>jury and 8% resulted <strong>in</strong> damage to property without personal <strong>in</strong>jury.<br />
• Close quarters (52%), ground<strong>in</strong>g (13%) and collisions (12%) were the lead<strong>in</strong>g causes of ‘serious <strong>in</strong>cidents’<br />
• A high proportion of the vessels <strong>in</strong>volved <strong>in</strong> <strong>in</strong>cidents were foreign-owned (n=40, 44%), followed by<br />
passenger vessels (Class One) (n=25, 28%), non-passenger vessels (Class 2) (n=9, 10%) and fish<strong>in</strong>g<br />
vessels (Class 3) (n=9, 10%).<br />
6
• The peak season for serious <strong>in</strong>cidents was Spr<strong>in</strong>g (n=29, 32%) followed by Summer (n=23, 26%).<br />
• Most commercial ‘serious <strong>in</strong>cidents’ occurred <strong>in</strong> enclosed waters (61%), followed by <strong>in</strong>land waters (26%)<br />
and coastal offshore waters (10%). Thirty-three <strong>in</strong>cidents (37%) occurred on Port Phillip Bay, 22 occurred<br />
on the Yarra River (24%).<br />
• Unlike ‘response only’ <strong>in</strong>cidents where material factors were the major contributors, serious <strong>in</strong>cidents<br />
were mostly caused by human factors (60% of factors, mostly errors of judgement), followed by<br />
environmental factors (22%, mostly w<strong>in</strong>d or sea state) then equipment/material factors (18%, mostly<br />
hull failure and electrical failure).<br />
Hire-drive vessel <strong>in</strong>cidents (<strong>2007</strong>/8)<br />
• There were 8 mar<strong>in</strong>e <strong>in</strong>cidents <strong>in</strong>volv<strong>in</strong>g a hire/drive vessel recorded on the MIR for the 12-month<br />
period July <strong>2007</strong> to June <strong>2008</strong><br />
• There was no damage <strong>in</strong> 6 hire/drive <strong>in</strong>cidents (75%), damage to property only <strong>in</strong> one <strong>in</strong>cident (12.5%)<br />
and other vessel damage <strong>in</strong> one <strong>in</strong>cident (12.5%).<br />
• Five <strong>in</strong>cidents were due to ground<strong>in</strong>g-un<strong>in</strong>tentional (63%), one was due to a disablement (12.5%), one<br />
was an onboard <strong>in</strong>cident-crush<strong>in</strong>g/p<strong>in</strong>ch<strong>in</strong>g (12.5%) and <strong>in</strong> the other case the type of <strong>in</strong>cident was<br />
undef<strong>in</strong>ed.<br />
• In three <strong>in</strong>cidents the primary contributory factor was environmental (w<strong>in</strong>d/sea state) with human<br />
factors also contribut<strong>in</strong>g (<strong>in</strong>experience, navigational error and <strong>in</strong>secure moor<strong>in</strong>g). In the other<br />
five cases, the primary contributors were human factors (navigational error, <strong>in</strong>experience, lack of<br />
boat ma<strong>in</strong>tenance and ‘other’) with material factors mak<strong>in</strong>g a secondary contribution <strong>in</strong> two cases<br />
(equipment-mach<strong>in</strong>ery failure and ‘other’ material factor).<br />
Recreational vessel <strong>in</strong>cidents (<strong>2007</strong>/8)<br />
• There were 1,091 recorded recreational vessel <strong>in</strong>cidents on the MIR <strong>in</strong> <strong>2007</strong>/8, up from 918 <strong>in</strong> 2006/7.<br />
These figures exclude false alarms and non-mar<strong>in</strong>e ‘response only’ <strong>in</strong>cidents. The 19% <strong>in</strong>crease is<br />
possibly due to better report<strong>in</strong>g.<br />
• 85% of the recreational <strong>in</strong>cidents (n=926) were ‘response only’ <strong>in</strong>cidents (vessel disablements and<br />
persons <strong>in</strong> trouble) and 15% (n=165) were ‘serious <strong>in</strong>cidents’.<br />
Response only <strong>in</strong>cidents (n=926)<br />
• There were 926 response only <strong>in</strong>cidents recorded on the MIR system <strong>in</strong> <strong>2007</strong>/8, an <strong>in</strong>crease of 18% on<br />
the previous year (n=782).<br />
• N<strong>in</strong>ety-six percent (n=886) of ‘response only’ <strong>in</strong>cidents did not result <strong>in</strong> any damage to property or<br />
person, 3% (n=26) resulted <strong>in</strong> property damage only, 1% (n=10) resulted <strong>in</strong> other vessel damage and<br />
there were two vessels lost (0.2%).<br />
• 98% (n=904) were disablements and 2% (n=22) were persons <strong>in</strong> trouble<br />
• Over one-third of <strong>in</strong>cidents were each related to open boats (40%, n=368) and half-cab<strong>in</strong> cruisers (38%,<br />
n=352), another 12% (n=114) were full-cab<strong>in</strong> cruisers, 4% (n=32) were yachts (keel boats), 3% (n=23)<br />
were PWCs and 1% each <strong>in</strong>volved trailer sailers (n=12) and off-the-beach yachts/catamarans (n=6). The<br />
rema<strong>in</strong><strong>in</strong>g 18 <strong>in</strong>cidents <strong>in</strong>volved kayaks (n=4), skiboats (3), w<strong>in</strong>dsurfers (4), kite (4), rafts (2), tenders (2),<br />
and one houseboat, row<strong>in</strong>g boat and canoe.<br />
<strong>Mar<strong>in</strong>e</strong> <strong>Safety</strong> <strong>in</strong> <strong>Victoria</strong>: July <strong>2007</strong> to June <strong>2008</strong> 7
• Nearly half (48%) of vessels were 4.8-8m <strong>in</strong> length, 30% were 0-4.8m <strong>in</strong> length, 4% were 8-12m <strong>in</strong> length<br />
and 2% were greater than 12m <strong>in</strong> length.<br />
• Half the <strong>in</strong>cidents occurred <strong>in</strong> the 3-month period November to January (late Spr<strong>in</strong>g and Summer);<br />
<strong>in</strong>cidents were lowest <strong>in</strong> W<strong>in</strong>ter (9%).<br />
• In all, there were 1,170 recorded contributory factors to response-only recreational vessel <strong>in</strong>cidents.<br />
Material factors made the greatest contribution (61% of factors, mostly mach<strong>in</strong>ery and electrical<br />
equipment failures), followed by human factors (35%, mostly lack of ma<strong>in</strong>tenance and lack of fuel), then<br />
environmental factors (4%, mostly unfavourable w<strong>in</strong>d or sea conditions).<br />
Serious <strong>in</strong>cidents (n=165)<br />
• There were 165 serious <strong>in</strong>cidents recorded on the MIR system <strong>in</strong> <strong>2007</strong>/8, an <strong>in</strong>crease of 26% on the<br />
previous year (n=131).<br />
• There were 9 deaths from 7 serious <strong>in</strong>cidents recorded on the MIR system <strong>in</strong> <strong>2007</strong>/8 compared with 5<br />
deaths <strong>in</strong> 2006/7 (<strong>in</strong>clud<strong>in</strong>g two fatalities that were recorded under response only <strong>in</strong>cidents). Deaths <strong>in</strong><br />
<strong>2007</strong>/8 were caused by drown<strong>in</strong>g (3), impact <strong>in</strong>juries related to collisions (4) and burns (2)<br />
• N<strong>in</strong>e serious <strong>in</strong>jury cases were reported on the MIR system <strong>in</strong> <strong>2007</strong>/8, one more than <strong>in</strong> 2006/7,<br />
compared with 20 <strong>in</strong> 2005/6.<br />
• Ground<strong>in</strong>g (36%), capsiz<strong>in</strong>g (18%) and collision (13%) were the lead<strong>in</strong>g causes of ‘serious <strong>in</strong>cidents’.<br />
• More than one-quarter of ‘serious <strong>in</strong>cidents’ <strong>in</strong>volved open boats (26%), followed by full cab<strong>in</strong> cruisers<br />
(22%), half cab<strong>in</strong> cruisers (19%), yachts – keel boats (12%) and PWC (8%).<br />
• Twenty-two percent of vessels were 4.8m or less <strong>in</strong> length, 38% were 4.8-8.0m., 15% were 8-12m. and<br />
6% were longer than 12m.<br />
• Over one third of vessels (35%) were cruis<strong>in</strong>g when the ‘serious <strong>in</strong>cident’ occurred. Incidents also<br />
commonly occurred <strong>in</strong> fish<strong>in</strong>g (19%), when the vessel was at anchor (13%) and dur<strong>in</strong>g sail<strong>in</strong>g<br />
(n=20, 15%).<br />
• Overall, 45% of recreational vessel occupants <strong>in</strong>volved <strong>in</strong> serious <strong>in</strong>cidents were recorded as wear<strong>in</strong>g a<br />
PFD, compared with 62% <strong>in</strong> 2006/7. The wear rate for persons on vessels up to and <strong>in</strong>clud<strong>in</strong>g 4.8m <strong>in</strong><br />
length was 58% (26/45), for vessels over 4.8m. <strong>in</strong> length the wear rate was 45% (69/152) and for vessels<br />
of an unspecified length the wear rate was 28% (9/32).<br />
• The frequency of serious <strong>in</strong>cidents was higher <strong>in</strong> December (14.5%), January (17%) and March (17%).<br />
There were few <strong>in</strong>cidents <strong>in</strong> the 4-month period May to August (12% <strong>in</strong> all).<br />
• Recreational ‘serious <strong>in</strong>cidents’ mostly occurred <strong>in</strong> enclosed waters (73%), followed by coastal offshore<br />
waters (12%) and <strong>in</strong>land waters (10%). Thirty-seven percent of reported ‘serious <strong>in</strong>cidents’ occurred on<br />
Port Phillip (n=61). Other common locations were Gi<strong>pp</strong>sland Lakes (n=28, 17%), Bass Strait (n=19, 11%)<br />
and Western Port (n=18, 11%).<br />
• Most ‘serious <strong>in</strong>cidents’ occurred <strong>in</strong> clear weather with good visibility and w<strong>in</strong>d speeds up to 8 knots.<br />
High proportions of swamp<strong>in</strong>g (62%), capsiz<strong>in</strong>g (50%) and vessel loss (60%) <strong>in</strong>cidents occurred <strong>in</strong><br />
cho<strong>pp</strong>y, rough or very rough water conditions.<br />
8
• Human factors made the greatest contribution to recreational vessel serious <strong>in</strong>cident (65% of factors,<br />
most commonly errors of judgement, <strong>in</strong>experience, failure to keep proper lookout and navigational<br />
errors). Environmental factors (19%, mostly w<strong>in</strong>d or sea state, tidal and bar conditions) and material<br />
factors (17%, mostly mach<strong>in</strong>ery, <strong>in</strong>adequate stability and electrical equipment failure) were less<br />
commonly implicated.<br />
Fatalities and hospital-treated recreational boat<strong>in</strong>g-related <strong>in</strong>juries recorded<br />
on <strong>in</strong>jury surveillance databases (2006/7)<br />
Overall<br />
• There were three boat<strong>in</strong>g-related drown<strong>in</strong>g fatalities recorded on the National Coroners Information<br />
System (NCIS) and 902 hospital-treated recreational boat<strong>in</strong>g <strong>in</strong>jury cases (223 admissions and 679 ED<br />
presentations, non admissions) recorded on hospital <strong>in</strong>jury surveillance databases over the period July<br />
2006 to June <strong>2007</strong>.<br />
Deaths<br />
• One fatality was a fisherman who drowned after fall<strong>in</strong>g <strong>in</strong>to the water from a powered half-cab<strong>in</strong> vessel<br />
when putt<strong>in</strong>g out craypots. He was not wear<strong>in</strong>g a PFD. The other was a fisherman who was found<br />
dead <strong>in</strong> the water with his life jacket tangled around his wrist. The only recorded contributory factor to<br />
the fatal <strong>in</strong>cidents was non-wear<strong>in</strong>g of PFD.<br />
Hospital-treated <strong>in</strong>jury (n=902 cases)<br />
• There were 223 hospital admissions and 679 ED presentations (non-admissions) for boat<strong>in</strong>g-related<br />
sport and recreational <strong>in</strong>juries recorded on the VAED and the VEMD respectively.<br />
• Males were grossly over-represented <strong>in</strong> both admissions and ED presentations, account<strong>in</strong>g for 74% of<br />
all hospital-treated recreational boat<strong>in</strong>g <strong>in</strong>jury cases.<br />
• Young adults aged 15-29 years, closely followed by adults aged 30-44 years, were more likely than<br />
other 15-year age groups to be admitted to hospital and to present to ED for boat<strong>in</strong>g-related <strong>in</strong>jury.<br />
Age groups 15-29 and 30-34 years accounted for 35% and 29% of admissions and 41% and 26% of ED<br />
presentations, respectively, for boat<strong>in</strong>g-related <strong>in</strong>jury <strong>in</strong> 2006/7.<br />
• Hospital-treated <strong>in</strong>jury cases mostly occurred <strong>in</strong> water ski<strong>in</strong>g and other towed water sports (41% of<br />
admissions and 44% ED presentations), general boat<strong>in</strong>g (15% of admissions and 36% ED presentations)<br />
and PWC rid<strong>in</strong>g (13% of admissions and 8% of ED presentations). Waterski<strong>in</strong>g and wakeboard<strong>in</strong>g<br />
together accounted for 95% of towed water sport admissions and 81% of towed water sport ED<br />
presentations.<br />
• The major specific causes of <strong>in</strong>jury were: falls (24% of admissions and 32% of ED presentations) and hit/<br />
struck/crush <strong>in</strong>juries <strong>in</strong>volv<strong>in</strong>g objects (13% of admissions and 32% of ED presentations). There were 9<br />
non-fatal drown<strong>in</strong>g/submersion hospital-treated cases <strong>in</strong> 2006/7 compared with 22 <strong>in</strong> 2005/6.<br />
• The lower extremity was the most commonly <strong>in</strong>jured body site for both admissions and presentations,<br />
account<strong>in</strong>g for 32% of all hospital treated <strong>in</strong>jury, followed by the u<strong>pp</strong>er extremity (25%) and head/face/<br />
neck (22%).<br />
<strong>Mar<strong>in</strong>e</strong> <strong>Safety</strong> <strong>in</strong> <strong>Victoria</strong>: July <strong>2007</strong> to June <strong>2008</strong> 9
• Forty-four percent of admissions were fracture cases, most commonly knee and lower leg fractures<br />
(29% of fracture cases). Dislocations/spra<strong>in</strong>s/stra<strong>in</strong>s were the next most frequent type of <strong>in</strong>jury (13%,<br />
mostly shoulder dislocations). Among ED presentations, open wounds (26%) and spra<strong>in</strong>s/stra<strong>in</strong>s (21%)<br />
were common <strong>in</strong>juries.<br />
The report also <strong>in</strong>cludes an analysis of deaths and hospital-treated <strong>in</strong>jury <strong>in</strong> the major water sports. The<br />
rank<strong>in</strong>g of water sports for hospital-treated <strong>in</strong>jury <strong>in</strong> 2006/7 were (from highest to lowest): water ski<strong>in</strong>g<br />
and other towed water sports (n=388 hospital-treated <strong>in</strong>jury cases); motor boat<strong>in</strong>g/unspecified boat<strong>in</strong>g<br />
(n=279); personal water craft (PWC) rid<strong>in</strong>g (n=80); sail<strong>in</strong>g (n=53); w<strong>in</strong>d/kite surf<strong>in</strong>g (n=39); and fish<strong>in</strong>g<br />
(n=28). All <strong>in</strong>jury case counts for water sports are likely underestimates due to data cod<strong>in</strong>g and quality<br />
issues. Recommendations for prevention and data quality issues are highlighted <strong>in</strong> the discussion section.<br />
10
1. Introduction<br />
This is the fifth report to the MSV on mar<strong>in</strong>e <strong>in</strong>cidents and boat<strong>in</strong>g related deaths and hospital-treated<br />
<strong>in</strong>jury (admissions and Emergency Department presentations). <strong>Mar<strong>in</strong>e</strong> <strong>in</strong>cident data <strong>in</strong>cluded <strong>in</strong> this<br />
report cover the 12-month period July <strong>2007</strong> to June <strong>2008</strong>, whereas fatality and hospital-treated <strong>in</strong>jury data<br />
are for the previous year (2006/07).<br />
Data on mar<strong>in</strong>e <strong>in</strong>cidents were drawn from the <strong>Mar<strong>in</strong>e</strong> Incident <strong>Report</strong><strong>in</strong>g (MIR) System formerly known<br />
as the <strong>Mar<strong>in</strong>e</strong> Incident Database (MID), the third year of data from the upgraded system. Boat<strong>in</strong>g-related<br />
fatality data were sourced from the National Coroners Information System (NCIS). Hospital admissions and<br />
Emergency Department presentations data for boat<strong>in</strong>g-related <strong>in</strong>jury were extracted from the <strong>Victoria</strong>n<br />
Admitted Episodes Dataset (VAED) and the <strong>Victoria</strong>n Emergency M<strong>in</strong>imum Dataset (VEMD). The VAED<br />
covers all public and private hospitals <strong>in</strong> <strong>Victoria</strong>. The VEMD covered 38 <strong>Victoria</strong>n hospital Emergency<br />
Departments <strong>in</strong> 2006/07.<br />
1.1 Background<br />
<strong>Mar<strong>in</strong>e</strong> <strong>Safety</strong> <strong>Victoria</strong> (MSV) is the State’s mar<strong>in</strong>e safety agency and is responsible for the adm<strong>in</strong>istration of<br />
the <strong>Mar<strong>in</strong>e</strong> Act 1988. Its objectives are to:<br />
• facilitate efficient and safe operation of vessels;<br />
• facilitate navigation safety;<br />
• improve community awareness of boat<strong>in</strong>g safety;<br />
• improve and simplify vessel registration and operat<strong>in</strong>g requirements; and<br />
• ensure an effective response to oil pollution <strong>in</strong>cidents.<br />
The responsibilities vested <strong>in</strong> MSV are as follows:<br />
• Sett<strong>in</strong>g standards for the design, construction and equipment of commercial vessels to ma<strong>in</strong>ta<strong>in</strong><br />
structural <strong>in</strong>tegrity and seaworth<strong>in</strong>ess<br />
• Sett<strong>in</strong>g standards related to recreational vessels and for operat<strong>in</strong>g and zon<strong>in</strong>g rules<br />
• Licens<strong>in</strong>g of pilots and harbour masters and determ<strong>in</strong><strong>in</strong>g standards for the tra<strong>in</strong><strong>in</strong>g of pilots, pilot<br />
exempt masters and harbour masters<br />
• Determ<strong>in</strong><strong>in</strong>g standards and procedures for navigation and maritime safety on State waters<br />
• Develop<strong>in</strong>g a<strong>pp</strong>ropriate standards for the provision and ma<strong>in</strong>tenance of navigational aids for<br />
State waters<br />
• Develop<strong>in</strong>g a<strong>pp</strong>ropriate standards for dredg<strong>in</strong>g and ma<strong>in</strong>tenance of channels<br />
• Enforc<strong>in</strong>g and monitor<strong>in</strong>g compliance with prescribed standards<br />
• Develop<strong>in</strong>g, review<strong>in</strong>g, coord<strong>in</strong>at<strong>in</strong>g and manag<strong>in</strong>g the <strong>Victoria</strong>n <strong>Mar<strong>in</strong>e</strong> Pollution Cont<strong>in</strong>gency Plan<br />
• Provid<strong>in</strong>g authoritative advice, commission<strong>in</strong>g research and promot<strong>in</strong>g education and tra<strong>in</strong><strong>in</strong>g <strong>in</strong><br />
mar<strong>in</strong>e safety matters<br />
<strong>Mar<strong>in</strong>e</strong> <strong>Safety</strong> <strong>in</strong> <strong>Victoria</strong>: July <strong>2007</strong> to June <strong>2008</strong> 11
1.2 Data sources<br />
1.2.1 <strong>Mar<strong>in</strong>e</strong> Incident <strong>Report</strong><strong>in</strong>g (MIR)<br />
Incident reports are made <strong>in</strong> accordance with Section 65 (cc) of the <strong>Mar<strong>in</strong>e</strong> Act 1988. This report covers<br />
data on all mar<strong>in</strong>e <strong>in</strong>cidents recorded us<strong>in</strong>g the <strong>Mar<strong>in</strong>e</strong> Incident <strong>Report</strong><strong>in</strong>g (MIR) process from July 1, <strong>2007</strong><br />
to June 30, <strong>2008</strong>. The analyses are based on fiscal years to ensure that <strong>in</strong>cidents recorded <strong>in</strong> each summer<br />
boat<strong>in</strong>g season are counted <strong>in</strong> a s<strong>in</strong>gle report<strong>in</strong>g year.<br />
The data recorded us<strong>in</strong>g the MIR system conforms to the nationally agreed dataset established by the<br />
National <strong>Mar<strong>in</strong>e</strong> <strong>Safety</strong> Committee <strong>in</strong> 1998. As def<strong>in</strong>ed by the National <strong>Mar<strong>in</strong>e</strong> <strong>Safety</strong> Data Collection<br />
Reference Manual 1998, a mar<strong>in</strong>e <strong>in</strong>cident is an ‘event caus<strong>in</strong>g or <strong>in</strong>volv<strong>in</strong>g any of the follow<strong>in</strong>g:<br />
• death of, or serious <strong>in</strong>jury to, any person on board a vessel, or caused by a vessel;<br />
• loss of a person from a vessel;<br />
• abandonment, loss or presumed loss of a vessel;<br />
• collision of a vessel with another vessel or an object;<br />
• ground<strong>in</strong>g, s<strong>in</strong>k<strong>in</strong>g, flood<strong>in</strong>g or capsiz<strong>in</strong>g of a vessel;<br />
• fire or explosion on board a vessel; or<br />
• structural failure of a vessel.<br />
It is important to note that <strong>in</strong>cident reports are generated only when an <strong>in</strong>cident is notified to the Water<br />
Police or to another designated emergency response organisation. If outside assistance is not required<br />
then there is no legal requirement to report the <strong>in</strong>cident. Therefore, many mar<strong>in</strong>e <strong>in</strong>cidents are unlikely to<br />
be reported and recorded us<strong>in</strong>g the MIR process. Examples of <strong>in</strong>cidents that are not usually reported are:<br />
• <strong>in</strong>cidents at registered yacht club events where rescues are performed by the yacht club itself;<br />
• <strong>in</strong>cidents where a pass<strong>in</strong>g (usually recreational) vessel has provided assistance; and<br />
• some categories of recreational <strong>in</strong>cidents (e.g. waterski<strong>in</strong>g <strong>in</strong>cidents) where the vessel occupants<br />
provide direct assistance.<br />
Some reported <strong>in</strong>cidents that occur <strong>in</strong> a mar<strong>in</strong>e sett<strong>in</strong>g are out of scope and are therefore excluded from<br />
the MIR process such as <strong>in</strong>cidents <strong>in</strong>volv<strong>in</strong>g:<br />
• swimmers <strong>in</strong> distress (except ‘swim to shores’ from a mar<strong>in</strong>e vessel);<br />
• suicides; and<br />
• surf board and surf ski riders.<br />
The MIR process divides <strong>in</strong>cidents <strong>in</strong>to two categories: ‘response only’ <strong>in</strong>cidents and ‘serious’ <strong>in</strong>cidents.<br />
‘Serious’ <strong>in</strong>cidents conform to the def<strong>in</strong>ition of a mar<strong>in</strong>e <strong>in</strong>cident <strong>in</strong> the national reference manual<br />
and <strong>in</strong>clude:<br />
• Incidents result<strong>in</strong>g <strong>in</strong> hospital treatment (recently expanded to <strong>in</strong>clude emergency department<br />
presentations <strong>in</strong> <strong>Victoria</strong>)<br />
• Collision<br />
12
• Ground<strong>in</strong>g<br />
• Capsiz<strong>in</strong>g<br />
• S<strong>in</strong>k<strong>in</strong>g<br />
• Flood<strong>in</strong>g<br />
• Loss/presumed loss of vessel<br />
• Loss of stability<br />
• Fire<br />
• Explosion<br />
• Person overboard<br />
• Onboard <strong>in</strong>cident<br />
• Other personal <strong>in</strong>jury<br />
• Close quarters<br />
‘Response only’ <strong>in</strong>cidents are <strong>in</strong>cidents that generate an emergency response and are covered by the MIR<br />
process but do not conform to the def<strong>in</strong>ition of a mar<strong>in</strong>e <strong>in</strong>cident <strong>in</strong> the national reference manual. A<br />
more restricted def<strong>in</strong>ition of ‘response only’ <strong>in</strong>cidents was adopted for this report (see section 2.2) that only<br />
<strong>in</strong>cludes:<br />
• Vessel disablements; and<br />
• Persons <strong>in</strong> trouble.<br />
Because the MIR system is limited to <strong>in</strong>cidents requir<strong>in</strong>g emergency response, other <strong>Victoria</strong>n <strong>in</strong>jury<br />
surveillance datasets were <strong>in</strong>terrogated to identify additional boat<strong>in</strong>g-related <strong>in</strong>juries.<br />
1.2.2 <strong>Victoria</strong>n <strong>in</strong>jury surveillance datasets<br />
In the <strong>in</strong>jury surveillance field the term ‘boat<strong>in</strong>g-related <strong>in</strong>jury’ is used for <strong>in</strong>juries <strong>in</strong>volv<strong>in</strong>g water craft<br />
that occur <strong>in</strong> the mar<strong>in</strong>e sett<strong>in</strong>g. This term is used <strong>in</strong> preference to ‘mar<strong>in</strong>e <strong>in</strong>cident’ as <strong>in</strong>juries associated<br />
with mar<strong>in</strong>e animals have also been classified as ‘mar<strong>in</strong>e <strong>in</strong>cidents’ <strong>in</strong> reports prepared by MUARC (Ashby<br />
and Cassell, 2004). For consistency ‘mar<strong>in</strong>e <strong>in</strong>cident’ will be used when referr<strong>in</strong>g to cases captured by<br />
the MIR system, whereas boat<strong>in</strong>g-related <strong>in</strong>jury will be used when referr<strong>in</strong>g to cases <strong>in</strong>cluded <strong>in</strong> <strong>in</strong>jury<br />
surveillance datasets.<br />
1.2.2.1 <strong>Victoria</strong>n coronial data<br />
Data on fatal boat<strong>in</strong>g-related <strong>in</strong>cidents <strong>in</strong>vestigated by the <strong>Victoria</strong>n Coroner with<strong>in</strong> the period July 1, 2005<br />
to June 30, 2006 were sourced from the <strong>Victoria</strong>n office of the National Coroners Information System.<br />
1.2.2.2 Hospital admissions data<br />
Hospital admissions data for 2006/7 were extracted from the <strong>Victoria</strong>n Admitted Episodes Dataset (VAED).<br />
The VAED covers all <strong>Victoria</strong>n hospitals, both public and private. VAED data are classified us<strong>in</strong>g the World<br />
Health Organization (WHO) International Classification of Diseases (ICD) cod<strong>in</strong>g system. Data for the study<br />
period (July 1, 2006 to June 30, <strong>2007</strong>) are coded to ICD version 10, Australian Modification (AM). This year<br />
<strong>Mar<strong>in</strong>e</strong> <strong>Safety</strong> <strong>in</strong> <strong>Victoria</strong>: July <strong>2007</strong> to June <strong>2008</strong> 13
of data is coded us<strong>in</strong>g the fourth AM edition that <strong>in</strong>cludes detailed activity codes for sport and recreational<br />
activities <strong>in</strong>clud<strong>in</strong>g a list of codes for boat<strong>in</strong>g sports and adventure sports. Deaths recorded on VAED were<br />
excluded to avoid over count<strong>in</strong>g of fatalities.<br />
1.2.2.3 Emergency department presentation data<br />
In 2006/7 the <strong>Victoria</strong>n Emergency M<strong>in</strong>imum Dataset (VEMD) captured presentations to 38 hospital<br />
Emergency Departments (ED) represent<strong>in</strong>g all <strong>Victoria</strong>n public hospitals with a 24-hour ED service. ED<br />
presentations for <strong>in</strong>jury to private hospitals and public hospitals with limited provision of ED services<br />
(mostly small metropolitan and rural hospitals) are not captured on the VEMD.<br />
There are no codes to identify boat<strong>in</strong>g-related <strong>in</strong>jury ED presentations on the VEMD, so case narratives<br />
(descriptions) were searched to identify specific boat<strong>in</strong>g-related <strong>in</strong>jury cases. Keywords used <strong>in</strong> the search<br />
<strong>in</strong>cluded: biscuit, boat, canoe, catamaran, d<strong>in</strong>ghy, jet ski, kayak, kitesurf, kneeboard, parasail, PWC, sail,<br />
raft, row<strong>in</strong>g, runabout, t<strong>in</strong>ny, tube, wakeboard, waterski, w<strong>in</strong>dsurf and yacht (and spell<strong>in</strong>g variations of<br />
these terms).<br />
Injury cases related to aquatic activities that are out of scope for MSV were excluded such as <strong>in</strong>juries that<br />
occurred dur<strong>in</strong>g body and board surf<strong>in</strong>g, surf ski rid<strong>in</strong>g, scuba div<strong>in</strong>g, snorkell<strong>in</strong>g, and swimm<strong>in</strong>g (except<br />
swim to shore from a boat). Injury cases that occurred <strong>in</strong> boat sheds or when a person was work<strong>in</strong>g/<br />
repair<strong>in</strong>g a boat or boat build<strong>in</strong>g (model and otherwise) and non-specific ski<strong>in</strong>g <strong>in</strong>jury cases that occurred<br />
dur<strong>in</strong>g the official snow ski<strong>in</strong>g season (June to September) were also excluded.<br />
Deaths <strong>in</strong> the ED and cases that were subsequently admitted to hospital were excluded to avoid over<br />
count<strong>in</strong>g of cases. However, the case narrative data for hospital admissions recorded on the VEMD were<br />
analysed to provide additional <strong>in</strong>formation on the circumstances of the <strong>in</strong>jury, as the VAED conta<strong>in</strong>s no<br />
case descriptions (narratives). Boat<strong>in</strong>g-related ED presentations are underestimated <strong>in</strong> this report because<br />
the quality of case narrative data varies across participat<strong>in</strong>g hospitals.<br />
<strong>1.3</strong> Exposure data<br />
In study<strong>in</strong>g risk it is critical to know the level of relevant activity (or exposure to risk). For example, two<br />
deaths for every 1,000 hours of exposure to recreational boat<strong>in</strong>g reflect a better safety system than two<br />
deaths for every 500 hours of exposure. Unfortunately, there is almost no available ‘time at risk’ <strong>in</strong>formation<br />
on which to estimate the relative risk of <strong>in</strong>jury <strong>in</strong> the different types of mar<strong>in</strong>e activities, for example<br />
personal watercraft rid<strong>in</strong>g versus water ski<strong>in</strong>g.<br />
Some jurisdictions report mar<strong>in</strong>e <strong>in</strong>cidents per registered vessel as a substitute for exposure (usage)<br />
data, follow<strong>in</strong>g the precedent set <strong>in</strong> the road safety field. For recreational vessels however, usage is only<br />
<strong>in</strong>directly related to ownership. Other jurisdictions report <strong>in</strong>cidents per participant. Because of the<br />
unavailability of <strong>Victoria</strong>n boat<strong>in</strong>g participation and exposure data, population data were used to form the<br />
denom<strong>in</strong>ator <strong>in</strong> this study.<br />
Although frequency data (as reported here) are useful for priority sett<strong>in</strong>g, they are sub-optimal for plann<strong>in</strong>g<br />
and evaluation of prevention programs.<br />
14
2. Structure of the report and def<strong>in</strong>itions<br />
2.1 Structure<br />
Cases extracted from the four datasets are classified and reported accord<strong>in</strong>g to the class of vessel <strong>in</strong>volved<br />
<strong>in</strong> the <strong>in</strong>cident: commercial, hire drive and recreational. Each <strong>in</strong>cident is allocated to only one category. If<br />
two classes of vessel are <strong>in</strong>volved <strong>in</strong> the one <strong>in</strong>cident then the <strong>in</strong>cident is classified accord<strong>in</strong>g to the ‘higher’<br />
category of vessel <strong>in</strong>volved, with commercial vessels ranked above hire drive, then recreational vessels.<br />
With<strong>in</strong> these three broad categories both non-<strong>in</strong>jury (‘serious’ and ‘response only’ <strong>in</strong>cidents) and <strong>in</strong>jury (fatal<br />
and non-fatal) <strong>in</strong>cidents are reported.<br />
2.2 Def<strong>in</strong>itions<br />
Commercial vessel<br />
A commercial vessel is any vessel, other than one under the control of the Department of Defence, which<br />
is operated <strong>in</strong> connection with a commercial transaction of any k<strong>in</strong>d <strong>in</strong>clud<strong>in</strong>g operation as a bus<strong>in</strong>ess,<br />
service, for profit or research.<br />
It is important to note that responsibility for large commercial vessels (and vessel safety) rest primarily with<br />
the Commonwealth. The jurisdiction of MSV for commercial vessel safety matters is conf<strong>in</strong>ed to <strong>Victoria</strong>n<br />
registered vessels such as commercial fish<strong>in</strong>g vessels, small ferries and other passenger vessels and the like.<br />
Hire Drive vessel<br />
A hire drive vessel is any boat or vessel that is let for hire or reward or for any other consideration <strong>in</strong>clud<strong>in</strong>g<br />
vessels provided <strong>in</strong> conjunction with holiday establishments or hotels for the use of guests or tenants and<br />
which the hirer uses solely for pleasure.<br />
Recreational vessel<br />
Recreational vessels are those used solely for the purpose of recreational or sport<strong>in</strong>g activities and not<br />
used for hire or reward.<br />
Response only <strong>in</strong>cidents<br />
‘Response only’ <strong>in</strong>cidents are <strong>in</strong>cidents covered by the MIR system but not covered by the def<strong>in</strong>ition of a<br />
‘mar<strong>in</strong>e <strong>in</strong>cident’ <strong>in</strong> the national reference manual. They <strong>in</strong>clude:<br />
• disablement of vessel i.e. when a vessel has broken down or been disabled<br />
• persons <strong>in</strong> trouble i.e. no vessel was <strong>in</strong>volved but activity still ha<strong>pp</strong>ened <strong>in</strong> the water e.g., person on<br />
body board has been swept out to sea<br />
False alarms (<strong>in</strong>cident is a false alarm but still be responded to) and non-mar<strong>in</strong>e <strong>in</strong>cidents (no vessel was<br />
<strong>in</strong>volved and activity did not ha<strong>pp</strong>en <strong>in</strong> the water e.g. rock fisherman tra<strong>pp</strong>ed on rocks) were not <strong>in</strong>cluded<br />
<strong>in</strong> counts <strong>in</strong> <strong>2007</strong>/8 and were removed from the 2005/6 and 2006/7 counts for trend analysis and when<br />
data for <strong>2007</strong>/8 were be<strong>in</strong>g compared to data for 2006/7.<br />
Serious <strong>in</strong>cidents<br />
Serious <strong>in</strong>cidents conform to the def<strong>in</strong>ition of a ‘mar<strong>in</strong>e <strong>in</strong>cident’ <strong>in</strong> the national reference manual<br />
and <strong>in</strong>clude <strong>in</strong>cidents result<strong>in</strong>g <strong>in</strong> hospital admission; and vessel-related <strong>in</strong>cidents <strong>in</strong>volv<strong>in</strong>g collision;<br />
ground<strong>in</strong>g; capsiz<strong>in</strong>g; s<strong>in</strong>k<strong>in</strong>g; swamp<strong>in</strong>g; flood<strong>in</strong>g; loss or presumed loss of vessel; loss of stability; fire;<br />
explosion; person overboard; onboard <strong>in</strong>cident; other person <strong>in</strong>jury; and close quarters.<br />
<strong>Mar<strong>in</strong>e</strong> <strong>Safety</strong> <strong>in</strong> <strong>Victoria</strong>: July <strong>2007</strong> to June <strong>2008</strong> 15
MSV has expanded this def<strong>in</strong>ition to <strong>in</strong>clude ED presentations.<br />
Fatality<br />
A fatality is an <strong>in</strong>jury death recorded on the MIR system or <strong>in</strong> <strong>Victoria</strong>n coronial records.<br />
Hospital-treated <strong>in</strong>jury<br />
Hospital-treated <strong>in</strong>jury is the collective term for hospital admissions and emergency department<br />
presentations due to <strong>in</strong>jury.<br />
Hospital admission<br />
A hospital admission is any <strong>in</strong>jury case admitted to a hospital ward, <strong>in</strong>clud<strong>in</strong>g short stay observation ward,<br />
as an <strong>in</strong>patient for treatment/care.<br />
Emergency Department (ED) presentation<br />
An ED presentation is an <strong>in</strong>jury case present<strong>in</strong>g to an emergency department for treatment and<br />
discharged with<strong>in</strong> four hours from the time patient management commences without admission to a<br />
ward, <strong>in</strong>clud<strong>in</strong>g a short stay observation ward.<br />
16
3. Results: commercial vessel <strong>in</strong>cidents<br />
(<strong>2007</strong>/8)<br />
3.1 Incident frequency and trend<br />
There were 139 mar<strong>in</strong>e <strong>in</strong>cidents <strong>in</strong>volv<strong>in</strong>g commercial vessels recorded on MIR system over the<br />
12-month period July 1, <strong>2007</strong> to June 30, <strong>2008</strong>, 15 more than were reported <strong>in</strong> the previous year. Of<br />
the 139 commercial vessel mar<strong>in</strong>e <strong>in</strong>cidents, 49 (35%) were classified as ‘response only’ and 90 (65%) as<br />
‘serious’ <strong>in</strong>cidents.<br />
Figure 1 shows the trend <strong>in</strong> reported mar<strong>in</strong>e <strong>in</strong>cidents from 1999/2000 to <strong>2007</strong>/8. No <strong>in</strong>ferences can yet<br />
be drawn from the trend l<strong>in</strong>e because case capture (on the MID) was poor up to 2005/6 and may still be<br />
improv<strong>in</strong>g. Several more years of data will be needed to establish reliable trend data.<br />
Figure 1 Trend <strong>in</strong> commercial vessel <strong>in</strong>cidents by year, <strong>Mar<strong>in</strong>e</strong> Incident Database<br />
1999/2000 to <strong>2007</strong>/8<br />
160<br />
150<br />
140<br />
130<br />
139<br />
120<br />
124<br />
110<br />
100<br />
90<br />
Frequency<br />
80<br />
70<br />
81<br />
60<br />
58<br />
50<br />
50<br />
52<br />
40<br />
30<br />
34<br />
32<br />
20<br />
21 25<br />
10<br />
0<br />
199900 200001 200102 200203 200304 200405 200506 200607 <strong>2007</strong>08<br />
F<strong>in</strong>ancial year<br />
Source: <strong>Mar<strong>in</strong>e</strong> Incident Database July 1999 to June <strong>2008</strong><br />
Notes: (1) Data for 2001/2 were <strong>in</strong>complete, as <strong>in</strong>cidents were not recorded <strong>in</strong> September and October. The dotted l<strong>in</strong>e shows the trend<br />
if <strong>in</strong>cidents <strong>in</strong> those two months were estimated us<strong>in</strong>g the average frequency of <strong>in</strong>cidents for the same months <strong>in</strong> previous years.<br />
(2) The ‘response only’ category of commercial vessel <strong>in</strong>cidents for 1999/2000 to 2004/5 <strong>in</strong>cludes disablements, overdue vessels<br />
and unspecified <strong>in</strong>cidents. The <strong>in</strong>clusion criteria changed <strong>in</strong> 2005/6 with the <strong>in</strong>troduction of the MIR and the ‘response only’<br />
category covered vessel disablements, persons <strong>in</strong> trouble, false alarms and non-mar<strong>in</strong>e <strong>in</strong>cidents. MSV requested that the<br />
‘response only’ category <strong>in</strong> the <strong>2007</strong>/08 report should be restricted to vessel disablements and persons <strong>in</strong> trouble and false<br />
alarms and non-mar<strong>in</strong>e <strong>in</strong>cidents excluded. In this trend graph we have excluded false alarms and non-mar<strong>in</strong>e <strong>in</strong>cidents from all<br />
years from 2005/6 for consistency.<br />
<strong>Mar<strong>in</strong>e</strong> <strong>Safety</strong> <strong>in</strong> <strong>Victoria</strong>: July <strong>2007</strong> to June <strong>2008</strong> 17
3.2 ‘Response only’ <strong>in</strong>cidents (n=49)<br />
In <strong>2007</strong>/8 the def<strong>in</strong>ition of ‘response only’ <strong>in</strong>cidents was restricted to vessel disablements and persons <strong>in</strong><br />
trouble and false alarms and non-mar<strong>in</strong>e <strong>in</strong>cidents excluded. There were 49 commercial ‘response only’<br />
<strong>in</strong>cidents reported on the MIR <strong>in</strong> <strong>2007</strong>/8, 15 more than <strong>in</strong> 2006/7 (n=34, exclud<strong>in</strong>g false alarms and nonmar<strong>in</strong>e<br />
<strong>in</strong>cidents). All were s<strong>in</strong>gle vessel <strong>in</strong>cidents.<br />
3.2.1 Severity of ‘response only’ commercial <strong>in</strong>cidents<br />
Most of the 49 ‘response only’ <strong>in</strong>cidents did not result <strong>in</strong> any damage to property or person (n=38, 78%).<br />
The <strong>in</strong>jury status of one <strong>in</strong>cident was coded as ‘miss<strong>in</strong>g person’ but the <strong>in</strong>cident description did not<br />
su<strong>pp</strong>ort this code. One <strong>in</strong>cident caused serious <strong>in</strong>jury (2%, a commercial fish<strong>in</strong>g vessel ski<strong>pp</strong>er crushed<br />
his f<strong>in</strong>ger when deploy<strong>in</strong>g the anchor); one caused damage to property (2%) and another caused damage<br />
to another vessel (2%). In the rema<strong>in</strong><strong>in</strong>g cases (n=7; 15%) the damage to person and/or property was<br />
undef<strong>in</strong>ed.<br />
3.2.2 Waterway name<br />
Forty-one percent of response only <strong>in</strong>cidents occurred on Port Phillip Bay, 25% on the Yarra River and a<br />
further 20% on Bass Strait. The rema<strong>in</strong>der occurred on Corio Bay (8%), Western Port (4%) and Gi<strong>pp</strong>sland<br />
Lakes-Lake <strong>Victoria</strong> (2%).<br />
3.2.3 Major causes (types) of <strong>in</strong>cidents<br />
All <strong>in</strong>cidents were disablements.<br />
3.2.4 Vessel details<br />
Thirty-two (65%) of the vessels <strong>in</strong>volved <strong>in</strong> the 49 commercial ‘response only’ <strong>in</strong>cidents were foreign<br />
owned/registered. The other vessels <strong>in</strong>volved were class 3 fish<strong>in</strong>g vessels (n=7, 14%), class 1 passenger<br />
vessels (n=7, 14%) and class 2 non-passenger vessels (n=3, 6%). Seventy-six percent of vessels were<br />
greater than 12m <strong>in</strong> length, 8% were 8-12m long and 4% were 4.6-8m long.<br />
3.2.5 Seasonal distribution, weather and water conditions<br />
Just over one third (35%) of the commercial ‘response only’ <strong>in</strong>cidents were reported <strong>in</strong> the 3-month period<br />
March to May <strong>2008</strong>, with the peak <strong>in</strong> May when 10 <strong>in</strong>cidents occurred.<br />
The w<strong>in</strong>d speed and water conditions were undef<strong>in</strong>ed or unknown for 21 <strong>in</strong>cidents (43%) and for 4<br />
<strong>in</strong>cidents (8%) the w<strong>in</strong>d speed was recorded but not the water conditions. Twelve <strong>in</strong>cidents (24%)<br />
occurred <strong>in</strong> calm water conditions with w<strong>in</strong>d speeds of 15 knots or less. Four (8%) occurred <strong>in</strong> cho<strong>pp</strong>y<br />
water with w<strong>in</strong>d speeds of 9-15 knots, five (10%) <strong>in</strong> rough water conditions with w<strong>in</strong>d speed rang<strong>in</strong>g from<br />
9 to over 30 knots and one (2%) <strong>in</strong> very rough water with a w<strong>in</strong>d speed of over 30 knots. One <strong>in</strong>cident (2%)<br />
occurred <strong>in</strong> a strong current with a w<strong>in</strong>d speed of 9-15 knots.<br />
Weather and visibility was undef<strong>in</strong>ed or unknown for 24 cases (49%). In one further case (2%) the visibility<br />
was recorded (good) but the weather was coded as unknown and <strong>in</strong> another (2%) the weather was<br />
18
ecorded (ra<strong>in</strong>) but not the visibility level. Eighteen <strong>in</strong>cidents (37%) occurred <strong>in</strong> clear weather with good<br />
visibility. Two (4%) occurred <strong>in</strong> cloudy weather with fair visibility, one (2%) <strong>in</strong> cloudy weather with poor<br />
visibility and one (2%) <strong>in</strong> cloudy weather with good visibility. One <strong>in</strong>cident (2%) occurred <strong>in</strong> hazy weather<br />
with fair visibility.<br />
3.2.6 Contributory factors<br />
Contribut<strong>in</strong>g factors were noted for 47 of the 49 ‘response only’ commercial <strong>in</strong>cidents. Eighty-two percent<br />
of the primary contributory factors noted were material factors (n=44 <strong>in</strong>cidents, either mach<strong>in</strong>ery or<br />
electrical failures), 8% were human factors (n=4; vessel disabled due to lack of fuel or lack of ma<strong>in</strong>tenance,<br />
vessel came adrift, vessel was steered <strong>in</strong>to an object/sand when the operator was try<strong>in</strong>g to free another<br />
vessel that had run aground) and 6% (n=3) were environmental (two due to tidal and bay conditions and<br />
the other to a length of canvas fire hose w<strong>in</strong>d<strong>in</strong>g around the propeller).<br />
3.3 Serious <strong>in</strong>cidents (n=90)<br />
There were 90 serious <strong>in</strong>cidents <strong>in</strong>volv<strong>in</strong>g commercial vessels recorded on the MIR system <strong>in</strong> <strong>2007</strong>/8, the<br />
same numbers <strong>in</strong> 2006/7.<br />
3.3.1 Severity of serious <strong>in</strong>cidents<br />
Incident severity is captured by two variables: <strong>in</strong>cident severity and <strong>in</strong>jury status. Table 1 shows the results<br />
of a cross tabulation of these variables. Where data were <strong>in</strong>consistent i.e. <strong>in</strong>jury status = m<strong>in</strong>or <strong>in</strong>jury and<br />
<strong>in</strong>cident severity = serious <strong>in</strong>jury a hierarchy based on personal <strong>in</strong>jury severity (from fatality to m<strong>in</strong>or <strong>in</strong>jury)<br />
then property damage (vessel lost, property or other vessel damage, no damage) was a<strong>pp</strong>lied<br />
Table 1<br />
Commercial vessel ‘serious <strong>in</strong>cidents’ by severity of <strong>in</strong>cident and year, <strong>Mar<strong>in</strong>e</strong> Incident<br />
<strong>Report</strong><strong>in</strong>g system 2006/7 and <strong>2007</strong>/8<br />
2006/7 <strong>2007</strong>/8<br />
N % N %<br />
Serious <strong>in</strong>jury <strong>in</strong>cident 2 2 4 4<br />
M<strong>in</strong>or <strong>in</strong>jury <strong>in</strong>cident, vessel lost - - 1 1<br />
M<strong>in</strong>or <strong>in</strong>jury <strong>in</strong>cident, other vessel damage 1 1 - -<br />
M<strong>in</strong>or <strong>in</strong>jury <strong>in</strong>cident, no damage to property 1 1 5 6<br />
Vessel lost, no personal <strong>in</strong>jury - - 5 6<br />
Other vessel damage, no personal <strong>in</strong>jury - - 7 8<br />
Damage to property only, no personal <strong>in</strong>jury 28 31 7 8<br />
No damage, no personal <strong>in</strong>jury 58 64 61 68<br />
TOTAL 90 100 90 100<br />
<strong>Mar<strong>in</strong>e</strong> <strong>Safety</strong> <strong>in</strong> <strong>Victoria</strong>: July <strong>2007</strong> to June <strong>2008</strong> 19
There were no recorded commercial vessel-related fatalities on the MIR system <strong>in</strong> <strong>2007</strong>/8, as <strong>in</strong> 2006/7.<br />
Over two-thirds (68%) of the ‘serious <strong>in</strong>cidents’ reported <strong>in</strong> <strong>2007</strong>/8 did not result <strong>in</strong> any personal or property<br />
damage, 11% resulted <strong>in</strong> serious or m<strong>in</strong>or <strong>in</strong>jury but no damage to vessel or property, 14% resulted <strong>in</strong><br />
vessel loss or damage without personal <strong>in</strong>jury and 8% resulted <strong>in</strong> damage to property without personal<br />
<strong>in</strong>jury (Table 1).<br />
The four serious <strong>in</strong>jury <strong>in</strong>cidents were described as follows:<br />
(1) A crew member on board a cement bulk carrier en-route from Davenport to Port Phillip fell whilst at<br />
sea 50k south of Port Phillip Heads. He suffered head and facial <strong>in</strong>juries and was unconscious for 15<br />
m<strong>in</strong>utes. Air rescue was not possible due to w<strong>in</strong>d and sea conditions and paramedics could not get<br />
out to him from Queenscliff. When the vessel berthed <strong>in</strong> Yarra he was transferred by ambulance to the<br />
Alfred Hospital.<br />
(2) An 8-year old girl, a passenger on the Yarra Pr<strong>in</strong>cess, fell down the aft stairs near the doorway to the<br />
aft deck and fractured her forearm. She was taken off the vessel at <strong>Victoria</strong> Harbour and transported<br />
to hospital.<br />
(3) The ski<strong>pp</strong>er of the Sea Eagle was <strong>in</strong>jured dur<strong>in</strong>g a rout<strong>in</strong>e check of the eng<strong>in</strong>e when the eng<strong>in</strong>e catch<br />
cover fell and his head was crushed between the eng<strong>in</strong>e bay and the hatch cover. He suffered facial<br />
fractures.<br />
(4) A man jumped off the bow of a vessel onto shore whilst it was moored. He landed awkwardly and<br />
broke his left ankle.<br />
The six vessel losses occurred <strong>in</strong> the follow<strong>in</strong>g circumstances:<br />
(1) The fish<strong>in</strong>g vessel ‘Jumanji’ caught fire while tied up at the northern end of Fisherman’s Wharf and<br />
cont<strong>in</strong>ued to burn for 2 hours before fire was ext<strong>in</strong>guished by CFA.<br />
(2) Vessel was a survey vessel that was currently not <strong>in</strong> operation and was moored at Centre Pier, <strong>Victoria</strong><br />
Harbour Docklands. The vessel began tak<strong>in</strong>g on water and sank below waterl<strong>in</strong>e.<br />
(3) A vessel was runn<strong>in</strong>g low on fuel, a bar cross<strong>in</strong>g at night was attempted and the vessel ran aground. It<br />
subsequently took on water <strong>in</strong> port hull and began to break up.<br />
(4) Professional prawn trawler was work<strong>in</strong>g a<strong>pp</strong>roximately 250 (?) off shore from Lakes Entrance. A<br />
problem developed with the heat exchanger hose and the vessel started tak<strong>in</strong>g large amount of<br />
water. A decision was made to br<strong>in</strong>g <strong>in</strong> the gear and head for the beach. The vessel rolled on its port<br />
side a<strong>pp</strong>roximately 80 metres off shore and sunk <strong>in</strong> shallow water. The life raft deployed and the<br />
crew abandoned ship. The alarm was raised and crew members were rescued by the Lakes Entrance<br />
Coast Guard.<br />
(5) A 23 foot abalone fish<strong>in</strong>g vessel was operat<strong>in</strong>g close to shore when it was hit by waves and was<br />
swamped and sunk. Both occupants, the abalone diver and ski<strong>pp</strong>er, were retrieved from water safely<br />
and conveyed back to Apollo Bay.<br />
(6) The fish<strong>in</strong>g vessel ‘The Sa<strong>in</strong>t’ sank on 12 April <strong>2008</strong>, the owner reported he suspected that the vessel<br />
may have been tampered with.<br />
20
3.3.2 Major causes (types) of <strong>in</strong>cidents<br />
Close quarters (52%), ground<strong>in</strong>g (13%) and collisions (12%) were the lead<strong>in</strong>g causes of ‘serious <strong>in</strong>cidents’<br />
<strong>in</strong> <strong>2007</strong>/8 (Table 2). While the rank<strong>in</strong>g of the top 3 causes is similar <strong>in</strong> <strong>2007</strong>/8 to 2006/7 there were<br />
fewer collisions and more ground<strong>in</strong>g, swamp<strong>in</strong>g/s<strong>in</strong>k<strong>in</strong>g and on-board <strong>in</strong>cidents <strong>in</strong> <strong>2007</strong>/8 compared<br />
with 2006/7.<br />
Table 2<br />
Commercial vessel ‘serious <strong>in</strong>cidents’ by type (cause) of <strong>in</strong>cident, <strong>Mar<strong>in</strong>e</strong> Incident<br />
<strong>Report</strong><strong>in</strong>g system 2006/7 and <strong>2007</strong>/8<br />
INCIDENT TYPE 2006/7 Current year <strong>2007</strong>/8<br />
N % N %<br />
SERIOUS INCIDENT<br />
Close quarters 44 49 47 52<br />
Collision<br />
27 30 11 12<br />
• fixed object<br />
15 33 2 2<br />
• with another vessel<br />
9 10 4 4<br />
• float<strong>in</strong>g object<br />
3 3 2 2<br />
• submerged object<br />
- - 3 3<br />
Structural failure - - 1 1<br />
Ground<strong>in</strong>g 7 8 12 13<br />
Fire 3 3 3 3<br />
Capsiz<strong>in</strong>g 2 2 - -<br />
Swamp<strong>in</strong>g/s<strong>in</strong>k<strong>in</strong>g 2 2 6 7<br />
Other personal <strong>in</strong>jury 2 2 - -<br />
Person overboard 1 1 - -<br />
Flood<strong>in</strong>g 1 1 1 1<br />
Onboard <strong>in</strong>cident 1 1 9 10<br />
TOTAL 90 100 90 100<br />
3.3.3 Vessel details<br />
Most serious <strong>in</strong>cidents (96%) <strong>in</strong>volved a s<strong>in</strong>gle vessel. A high proportion of the vessels <strong>in</strong>volved <strong>in</strong><br />
<strong>in</strong>cidents were foreign-owned (n=40, 44%), followed by passenger vessels (Class One) (n=25, 28%), nonpassenger<br />
vessels (Class 2) (n=9, 10%) and fish<strong>in</strong>g vessels (Class 3) (n=9, 10%). There was one mechanically<br />
powered and one sail powered vessel (n=2, 2%). In the rema<strong>in</strong><strong>in</strong>g cases (n=5, 6%), the vessel type was not<br />
specified.<br />
Data on vessel activity at time of the <strong>in</strong>cident was poorly recorded with only 3 cases (3%) <strong>in</strong>dicat<strong>in</strong>g the<br />
activity. One vessel was at anchor, one was on a fish<strong>in</strong>g expedition and the third was rac<strong>in</strong>g at the time of<br />
the <strong>in</strong>cident.<br />
<strong>Mar<strong>in</strong>e</strong> <strong>Safety</strong> <strong>in</strong> <strong>Victoria</strong>: July <strong>2007</strong> to June <strong>2008</strong> 21
3.3.4 Vessel occupant details, PFD wear<br />
Data on the number of crew and passengers were available for 88 of the 90 vessels. Seventy-four percent<br />
(n=67) of the vessels <strong>in</strong>volved <strong>in</strong> ‘serious <strong>in</strong>cidents’ carried no crew and 83% (n=75) carried no passengers.<br />
The vessels carry<strong>in</strong>g crew (n=23) carried between 1 and 23 crew members. Fifteen vessels carried<br />
passengers (range 3-100 passengers).<br />
The serious <strong>in</strong>cident report form requires <strong>in</strong>formation to be completed on the person <strong>in</strong> charge of the<br />
vessel and any other persons <strong>in</strong>volved. Data on gender of persons <strong>in</strong>volved showed that 58% were male<br />
and 42% female. Age was given for person <strong>in</strong>volved <strong>in</strong> 57% of <strong>in</strong>cidents (n=51). The mean age was 52<br />
years (age range 30-71 years).<br />
The licence type held by the person <strong>in</strong> charge of the vessel <strong>in</strong>volved <strong>in</strong> the <strong>in</strong>cident was reported for 63%<br />
of <strong>in</strong>cidents. Thirty-seven percent were pilots, 7% were Pilot Exempt Master, 6% were coxswa<strong>in</strong>, 4% were<br />
Master Class 5, 2% were Master Class 4, and 1% was Ski<strong>pp</strong>er Grade 2. Two held no boat<strong>in</strong>g license (2%).<br />
The person’s ‘activity’ was undef<strong>in</strong>ed for 76% of <strong>in</strong>cidents and the ‘role of the person at the helm’ was<br />
‘undef<strong>in</strong>ed’ for 99% of <strong>in</strong>cidents. All of 90 <strong>in</strong>cidents were coded to zero (‘0’) for PFD wear.<br />
3.3.5 Seasonal distribution<br />
Figure 2 shows the seasonal pattern of commercial mar<strong>in</strong>e <strong>in</strong>cidents, presented separately for ‘response<br />
only’ and ‘serious <strong>in</strong>cidents’. The peak season for serious <strong>in</strong>cidents was Spr<strong>in</strong>g (n=29, 32%) followed by<br />
Summer (n=23, 26%). Response only <strong>in</strong>cidents peaked <strong>in</strong> Autumn (n=16, 33%), due only to a high number<br />
of <strong>in</strong>cidents <strong>in</strong> May.<br />
Figure 2 Distribution of commercial vessel <strong>in</strong>cidents by month of <strong>in</strong>cident,<br />
<strong>Mar<strong>in</strong>e</strong> Incident <strong>Report</strong><strong>in</strong>g system <strong>2007</strong>/8 (n=139)<br />
Jun<br />
May<br />
2<br />
6<br />
8<br />
9<br />
Serious <strong>in</strong>cident (n=90)<br />
Response only (n=49)<br />
Apr<br />
4<br />
4<br />
Mar<br />
3<br />
9<br />
Feb<br />
4<br />
4<br />
Month<br />
Jan<br />
Dec<br />
2<br />
4<br />
9<br />
10<br />
Nov<br />
2<br />
11<br />
Oct<br />
4<br />
13<br />
Sep<br />
5<br />
7<br />
Aug<br />
2<br />
7<br />
Jul<br />
4<br />
6<br />
0 2 4 6 8 10 12 14<br />
Frequency<br />
22
3.3.6 Waterway type, location and environmental conditions<br />
Most commercial ‘serious <strong>in</strong>cidents’ occurred <strong>in</strong> enclosed waters (61%), followed by <strong>in</strong>land waters (26%)<br />
and coastal offshore waters (10%). Thirty-three <strong>in</strong>cidents (37%) occurred on Port Phillip Bay, 22 occurred<br />
on the Yarra River (24%), 10 on Corio Bay (11%), 10 <strong>in</strong> Bass Strait (11%), 9 on the Gi<strong>pp</strong>sland Lakes (10%), 3 on<br />
Western Port (3%) and one each on the Maribyrnong River and Lake Nagambie (2%). The location was not<br />
recorded for one case.<br />
Table 3 summarises the weather and water conditions <strong>in</strong> which ‘serious <strong>in</strong>cidents’ occurred. Water and<br />
environmental conditions were not reported for between 30% and 40% of <strong>in</strong>cidents. Around half of<br />
‘serious <strong>in</strong>cidents’ occurred <strong>in</strong> clear weather, with good visibility and w<strong>in</strong>d speeds up to 15 knots and 40%<br />
occurred <strong>in</strong> calm waters.<br />
Table 3<br />
Commercial ‘serious <strong>in</strong>cidents’ by environmental conditions, <strong>Mar<strong>in</strong>e</strong><br />
Incident <strong>Report</strong><strong>in</strong>g system, <strong>2007</strong>/8<br />
N %<br />
Weather<br />
clear 48 53<br />
hazy 3 3<br />
cloudy 7 8<br />
ra<strong>in</strong> 2 2<br />
undef<strong>in</strong>ed/unknown 30 33<br />
Water conditions<br />
calm 35 39<br />
cho<strong>pp</strong>y 10 11<br />
rough/very rough 5 5<br />
strong current 1 1<br />
undef<strong>in</strong>ed/unknown 39 43<br />
Visibility<br />
good 46 51<br />
fair 6 7<br />
poor 5 6<br />
undef<strong>in</strong>ed/unknown 33 37<br />
W<strong>in</strong>d speed<br />
none 4 4<br />
1-8 knots 26 29<br />
9-15 knots 16 18<br />
16-30 knots 7 8<br />
over 30 knots 4 4<br />
undef<strong>in</strong>ed/unknown 33 37<br />
<strong>Mar<strong>in</strong>e</strong> <strong>Safety</strong> <strong>in</strong> <strong>Victoria</strong>: July <strong>2007</strong> to June <strong>2008</strong> 23
3.3.7 Contributory factors to ‘serious <strong>in</strong>cidents’<br />
Contributory factors were not recorded for 36 serious <strong>in</strong>cidents (40%). Read<strong>in</strong>g of the <strong>in</strong>cident descriptions<br />
revealed that most of these were reports of close quarters <strong>in</strong>cidents <strong>in</strong> which another vessel, usually<br />
a small craft cut across the bow of or strayed <strong>in</strong>to the path of commercial vessels or were anchored <strong>in</strong><br />
shi<strong>pp</strong><strong>in</strong>g fairways.<br />
Seventy-two contributory factors were recorded for the rema<strong>in</strong><strong>in</strong>g 54 <strong>in</strong>cidents. Unlike ‘response only’<br />
<strong>in</strong>cidents where material factors were the major contributors, serious <strong>in</strong>cidents mostly <strong>in</strong>volved human<br />
factors (n=43, 60%), followed by environmental factors (n=16, 22%) then equipment/material factors<br />
(n=13, 18%).<br />
Table 4 summarises the results of a detailed analysis of contributory factors. Forty-three separate<br />
human factors were implicated <strong>in</strong> <strong>in</strong>cidents, the most common of which were errors of judgement and<br />
navigational errors. A total of 16 environmental factors were reported, most were l<strong>in</strong>ked to the w<strong>in</strong>d or sea<br />
state. Thirteen material factors were reported of which hull failure and electrical faults were most common.<br />
24
Table 4<br />
Factors contribut<strong>in</strong>g to commercial ‘serious <strong>in</strong>cidents’, <strong>Mar<strong>in</strong>e</strong> Incident <strong>Report</strong><strong>in</strong>g system<br />
<strong>2007</strong>/8 (n=<strong>72</strong> factors)<br />
N %<br />
Human factors<br />
Errors of judgement 11 15.3<br />
Navigational error 4 5.6<br />
Inexperience 3 4.2<br />
Failure to keep proper lookout 2 2.7<br />
Insecure moor<strong>in</strong>g 2 2.7<br />
Lack of fuel 2 2.7<br />
Lack of ma<strong>in</strong>tenance 1 1.4<br />
Alcohol or drugs 1 1.4<br />
Ill health 1 1.4<br />
Other human factor 16 22.2<br />
Sub total 43 59.7<br />
Environmental factors<br />
W<strong>in</strong>d/sea state 9 12.5<br />
Tidal conditions 2 2.8<br />
Float<strong>in</strong>g or submerged object 2 2.8<br />
Restricted visibility 1 <strong>1.3</strong><br />
Other environmental factors 2 2.8<br />
Sub total 16 22.2<br />
Material factors<br />
Hull failure 4 5.6<br />
Electrical equipment 4 5.6<br />
Mach<strong>in</strong>ery 2 2.7<br />
Other material factors 3 4.2<br />
Sub-total 13 18.1<br />
TOTAL <strong>72</strong> 100.0<br />
3.4 Hospital-treated commercial boat<strong>in</strong>g-related <strong>in</strong>juries recorded on <strong>in</strong>jury<br />
surveillance databases (2006/7)<br />
Ten of the commercial <strong>in</strong>cidents recorded on the MIR system <strong>in</strong> <strong>2007</strong>/8 resulted <strong>in</strong> <strong>in</strong>juries (4 ‘serious’<br />
and 6 ‘m<strong>in</strong>or’). Hospital admissions data for <strong>2007</strong>/8 are not yet available. The hospital <strong>in</strong>jury surveillance<br />
datasets recorded 17 hospital-treated commercial vessel-related <strong>in</strong>jury cases over the 12-month period<br />
July 1, 2006 to June 30, <strong>2007</strong> (4 admissions and 13 ED presentations) compared with 6 <strong>in</strong>jury <strong>in</strong>cidents<br />
recorded on the MIR system over the same period, covered <strong>in</strong> last year’s mar<strong>in</strong>e report.<br />
<strong>Mar<strong>in</strong>e</strong> <strong>Safety</strong> <strong>in</strong> <strong>Victoria</strong>: July <strong>2007</strong> to June <strong>2008</strong> 25
3.4.1 Hospital admissions (n=4)<br />
The four hospitalisations recorded on the VAED were all male adults aged between 15 and 34 years.<br />
One worker was <strong>in</strong>jured on a merchant vessel, two others on ‘unspecified craft’ and the fourth on ‘other<br />
powered watercraft’. The causes of <strong>in</strong>jury were: ‘other and unspecified’ water accident (2 cases), accident to<br />
watercraft caus<strong>in</strong>g other <strong>in</strong>jury (1 case) and onboard <strong>in</strong>cident not <strong>in</strong>volv<strong>in</strong>g craft accident, nor drown<strong>in</strong>g/<br />
submersion (1 case). Recorded primary diagnoses <strong>in</strong>cluded ruptured anterior cruciate <strong>in</strong>jury (1 case), fibula<br />
fracture near the ankle (2 cases) and fracture of the forearm (1 case).<br />
3.4.2 Hospital emergency department presentations (n=13)<br />
Twelve of the 13 persons (92%) present<strong>in</strong>g to hospital EDs for commercial boat<strong>in</strong>g <strong>in</strong>jury were males.<br />
Presentations were spread across the 5-year age groups from age 15 to age 54 and there was one further<br />
case <strong>in</strong> age group 70-74. Three ED presentations (23%) were for hand <strong>in</strong>juries and another three were<br />
for ankle <strong>in</strong>juries. The other cases presented with shoulder, forearm, wrist, lower leg, multiple <strong>in</strong>juries or<br />
foreign body <strong>in</strong> the eye. The primary <strong>in</strong>jury diagnoses were: <strong>in</strong>jury to muscle/tendon (3 cases), crush<strong>in</strong>g<br />
<strong>in</strong>jury (2 cases), then one case each for superficial wounds, fracture, crush<strong>in</strong>g <strong>in</strong>jury, burn/corrosion, foreign<br />
body, other and multiple <strong>in</strong>juries.<br />
The follow<strong>in</strong>g <strong>in</strong>jury scenarios were extracted from VEMD case narrative data:<br />
• Hit by boat trailer <strong>in</strong> chest as it rolled down hill<br />
• Fall from boat (3 metres)<br />
• Crush <strong>in</strong>jury to right thumb when he dro<strong>pp</strong>ed boat trailer<br />
• Caught hand <strong>in</strong> boat rope<br />
• Fell down steps on boat<br />
• Pull<strong>in</strong>g boat <strong>in</strong>to harbour, <strong>in</strong>jured shoulder<br />
• Sli<strong>pp</strong>ed off boat ramp, <strong>in</strong>jured ankle<br />
• 50 kg object (manhole cover) fell on patient, <strong>in</strong>jured shoulder<br />
• Work<strong>in</strong>g on fish<strong>in</strong>g boat, cut f<strong>in</strong>ger on unknown object 4 days ago<br />
• Injured when push<strong>in</strong>g a boat<br />
• Sailboat rac<strong>in</strong>g, <strong>in</strong>jured f<strong>in</strong>ger unsure how<br />
• Capta<strong>in</strong> of paddle steamer <strong>in</strong>jured by boil<strong>in</strong>g water<br />
• Blurred vision, foreign body<br />
26
4. Results: hire/drive vessel <strong>in</strong>cidents<br />
(<strong>2007</strong>/8)<br />
4.1 Frequency<br />
There were 8 mar<strong>in</strong>e <strong>in</strong>cidents <strong>in</strong>volv<strong>in</strong>g a hire/drive vessel recorded on the MIR for the 12-month period<br />
July <strong>2007</strong> to June <strong>2008</strong> (Figure 3).<br />
Figure 3 Trend <strong>in</strong> hire-drive vessel <strong>in</strong>cidents by year, <strong>Mar<strong>in</strong>e</strong> Incident<br />
<strong>Report</strong><strong>in</strong>g system 1999/2000 to <strong>2007</strong>/8<br />
20<br />
18<br />
16<br />
14<br />
14<br />
Frequency<br />
12<br />
10<br />
8<br />
8<br />
8<br />
6<br />
4<br />
2<br />
0<br />
2<br />
3<br />
3<br />
199900 200001 200102 200203 200304 200405 200506 200607 <strong>2007</strong>08<br />
F<strong>in</strong>ancial year<br />
1<br />
5<br />
2<br />
Source: <strong>Mar<strong>in</strong>e</strong> Incident <strong>Report</strong><strong>in</strong>g system July 1999 to June <strong>2008</strong><br />
Note: Data for 2001/2 were <strong>in</strong>complete, estimated frequencies (based on average frequency for same months <strong>in</strong> previous year) were<br />
used for September and October 2001<br />
4.2 Incident severity<br />
There was no damage <strong>in</strong> 6 hire/drive <strong>in</strong>cidents (75%), damage to property only <strong>in</strong> one <strong>in</strong>cident (12.5%) and<br />
other vessel damage <strong>in</strong> one <strong>in</strong>cident (12.5%).<br />
4.3 Major causes (types) of <strong>in</strong>cidents<br />
Five <strong>in</strong>cidents were due to ground<strong>in</strong>g-un<strong>in</strong>tentional (63%), one was due to a disablement (12.5%), one was<br />
an onboard <strong>in</strong>cident-crush<strong>in</strong>g/p<strong>in</strong>ch<strong>in</strong>g (12.5%) and <strong>in</strong> one case the type of <strong>in</strong>cident was undef<strong>in</strong>ed.<br />
4.4 Vessel and occupant details<br />
All were s<strong>in</strong>gle vessel <strong>in</strong>cidents. Five vessels had passengers on board at the time of the <strong>in</strong>cident (between<br />
1 and 3).<br />
<strong>Mar<strong>in</strong>e</strong> <strong>Safety</strong> <strong>in</strong> <strong>Victoria</strong>: July <strong>2007</strong> to June <strong>2008</strong> 27
4.5 Type of water and environmental conditions<br />
Six <strong>in</strong>cidents (75%) occurred <strong>in</strong> enclosed waters (Gi<strong>pp</strong>sland Lakes – Lake K<strong>in</strong>g and Lake <strong>Victoria</strong>) and <strong>in</strong> two<br />
cases the type of water was not recorded. Visibility was poor <strong>in</strong> one <strong>in</strong>cident, w<strong>in</strong>d speed over 30 knots <strong>in</strong><br />
two <strong>in</strong>cidents, it was ra<strong>in</strong><strong>in</strong>g when one <strong>in</strong>cident occurred and the sea was rough or very rough at the time<br />
of two <strong>in</strong>cidents.<br />
4.6 Contributory factors<br />
In three <strong>in</strong>cidents the primary contributory factor was environmental (w<strong>in</strong>d/sea state) with human factors<br />
also contribut<strong>in</strong>g (<strong>in</strong>experience, navigational error and <strong>in</strong>secure moor<strong>in</strong>g). In the other five cases, the<br />
primary contributors were human factors (navigational error, <strong>in</strong>experience, lack of boat ma<strong>in</strong>tenance and<br />
‘other’) with material factors mak<strong>in</strong>g a secondary contribution <strong>in</strong> two cases (equipment-mach<strong>in</strong>ery failure<br />
and ‘other’ material factor).<br />
Incidents were described thus:<br />
• Hire boat experienc<strong>in</strong>g difficulties <strong>in</strong> strong w<strong>in</strong>ds, blown on shore, and female occupant <strong>in</strong>jured ankle<br />
when fend<strong>in</strong>g off<br />
• Hire yacht grounded, navigational error<br />
• Vessel was tied alongside jetty, jetty bollards and vessel broke as a result of strong w<strong>in</strong>ds and vessel<br />
washed ashore on rocks<br />
• Vessel broke moor<strong>in</strong>g and drifted ashore, no damage caused<br />
• Broken down motor on t<strong>in</strong>ny, required tow back to his jetty<br />
• Hire boat broken down due to fuel l<strong>in</strong>e disconnect<strong>in</strong>g from tank<br />
• Hire drive vessel ran aground <strong>in</strong> shallow water<br />
• Hire boat ran aground <strong>in</strong> soft mud, vessel towed off<br />
28
5. Results: recreational vessel <strong>in</strong>cidents<br />
(<strong>2007</strong>/8) and hospital-treated boat<strong>in</strong>g<br />
<strong>in</strong>jury (2006/7)<br />
5.1 Recreational vessel <strong>in</strong>cidents (<strong>2007</strong>/8)<br />
There were 1091 recorded recreational vessel <strong>in</strong>cidents on the MIR <strong>in</strong> <strong>2007</strong>/8, up from 913 <strong>in</strong> 2006/7. The<br />
19% <strong>in</strong>crease is possibly due to better report<strong>in</strong>g. Figure 4 shows the frequency of mar<strong>in</strong>e <strong>in</strong>cidents by<br />
f<strong>in</strong>ancial year from 1999/2000.<br />
Figure 4 Trend <strong>in</strong> recreational vessel <strong>in</strong>cidents by year, <strong>Mar<strong>in</strong>e</strong> Incident<br />
<strong>Report</strong><strong>in</strong>g system, 1999/2000 to <strong>2007</strong>/8<br />
1200<br />
1000<br />
All recreational <strong>in</strong>cidents<br />
Response only*<br />
Serious <strong>in</strong>cident<br />
913<br />
1091<br />
926<br />
800<br />
741<br />
813<br />
Frequency<br />
600<br />
768<br />
598<br />
762 774<br />
594 589<br />
771 754<br />
606<br />
598<br />
601<br />
<strong>72</strong>9<br />
782<br />
400<br />
200<br />
0<br />
170<br />
168<br />
185<br />
165 156 140<br />
84<br />
131<br />
165<br />
199900 200001 200102 200203 200304 200405 200506 200607 <strong>2007</strong>08<br />
F<strong>in</strong>ancial year<br />
Source: <strong>Mar<strong>in</strong>e</strong> Incident Database and <strong>Mar<strong>in</strong>e</strong> Incident <strong>Report</strong><strong>in</strong>g system July 1999 to June <strong>2008</strong><br />
Notes: (1) Data for 2001/2 were <strong>in</strong>complete, estimated frequencies (based on average frequency for same months <strong>in</strong> previous year)<br />
were used for September and October 2001<br />
(2) The ‘response only’ category of recreational vessel <strong>in</strong>cidents for 1999/2000 to 2004/5 <strong>in</strong>cludes disablements, overdue vessels<br />
and unspecified <strong>in</strong>cidents. The <strong>in</strong>clusion criteria changed <strong>in</strong> 2005/6 with the <strong>in</strong>troduction of the MIR and the ‘response only’<br />
category covered vessel disablements, persons <strong>in</strong> trouble, false alarms and non-mar<strong>in</strong>e <strong>in</strong>cidents. MSV requested that the<br />
‘response only’ category <strong>in</strong> the <strong>2007</strong>/08 report should be restricted to vessel disablements and persons <strong>in</strong> trouble and false<br />
alarms and non-mar<strong>in</strong>e <strong>in</strong>cidents excluded. In this trend graph we have excluded false alarms and non-mar<strong>in</strong>e <strong>in</strong>cidents from all<br />
years from 2005/6 for consistency.<br />
In <strong>2007</strong>/8, 85% (n=926) of the recreational <strong>in</strong>cidents were ‘response only’ <strong>in</strong>cidents and 15% (n=165) were<br />
‘serious <strong>in</strong>cidents’. Figure 4 shows the frequency by year and category of <strong>in</strong>cident and <strong>in</strong>dicates that<br />
‘response only’ <strong>in</strong>cidents have <strong>in</strong>creased each year from 2004/5. Serious <strong>in</strong>cidents decreased <strong>in</strong> frequency<br />
from 2001/2 to 2005/6 but <strong>in</strong> <strong>2007</strong>/8 returned to the number reported <strong>in</strong> 2002/3.<br />
<strong>Mar<strong>in</strong>e</strong> <strong>Safety</strong> <strong>in</strong> <strong>Victoria</strong>: July <strong>2007</strong> to June <strong>2008</strong> 29
5.2 Response only <strong>in</strong>cidents (n=926)<br />
Response only <strong>in</strong>cidents cover disablement of vessel and person <strong>in</strong> trouble. Figure 4 shows the trend <strong>in</strong><br />
the frequency of response only <strong>in</strong>cidents over time. In <strong>2007</strong>/8 there were 926 response only recreational<br />
vessel <strong>in</strong>cidents reported on the MIR system, an 18% <strong>in</strong>crease on the frequency of <strong>in</strong>cidents that occurred<br />
<strong>in</strong> 2006/7.<br />
5.2.1 Severity of ‘response only’ <strong>in</strong>cidents<br />
N<strong>in</strong>ety-six percent (n=886) of ‘response only’ <strong>in</strong>cidents did not result <strong>in</strong> any damage to property or person,<br />
3% (n=26) resulted <strong>in</strong> property damage only, 1% (n=10) resulted <strong>in</strong> other vessel damage and there were<br />
two vessels lost (0.2%).<br />
There was one serious <strong>in</strong>jury <strong>in</strong>cident, classified as response only because the <strong>in</strong>jured person was not<br />
onboard the vessel at the time of the <strong>in</strong>cident:<br />
• 62 year old male was pulled from water unconscious after check<strong>in</strong>g prop on his 30’ cruiser at Flagstaff<br />
Jetty. He was subsequently checked by paramedics and found to be O.K.<br />
5.2.2 Major causes (types) of <strong>in</strong>cidents<br />
Of the 926 ‘response only’ recreational <strong>in</strong>cidents reported <strong>in</strong> <strong>2007</strong>/8, 98% (n=904) were disablements and<br />
3% (n=22) were persons <strong>in</strong> trouble.<br />
5.2.3 Vessel details<br />
Most ‘response only’ <strong>in</strong>cidents <strong>in</strong>volved mechanically powered vessels (n=856, 92%), followed by sail<br />
powered vessels (n=53, 6%) and human powered vessels (n=9, 1%). Data on power source was miss<strong>in</strong>g<br />
for the rema<strong>in</strong><strong>in</strong>g 8 cases (1%). The type of vessel was recorded for 99% of cases (n=924). Over one-third<br />
of <strong>in</strong>cidents were each related to open boats (40%, n=368) and half-cab<strong>in</strong> cruisers (38%, n=352), another<br />
12% (n=114) were full-cab<strong>in</strong> cruisers, 4% (n=32) were yachts (keel boats), 3% (n=23) were PWC and 1%<br />
each <strong>in</strong>volved trailer sailers (n=12) and off-the-beach yachts/catamarans (n=6). The rema<strong>in</strong><strong>in</strong>g 18 <strong>in</strong>cidents<br />
<strong>in</strong>volved kayaks (n=4), skiboats (3), w<strong>in</strong>dsurfers (4), kite (4), rafts (2), tenders (2), and one houseboat, row<strong>in</strong>g<br />
boat and canoe.<br />
Nearly half (48%) of vessels were 4.8-8m <strong>in</strong> length, 30% were 0-4.8m <strong>in</strong> length, 4% were 8-12m <strong>in</strong> length<br />
and 2% were greater than 12m <strong>in</strong> length. The vessel length was not recorded for 16% of vessels.<br />
The vessel activity was miss<strong>in</strong>g, undef<strong>in</strong>ed or unknown for 74% of <strong>in</strong>cidents so recorded data are not<br />
mean<strong>in</strong>gful.<br />
5.2.4 Seasonal distribution<br />
Half the <strong>in</strong>cidents occurred <strong>in</strong> the 3-month period November to January (late Spr<strong>in</strong>g and Summer).<br />
Incidents were lowest <strong>in</strong> W<strong>in</strong>ter (9%). [Figure 5]<br />
30
Figure 5 Distribution of recreational vessel <strong>in</strong>cidents by month of <strong>in</strong>cident,<br />
<strong>Mar<strong>in</strong>e</strong> Incident <strong>Report</strong><strong>in</strong>g system <strong>2007</strong>/8 (n=1,091)<br />
Jun<br />
May<br />
2<br />
7<br />
28<br />
44<br />
Serious <strong>in</strong>cident (n=165)<br />
Response only (n=926)<br />
Apr<br />
12<br />
50<br />
Mar<br />
28<br />
104<br />
Feb<br />
16<br />
58<br />
Month<br />
Jan<br />
Dec<br />
24<br />
28<br />
131<br />
178<br />
Nov<br />
13<br />
154<br />
Oct<br />
12<br />
79<br />
Sep<br />
12<br />
48<br />
Aug<br />
2<br />
33<br />
Jul<br />
9<br />
19<br />
0 20 40 60 80 100 120 140 160 180 200<br />
Frequency<br />
Source: <strong>Mar<strong>in</strong>e</strong> Incident <strong>Report</strong><strong>in</strong>g system <strong>2007</strong>/8<br />
5.2.5 Contributory factors<br />
Data on the factors that contributed to the ‘response only’ <strong>in</strong>cident were recorded for 89% of cases<br />
(n=821). Up to 6 contributory factors were recorded per <strong>in</strong>cident and a total of 1,170 separate factors<br />
were identified. Table 5 summarises the contribution made by material, human and environmental<br />
factors to ‘response only’ <strong>in</strong>cidents that occurred <strong>in</strong> <strong>2007</strong>/8. As for commercial ‘response only’ <strong>in</strong>cidents,<br />
material factors made the greatest contribution (61% of factors), followed by human factors (35%) then<br />
environmental factors (4%).<br />
A total of 714 separate material factors were reported across 6<strong>72</strong> <strong>in</strong>cidents, the most common of which<br />
were mach<strong>in</strong>ery failures (62% of material factors, 38% of all factors) and electrical equipment failures (29%<br />
and 18%). Four hundred and thirteen separate human factors were implicated across 345 <strong>in</strong>cidents with<br />
lack of ma<strong>in</strong>tenance account<strong>in</strong>g for nearly half of the human factors (48% of human factors and 17% of all<br />
factors), followed by lack of fuel (21% and 7%), <strong>in</strong>experience (12% and 4%) and errors <strong>in</strong> judgement (9%<br />
and 3%). Environmental factors were least <strong>in</strong>volved. There were 43 separate contributory environmental<br />
factors reported across 40 <strong>in</strong>cidents, almost two-thirds of which were unfavourable sea or w<strong>in</strong>d conditions<br />
(63% of environmental factors, 2% of all factors) and 14% were tidal conditions (0.5% of all factors).<br />
<strong>Mar<strong>in</strong>e</strong> <strong>Safety</strong> <strong>in</strong> <strong>Victoria</strong>: July <strong>2007</strong> to June <strong>2008</strong> 31
Table 5<br />
Factors contribut<strong>in</strong>g to ‘response only’ recreational vessel <strong>in</strong>cidents, <strong>Mar<strong>in</strong>e</strong> Incident<br />
<strong>Report</strong><strong>in</strong>g system <strong>2007</strong>/8 (n=1,170 factors)<br />
N %<br />
Material factors<br />
Mach<strong>in</strong>ery 445 38.0<br />
Electrical equipment 210 17.9<br />
Fuel system blockage 24 2.1<br />
Navigational equipment 5 0.4<br />
Rig failure 5 0.4<br />
Hull failure 2 0.2<br />
Inadequate stability 1 0.1<br />
Other material factors 22 1.9<br />
Sub-total 714 61.0<br />
Human factors<br />
Lack of ma<strong>in</strong>tenance<br />
Lack of fuel 199 17.0<br />
Inexperience 86 7.4<br />
Error <strong>in</strong> judgement 51 4.4<br />
Navigational error 37 3.2<br />
Insecure moor<strong>in</strong>g 8 0.7<br />
Fatigue 6 0.5<br />
Failure to keep proper lookout 5 0.4<br />
Alcohol or drugs 3 0.3<br />
Unable to swim 2 0.2<br />
Ill health 2 0.2<br />
Excessive speed 1 0.1<br />
Other human factor 13 1.1<br />
Sub total 413 35.3<br />
Environmental factors<br />
W<strong>in</strong>d/sea state 27 2.3<br />
Tidal conditions 6 0.5<br />
Restricted visibility 4 0.3<br />
Float<strong>in</strong>g or submerged object 2 0.2<br />
Bar conditions 2 0.2<br />
Wash 1 0.1<br />
Other environmental factors 1 0.1<br />
Sub total 43 3.7<br />
TOTAL 1 170 100.0<br />
32
5.3 Serious <strong>in</strong>cidents (n=165)<br />
There were 165 serious <strong>in</strong>cidents recorded on the MIR system <strong>in</strong> <strong>2007</strong>/8, an <strong>in</strong>crease of 26% on the<br />
previous year (n=131) (Figure 4).<br />
5.3.1 Severity of ‘serious <strong>in</strong>cidents’<br />
Incident severity is captured <strong>in</strong> two variables: <strong>in</strong>cident severity and <strong>in</strong>jury status. Table 6 shows the results<br />
of a cross tabulation of these variables for recreational ‘serious <strong>in</strong>cidents’. Where data were <strong>in</strong>consistent<br />
(i.e. <strong>in</strong>jury status = m<strong>in</strong>or <strong>in</strong>jury and <strong>in</strong>cident severity = serious <strong>in</strong>jury) a hierarchy was implemented<br />
giv<strong>in</strong>g priority to personal <strong>in</strong>jury severity (from fatality to m<strong>in</strong>or <strong>in</strong>jury) then property damage (vessel lost,<br />
property damage, no damage).<br />
Table 6<br />
Recreational vessel ‘serious <strong>in</strong>cidents’ by severity and year, <strong>Mar<strong>in</strong>e</strong> Incident <strong>Report</strong><strong>in</strong>g<br />
system 2006/7 and <strong>2007</strong>/8<br />
Previous year<br />
2006/7<br />
Current year<br />
<strong>2007</strong>/8<br />
N % N %<br />
Fatal <strong>in</strong>cident 3* 2 7<br />
(9 deaths)<br />
Miss<strong>in</strong>g person 1 1 - -<br />
Serious <strong>in</strong>jury 8 6 9 6<br />
M<strong>in</strong>or <strong>in</strong>jury 8 6 8 5<br />
Vessel lost, m<strong>in</strong>or <strong>in</strong>jury - - 3 2<br />
Vessel lost, no personal <strong>in</strong>jury 8 6 9 5<br />
Damage to property only, no personal <strong>in</strong>jury 40 31 42 25<br />
Other vessel damage - - 21 13<br />
No damage, no personal <strong>in</strong>jury 63 48 66 40<br />
TOTAL 131 100 165 100<br />
4<br />
Note: *Two additional fatalities (of a boogie boarder and a scuba diver) were recorded under ‘response only’ <strong>in</strong>cidents <strong>in</strong> 2006/7<br />
Sixty percent of serious recreational vessel <strong>in</strong>cidents <strong>in</strong> <strong>2007</strong>/8 resulted <strong>in</strong> personal or property damage<br />
compared with 47% <strong>in</strong> 2006/7 (Table 6). There were 16 fatal and serious <strong>in</strong>jury <strong>in</strong>cidents <strong>in</strong> <strong>2007</strong>/8<br />
compared with 10 (plus one miss<strong>in</strong>g person) <strong>in</strong> 2006/7.<br />
Fatal <strong>in</strong>cidents (n=7, 9 deaths)<br />
There were 7 fatal <strong>in</strong>cidents caus<strong>in</strong>g 9 deaths recorded on the MIR system <strong>in</strong> <strong>2007</strong>/8 compared with 5 <strong>in</strong><br />
2006/7 (<strong>in</strong>clud<strong>in</strong>g two fatalities that were recorded as ‘response only’ <strong>in</strong>cidents). Deaths were caused by<br />
drown<strong>in</strong>g (3), impact <strong>in</strong>juries related to collisions (4) and burns (2). Data from the MIR system allows a case<br />
summary for each fatal <strong>in</strong>cident to be developed:<br />
<strong>Mar<strong>in</strong>e</strong> <strong>Safety</strong> <strong>in</strong> <strong>Victoria</strong>: July <strong>2007</strong> to June <strong>2008</strong> 33
• A half cab<strong>in</strong> cruiser (vessel length 5.9m.) with 3 persons on board was operat<strong>in</strong>g <strong>in</strong>ward across the<br />
Kate Kearney’s bar aga<strong>in</strong>st the tide. The vessel had experienced eng<strong>in</strong>e failure and was operat<strong>in</strong>g on<br />
its auxiliary outboard. The vessel did not have the speed to push aga<strong>in</strong>st the tide and was swamped<br />
by follow<strong>in</strong>g waves. A child passenger, wear<strong>in</strong>g a PFD, drowned. Contributory factors to the <strong>in</strong>cident<br />
<strong>in</strong>cluded bar conditions and mach<strong>in</strong>ery failure.<br />
• A half cab<strong>in</strong> cruiser (vessel length 5.4m.) with two persons on board was travell<strong>in</strong>g <strong>in</strong> an easterly<br />
direction up Cunn<strong>in</strong>gham Arm (Lakes Entrance) when it collided with a special marker (Compass Pile) at<br />
considerable speed. The bow was extensively damaged. Recorded contributory factors were restricted<br />
visibility, excessive speed and failure to keep a proper lookout. Neither decedent was wear<strong>in</strong>g a PFD.<br />
Their BAC levels were unknown.<br />
• A 6.1m.powered open boat carry<strong>in</strong>g two adults and five children collided with another vessel. One<br />
of the children on board, a five-year-old, was killed. Recorded contributory factors were error of<br />
judgement, excessive speed and failure to keep a proper lookout. All children on board the vessel were<br />
wear<strong>in</strong>g PFDs.<br />
• A 5.4m. half cab<strong>in</strong> cruiser with one person on board (a male aged 40) launched from Werribee and<br />
was due back at midday. It was reported overdue. An overnight search conducted by police and<br />
coastguard vessels was unsuccessful as was an aerial and sea search <strong>in</strong> daylight. In the same afternoon<br />
a body was located by a private recreational vessel which was identified as the miss<strong>in</strong>g vessel operator.<br />
No contributory factors were recorded. The deceased was wear<strong>in</strong>g a PFD. His BAC level was unknown.<br />
• The deceased, a 43 year old male on a 5m open powered vessel, was ejected from the vessel at high<br />
speed whilst compet<strong>in</strong>g <strong>in</strong> an Australian Power Boat Association event at Carrum. He died from <strong>in</strong>juries<br />
susta<strong>in</strong>ed on impact with water. Five contributory factors were recorded, two environmental and three<br />
human: float<strong>in</strong>g or submerged object, wash, error of judgement, excessive speed and <strong>in</strong>experience. He<br />
was wear<strong>in</strong>g a PFD. His BAC level was unknown.<br />
• A small (4.9m) powered recreational vessel was located with no person <strong>in</strong> it (it is unclear from the report<br />
if the occupant was reported miss<strong>in</strong>g). Water surface and land search along the river failed to f<strong>in</strong>d vessel<br />
occupant (a male aged 31). His body was eventually located at the bottom of the river, close to the<br />
vessel. The cause of the <strong>in</strong>cident was believed to be a comb<strong>in</strong>ation of moderate speed and <strong>in</strong>stability.<br />
Recorded contributory factors were: <strong>in</strong>experience, unable to swim and <strong>in</strong>adequate stability. He was not<br />
wear<strong>in</strong>g a PFD. His BAC level was 0.00.<br />
• There was an explosion and fire on a 12m powered cab<strong>in</strong> cruiser when the vessel was refuell<strong>in</strong>g at Pier<br />
35 mar<strong>in</strong>a. Two persons were killed and 3 persons were <strong>in</strong>jured. Recorded contributory factors were<br />
electrical equipment failure and ‘other material factor’. No details were given of age and gender of<br />
deceased. BAC level of deceased was unknown.<br />
Serious <strong>in</strong>jury <strong>in</strong>cidents (n=9)<br />
N<strong>in</strong>e serious <strong>in</strong>jury <strong>in</strong>cidents (lead<strong>in</strong>g to 11 serious <strong>in</strong>juries) were reported on the MIR system <strong>in</strong> <strong>2007</strong>/8,<br />
one more <strong>in</strong>cident than <strong>in</strong> 2006/7, compared with 20 <strong>in</strong> 2005/6. Serious <strong>in</strong>jury <strong>in</strong>cidents are underreported<br />
on the MIR (as they were on the MID) when frequencies are compared with recreational boat<strong>in</strong>g<br />
hospital admissions recorded on the <strong>Victoria</strong>n Admitted Episodes Dataset (see section 5.4.2), because<br />
many <strong>in</strong>jurious <strong>in</strong>cidents are not reported to the Water Police.<br />
34
The serious <strong>in</strong>jury <strong>in</strong>cidents occurred <strong>in</strong> the follow<strong>in</strong>g circumstances:<br />
• Two operators of PWC were <strong>in</strong>jured when their vessels collided. They were friends do<strong>in</strong>g ‘360s’ together<br />
and their PWCs collided when com<strong>in</strong>g out of a sp<strong>in</strong>. Contributory factors: error of judgement, excessive<br />
speed, failure to keep proper lookout and <strong>in</strong>experience. Both wear<strong>in</strong>g PFD. BAC levels unknown.<br />
• A 46 year-old PWC operator was <strong>in</strong>jured when he veered off course for an unknown reason and<br />
collided with a tree protrud<strong>in</strong>g from water (part of island <strong>in</strong> the centre of Lake Narracan). Contributory<br />
factors: error of judgement, excessive speed and failure to keep proper lookout. Operator not wear<strong>in</strong>g a<br />
PFD. BAC level: 0.00.<br />
• A 53 year-old kneeboarder, travell<strong>in</strong>g backwards on board and on 12m of rope, moved outside wake<br />
and collided with jetty. He susta<strong>in</strong>ed femur and other fractures. The vessel operator was unlicensed<br />
and the 5.8m. open vessel was exceed<strong>in</strong>g 5kts with<strong>in</strong> 50m. of the jetty. Contributory factors: error of<br />
judgement, excessive speed, failure to keep proper lookout and ‘other human factors’. He was wear<strong>in</strong>g<br />
PFD. BAC level unknown.<br />
• A ski boat (5.5m. <strong>in</strong> length) about to commence water ski<strong>in</strong>g session pushed out from bank and<br />
exploded on start<strong>in</strong>g. Two male occupants suffered serious burns. Contributory factors: equipment<br />
failure (mach<strong>in</strong>ery) and other material factors. Neither was wear<strong>in</strong>g a PFD. BAC level: undef<strong>in</strong>ed.<br />
• The male operator of a V8 jetboat failed to take a bend and the jetboat ran onto the bank, possibly<br />
cli<strong>pp</strong><strong>in</strong>g an exposed tyre and fli<strong>pp</strong>ed. A fuel leak caused a fire and the operator suffered first degree<br />
burns. Contributory factors: error of judgement and ‘other material factors’. Both vessel occupants were<br />
wear<strong>in</strong>g PFD. BAC level 0.00.<br />
• A 5.2m. open vessel under motor collided with an anchored vessel. No detail of <strong>in</strong>juries to occupant.<br />
Contributory factors: error of judgement, failure to keep a proper lookout. Occupant was not wear<strong>in</strong>g<br />
PFD. BAC level unknown.<br />
• A half-cab<strong>in</strong> vessel (6m. <strong>in</strong> length) under tow com<strong>in</strong>g <strong>in</strong> to berth. The tow<strong>in</strong>g vessel suddenly<br />
accelerated which catapulted the operator out of the towed (?) vessel and the vessel turned over and<br />
capsized tra<strong>pp</strong><strong>in</strong>g a female passenger underneath. The female was extricated with the assistance of<br />
a forklift and was revived with the a<strong>pp</strong>lication of CPR. Contributory factors: Error of judgement and<br />
<strong>in</strong>experience. BAC level: 0.00. The female was not wear<strong>in</strong>g a PFD.<br />
• A male fell out of his open vessel and was struck by the propeller <strong>in</strong>flict<strong>in</strong>g severe lacerations.<br />
Contributory factors: none recorded. He was not wear<strong>in</strong>g a PFD. BAC level unknown.<br />
• <strong>Report</strong> of a 59 year-old man hav<strong>in</strong>g a heart attack on a 4.1m. open vessel 100m off Williamstown<br />
Football Ground. Contributory factor: Ill health<br />
5.3.2 Major causes (types) of <strong>in</strong>cidents<br />
Ground<strong>in</strong>g (36%), capsiz<strong>in</strong>g (18%) and collision (13%) were the lead<strong>in</strong>g causes of ‘serious <strong>in</strong>cidents’ <strong>in</strong><br />
<strong>2007</strong>/8 (Table 7). While the rank<strong>in</strong>g of the top 2 causes is similar to 2006/7, a lesser proportion of <strong>in</strong>cidents<br />
were due to these causes than <strong>in</strong> the previous year. There were more than 5 times as many collision<br />
<strong>in</strong>cidents and four times as many fire <strong>in</strong>cidents <strong>in</strong> <strong>2007</strong>/8 compared to 2006/7.<br />
<strong>Mar<strong>in</strong>e</strong> <strong>Safety</strong> <strong>in</strong> <strong>Victoria</strong>: July <strong>2007</strong> to June <strong>2008</strong> 35
Table 7<br />
Recreational vessel ‘serious <strong>in</strong>cidents’ by type (cause) of <strong>in</strong>cident, <strong>Mar<strong>in</strong>e</strong> Incident<br />
<strong>Report</strong><strong>in</strong>g system 2006/7 and <strong>2007</strong>/8<br />
INCIDENT TYPE<br />
Previous year<br />
2006/7<br />
Current year<br />
<strong>2007</strong>/8<br />
N % N %<br />
SERIOUS INCIDENT<br />
Ground<strong>in</strong>g 61 47 60 36<br />
Capsiz<strong>in</strong>g 28 21 29 18<br />
Swamp<strong>in</strong>g/s<strong>in</strong>k<strong>in</strong>g 10 8 14 8<br />
Loss or presumed loss of vessel 7 5 5 3<br />
Person overboard 6 5 7 4<br />
Flood<strong>in</strong>g 4 3 10 6<br />
Onboard <strong>in</strong>cident 4 3 1 1<br />
Collision 4 3 22 13<br />
-with another vessel 3 14 8<br />
-submerged object - 4 2<br />
-fixed object 1 3 2<br />
-float<strong>in</strong>g object - 1 1<br />
Other personal <strong>in</strong>jury 3 2 - -<br />
-hit by vessel or propeller 2<br />
-ski<strong>in</strong>g <strong>in</strong>jury -<br />
-parasail<strong>in</strong>g <strong>in</strong>jury 1<br />
-other -<br />
Fire 3 2 13 8<br />
Loss of stability 1 1 - -<br />
Explosion - - 2 1<br />
Structural failure - - 1 1<br />
GRAND TOTAL 131 100 165 100<br />
36
5.3.3 Vessel details<br />
Over three-quarters of recreational vessels <strong>in</strong>volved <strong>in</strong> ‘serious <strong>in</strong>cidents’ were mechanically powered (77%,<br />
n=127), 20% were powered by sail (n=33) and 2% were human powered (n=3). The vessel type was not<br />
given for 2 <strong>in</strong>cidents.<br />
Figure 6 shows the specific type of vessel <strong>in</strong>volved <strong>in</strong> the ‘serious <strong>in</strong>cidents’. More than one-quarter of<br />
‘serious <strong>in</strong>cidents’ <strong>in</strong>volved open boats (26%), followed by full cab<strong>in</strong> cruisers (22%), half cab<strong>in</strong> cruisers (19%),<br />
yachts – keel boats (12%) and PWC (8%). Data on the type of vessel was miss<strong>in</strong>g for 2% of vessels <strong>in</strong> <strong>2007</strong>/8<br />
compared with almost one quarter of ‘serious <strong>in</strong>cidents’ <strong>in</strong> 2006/7.<br />
Figure 6 Frequency of recreational vessel ‘serious <strong>in</strong>cidents’ by type of vessel, <strong>Mar<strong>in</strong>e</strong> Incident<br />
<strong>Report</strong><strong>in</strong>g system <strong>2007</strong>/8<br />
Miss<strong>in</strong>g (n=2), 1 per cent<br />
Houseboat (n=1), 1 per cent<br />
Kayak (n=1), 1 per cent<br />
Canoe (n=1), 1 per cent<br />
Tender (n=2), 1 per cent<br />
Trailer Sailer (n=3), 2 per cent<br />
Yacht/Catamaran (off the beach)(n=11), 7 per cent<br />
Personal Water Craft (n=13), 8 per cent<br />
Open boat (n=43),<br />
25 per cent<br />
Yacht (Keel Boat)(n=19),<br />
12 per cent<br />
Cab<strong>in</strong> Cruiser (n=37),<br />
22 per cent<br />
Half cab<strong>in</strong> (n=32),<br />
19 per cent<br />
Source: <strong>Mar<strong>in</strong>e</strong> Incident <strong>Report</strong><strong>in</strong>g system <strong>2007</strong>/8<br />
<strong>Mar<strong>in</strong>e</strong> <strong>Safety</strong> <strong>in</strong> <strong>Victoria</strong>: July <strong>2007</strong> to June <strong>2008</strong> 37
Vessel length was known for 122 of the 165 vessels (74%) and lengths ranged from 2.7m to 38.0m. Twentytwo<br />
percent of vessels were 4.8m or less <strong>in</strong> length, 38% measured 4.8-8.0m, 15% measured 8-12m and 6%<br />
were longer than 12m.<br />
Over one third of vessels (35%) were cruis<strong>in</strong>g when the ‘serious <strong>in</strong>cident’ occurred (Table 8). Incidents<br />
also commonly occurred <strong>in</strong> fish<strong>in</strong>g (19%), when the vessel was at anchor (13%) and dur<strong>in</strong>g sail<strong>in</strong>g (n=20,<br />
15%). Compared with <strong>in</strong>cidents <strong>in</strong> 2006/7, a greater proportion occurred when the vessel was at anchor<br />
and a lesser proportion <strong>in</strong> yacht<strong>in</strong>g. Twelve percent of data were not coded for activity <strong>in</strong> the current year,<br />
compared with 10% <strong>in</strong> 2006/7 and 38% <strong>in</strong> 2005/6.<br />
Table 8<br />
Recreational vessel ‘serious <strong>in</strong>cidents’ by vessel activity and year, <strong>Mar<strong>in</strong>e</strong> Incident<br />
<strong>Report</strong><strong>in</strong>g system 2006/7 and <strong>2007</strong>/8<br />
Previous year<br />
2006/7<br />
Current year<br />
<strong>2007</strong>/8<br />
N % N %<br />
Cruis<strong>in</strong>g 42 32 57 34<br />
Fish<strong>in</strong>g 24 18 31 19<br />
At anchor 11 8 21 13<br />
Sail<strong>in</strong>g 20 15 13 8<br />
Transit<strong>in</strong>g 7 5 9 5<br />
Waterski<strong>in</strong>g or related activity 4 3 5 3<br />
Perform<strong>in</strong>g manoeuvres 7 5 4 2<br />
Div<strong>in</strong>g 1 1 1 1<br />
Perform<strong>in</strong>g ma<strong>in</strong>tenance 1 1 1 1<br />
Rac<strong>in</strong>g 1 1 3 2<br />
Miss<strong>in</strong>g 13 10 20 12<br />
TOTAL 131 100 165 100<br />
5.3.4 Vessel occupant details, PFD wear<br />
In 44% of ‘serious <strong>in</strong>cidents’ (n=73) the number of persons onboard the vessel/s was reported as zero. The<br />
rema<strong>in</strong><strong>in</strong>g 92 vessels carried 229 persons, an average of 2.5 persons per vessel (range 1-10 persons), with<br />
most vessels (n=75) carry<strong>in</strong>g between 1 and 3 people.<br />
Overall, 45% of recreational vessel occupants <strong>in</strong>volved <strong>in</strong> serious <strong>in</strong>cidents were recorded as wear<strong>in</strong>g PFD,<br />
compared with 62% <strong>in</strong> 2006/7. The wear rate for persons on vessels up to and <strong>in</strong>clud<strong>in</strong>g 4.8m <strong>in</strong> length<br />
was 58% (26/45), for vessels over 4.8m <strong>in</strong> length the wear rate was 45% (69/152) and for vessels of an<br />
unspecified length the wear rate was 28% (9/32) (Table 9). There were 9 solo operators on vessels over<br />
4.8m <strong>in</strong> length, one-third reportedly wear<strong>in</strong>g a PFD at the time of the ‘serious <strong>in</strong>cident’.<br />
38
Table 9<br />
Recreational vessel ‘serious <strong>in</strong>cidents’ by grouped vessel length and PFD wear, <strong>Mar<strong>in</strong>e</strong><br />
Incident <strong>Report</strong><strong>in</strong>g system <strong>2007</strong>/8<br />
Variable<br />
VESSEL LENGTH<br />
4.8m Unspecified<br />
length<br />
All vessels<br />
Total number of vessels 37 95 33 165<br />
Number of vessels for which the<br />
26 54 12 92<br />
number of persons on board was<br />
recorded<br />
Total number of persons onboard<br />
45 152 32 229<br />
these vessels<br />
Number of persons wear<strong>in</strong>g a PFD<br />
26 69 9 104<br />
on these vessels<br />
PFD wear rate 58% 45% 28% 45%<br />
The serious <strong>in</strong>cident report form requires <strong>in</strong>formation on age, gender, activity and role to be completed on<br />
the person <strong>in</strong> charge of the vessel and any other persons <strong>in</strong>volved. As <strong>in</strong> previous years, these data are<br />
poorly reported. Data on age and gender of persons on board were recorded for only 67 <strong>in</strong>cidents (40%).<br />
The person’s ‘activity’ and helm operator’s ‘role’ on the vessel was completed for even fewer cases, 23% and<br />
1% of ‘serious <strong>in</strong>cidents’ respectively.<br />
The operators licence status was miss<strong>in</strong>g or undef<strong>in</strong>ed for 64% of <strong>in</strong>cidents compared with 69% <strong>in</strong> 2006/7.<br />
Fifty-seven vessel operators (35%) held a current Recreational Boat Operators Licence. One operator had<br />
surrendered his licence and another was a disqualified operator.<br />
5.3.5 Seasonal distribution<br />
Figure 5 (<strong>in</strong> section 5.2.4) shows the seasonal pattern of recreational mar<strong>in</strong>e <strong>in</strong>cidents, presented separately<br />
for ‘response only’ and ‘serious <strong>in</strong>cidents’. The frequency of serious <strong>in</strong>cidents was higher <strong>in</strong> December<br />
(14.5%), January (17%) and March (17%) than <strong>in</strong> other months of the year. There were few <strong>in</strong>cidents <strong>in</strong> the<br />
4-month period May to August (12% <strong>in</strong> all).<br />
5.3.6 Type of water and environmental conditions<br />
Recreational serious <strong>in</strong>cidents mostly occurred <strong>in</strong> enclosed waters (73%), followed by coastal offshore<br />
waters (12%) and <strong>in</strong>land waters (10%). Thirty-seven percent of reported ‘serious <strong>in</strong>cidents’ occurred on Port<br />
Phillip (n=61). Other common locations were Gi<strong>pp</strong>sland Lakes (n=28, 17%), Bass Strait (n=19, 11%) and<br />
Western Port (n=18, 11%).<br />
Table 10 summarises the weather and water conditions <strong>in</strong> which ‘serious <strong>in</strong>cidents’ <strong>in</strong>volv<strong>in</strong>g recreational<br />
vessels occurred. Water and environmental conditions were not reported for between 11% and 20% of<br />
<strong>in</strong>cidents. Most serious <strong>in</strong>cidents occurred <strong>in</strong> clear weather with good visibility and w<strong>in</strong>d speeds up to 8<br />
knots. High proportions of swamp<strong>in</strong>g (62%), capsiz<strong>in</strong>g (50%) and vessel loss (60%) <strong>in</strong>cidents occurred <strong>in</strong><br />
cho<strong>pp</strong>y, rough or very rough water conditions.<br />
<strong>Mar<strong>in</strong>e</strong> <strong>Safety</strong> <strong>in</strong> <strong>Victoria</strong>: July <strong>2007</strong> to June <strong>2008</strong> 39
Table 10 Recreational ‘serious <strong>in</strong>cidents’ by environmental conditions, <strong>Mar<strong>in</strong>e</strong><br />
Incident <strong>Report</strong><strong>in</strong>g system <strong>2007</strong>/8<br />
N %<br />
Weather<br />
clear 119 <strong>72</strong><br />
hazy 8 5<br />
cloudy 15 9<br />
ra<strong>in</strong> 5 3<br />
undef<strong>in</strong>ed/unknown 18 11<br />
Water conditions<br />
calm 88 53<br />
cho<strong>pp</strong>y 44 27<br />
rough 8 5<br />
very rough 6 4<br />
strong current 2 1<br />
undef<strong>in</strong>ed/unknown 17 10<br />
Visibility<br />
good 118 <strong>72</strong><br />
fair 16 10<br />
poor 6 4<br />
undef<strong>in</strong>ed/unknown 25 15<br />
W<strong>in</strong>d speed<br />
none 18 11<br />
1-8 knots 57 35<br />
9-15 knots 37 22<br />
16-30 knots 10 6<br />
over 30 knots 10 6<br />
undef<strong>in</strong>ed/unknown 33 20<br />
5.3.7 Contributory factors to recreational serious <strong>in</strong>cidents<br />
Contributory factors were recorded for 90% of recreational vessel <strong>in</strong>cidents (n=148). Up to 9 contributory<br />
factors were recorded per <strong>in</strong>cident, with 322 separate factors recorded. Table 11 summarises the results<br />
of the detailed analysis of contributory factors. Unlike ‘response only’ <strong>in</strong>cidents where equipment and<br />
material factors were the major contributors, serious <strong>in</strong>cidents most commonly <strong>in</strong>volved human factors<br />
(n=208, 65%), followed by environmental factors (n=61, 19%) then material factors (n=53, 17%).<br />
As shown <strong>in</strong> Table 11, 208 human factors were implicated <strong>in</strong> 115 <strong>in</strong>cidents, the most common of which<br />
were errors of judgement, <strong>in</strong>experience, failure to keep proper lookout and navigational errors. A<br />
total of 61 separate environmental factors were reported across 49 <strong>in</strong>cidents, most commonly sea or<br />
w<strong>in</strong>d conditions, followed by tidal and bar conditions. Last, 53 separate material factors were reported<br />
across 46 <strong>in</strong>cidents, most commonly mach<strong>in</strong>ery failure, followed by <strong>in</strong>adequate stability then electrical<br />
equipment failure.<br />
40
Table 11 Factors contribut<strong>in</strong>g to recreational ‘serious <strong>in</strong>cidents’, <strong>Mar<strong>in</strong>e</strong> Incident <strong>Report</strong><strong>in</strong>g system<br />
<strong>2007</strong>/8 (n=322 factors)<br />
N %<br />
Human factors<br />
Error <strong>in</strong> judgement 83 25.8<br />
Inexperience 39 12.1<br />
Failure to keep proper lookout 19 5.9<br />
Navigational error 18 5.6<br />
Insecure moor<strong>in</strong>g 8 2.5<br />
Alcohol or drugs 3 0.9<br />
Excessive speed 12 3.7<br />
Lack of ma<strong>in</strong>tenance 6 1.9<br />
Unable to swim 2 0.6<br />
Fatigue 3 0.9<br />
Ill health 2 0.6<br />
Lack of fuel 2 0.6<br />
Overload<strong>in</strong>g 1 0.3<br />
Other human factor 10 3.1<br />
Sub total 208 64.6<br />
Environmental factors<br />
W<strong>in</strong>d/sea state 23 7.1<br />
Tidal conditions 12 3.8<br />
Bar conditions 10 3.1<br />
Restricted visibility 4 1.2<br />
Float<strong>in</strong>g or submerged object 3 0.9<br />
Wash 3 0.9<br />
Other environmental factors 6 1.9<br />
Sub total 61 18.9<br />
Material factors<br />
Mach<strong>in</strong>ery 20 6.2<br />
Inadequate stability 8 2.5<br />
Electrical equipment 7 2.2<br />
Hull failure 5 1.6<br />
Rig failure 2 0.6<br />
Inadequate buoyancy 3 0.9<br />
Other material factors 8 2.5<br />
Sub-total 53 16.5<br />
TOTAL 322 100<br />
<strong>Mar<strong>in</strong>e</strong> <strong>Safety</strong> <strong>in</strong> <strong>Victoria</strong>: July <strong>2007</strong> to June <strong>2008</strong> 41
5.4 Fatalities and hospital-treated recreational boat<strong>in</strong>g-related<br />
<strong>in</strong>juries 2006/7<br />
There were two boat<strong>in</strong>g-related drown<strong>in</strong>g fatalities recorded on the National Coroners Information<br />
System (NCIS) and 902 hospital-treated recreational boat<strong>in</strong>g <strong>in</strong>jury cases (223 admissions and 679 ED<br />
presentations, non admissions) recorded on hospital <strong>in</strong>jury surveillance databases over the period July<br />
2006 to June <strong>2007</strong>. MIR system data for 2006/7 (reported last year) showed 3 fatal and<br />
5.4.1 Deaths (n=3)<br />
Fatality data analysed here are for cases recorded <strong>in</strong> 2006/7, whereas MIR fatalities reported earlier are for<br />
<strong>2007</strong>/8. Fatality data were sourced from the NCIS.<br />
Accord<strong>in</strong>g to the NCIS there were three recreational boat<strong>in</strong>g-related <strong>in</strong>jury fatalities <strong>in</strong> <strong>Victoria</strong> <strong>in</strong> 2006/7,<br />
the same number as <strong>in</strong> 2005/6. All three deaths were fishers, one drowned after fall<strong>in</strong>g <strong>in</strong>to the water from<br />
a powered half-cab<strong>in</strong> vessel when putt<strong>in</strong>g out craypots, another had a heart attack and fell <strong>in</strong>to the water<br />
and drowned and the third was found dead <strong>in</strong> the water with his life jacket and some fish<strong>in</strong>g l<strong>in</strong>e tangled<br />
around his wrist. None was wear<strong>in</strong>g a PFD when retrieved from the water.<br />
The same three deaths were recorded on the MIR system <strong>in</strong> 2006/7 and were <strong>in</strong>cluded <strong>in</strong> MUARC’s last<br />
report. The other two deaths recorded on the MIR system <strong>in</strong> 2006/7 were recreational vessel ‘response<br />
only’ <strong>in</strong>cidents – the drown<strong>in</strong>g deaths of a boogie boarder and a scuba diver – and are not ‘<strong>in</strong> scope’ for<br />
boat<strong>in</strong>g related <strong>in</strong>jury deaths on the NCIS.<br />
The circumstances of the three boat<strong>in</strong>g-related fatalities recorded on the NCIS for 2006/7 were as follows.<br />
A common recorded contributory factor to all the fatal <strong>in</strong>cidents was non-wear<strong>in</strong>g of PFD.<br />
• The deceased, a 57 year-old male, and a friend were fish<strong>in</strong>g <strong>in</strong> a 4.9m half cab<strong>in</strong> cruiser. Neither was<br />
wear<strong>in</strong>g a Personal Flotation Device (PFD). Whilst putt<strong>in</strong>g out some clay pots, the deceased fell <strong>in</strong>to the<br />
water. The friend tried to assist, however a wave hit the boat on he side, caus<strong>in</strong>g it to roll. The friend<br />
was thrown <strong>in</strong>to the water. The friend was rescued but the deceased was not. The Coroner <strong>in</strong>dicated<br />
that it was likely that had the deceased been wear<strong>in</strong>g a PFD, he would not have drowned.<br />
• The deceased, a 32 year-old male, was fish<strong>in</strong>g <strong>in</strong> a small boat a<strong>pp</strong>roximately one km off shore. He<br />
was seen by witnesses to be doubl<strong>in</strong>g over, was heard to make an unusual loud noise and then fell<br />
<strong>in</strong>to the water. He was not wear<strong>in</strong>g a PFD. Witnesses found the deceased motionless and face down<br />
<strong>in</strong> the water. The Coroner <strong>in</strong>dicated that, had the deceased been wear<strong>in</strong>g a PFD, there is a chance<br />
that the outcome may have been different. Death was attributed to coronary artery arthrosclerosis <strong>in</strong><br />
circumstances suggestive of drown<strong>in</strong>g.<br />
• The deceased, a 73 year-old male, left his home to go fish<strong>in</strong>g (a regular pastime) <strong>in</strong> his 5.5m. timber<br />
boat. When he did not return home, a search was conducted. The boat was located about 800 metres<br />
off shore with the lights on and anchor up. The eng<strong>in</strong>e was idl<strong>in</strong>g <strong>in</strong> neutral. The deceased was found<br />
<strong>in</strong> the water, float<strong>in</strong>g on his back. A life jacket was tangled around his wrist.<br />
42
5.4.2 Hospital-treated <strong>in</strong>jury (n=902 cases)<br />
Over the 12-month period July 2006 to June <strong>2007</strong>, there were 223 hospital admissions and 679 ED<br />
presentations (non-admissions) for boat<strong>in</strong>g-related sport and recreational <strong>in</strong>juries recorded on the VAED<br />
and the VEMD respectively. This represents a 5% decrease <strong>in</strong> the number of hospital treated <strong>in</strong>juries<br />
recorded <strong>in</strong> 2005/6. Broken down by severity, there was a 9% decrease <strong>in</strong> VAED cases (hospitalisations) and<br />
a 7% decrease <strong>in</strong> VEMD cases (ED presentations, non-admissions). This follows several years of <strong>in</strong>creases<br />
(31% from 2004/5 to 2005/6 and 36% from 2003/4 to 2004/5).<br />
Table 12 compares the pattern of <strong>in</strong>jury for admissions and ED presentations (non-admissions); the key<br />
po<strong>in</strong>ts are as follows:<br />
• Males were grossly over-represented <strong>in</strong> both admissions and ED presentations, account<strong>in</strong>g for 74% of all<br />
hospital-treated recreational boat<strong>in</strong>g <strong>in</strong>jury cases. This is probably related to their higher participation<br />
rate <strong>in</strong> recreational boat<strong>in</strong>g sports.<br />
• Age groups 15-29 and 30-34 years accounted for 35% and 29% of admissions and 41% and 26% of ED<br />
presentations, respectively, for boat<strong>in</strong>g-related <strong>in</strong>jury <strong>in</strong> 2006/7. This is most likely related to the higher<br />
participation of these two age groups <strong>in</strong> boat<strong>in</strong>g-related sports and recreational activities.<br />
• Hospital-treated <strong>in</strong>jury cases mostly occurred <strong>in</strong> water ski<strong>in</strong>g, wakeboard<strong>in</strong>g and <strong>in</strong>flatable rid<strong>in</strong>g<br />
(41% of admissions and 44% ED presentations), general boat<strong>in</strong>g (15% of admissions and 36% ED<br />
presentations) and PWC rid<strong>in</strong>g (13% of admissions and 8% of ED presentations).<br />
• The major specific causes of <strong>in</strong>jury were: falls (24% of admissions and 32% of ED presentations) and hit/<br />
struck/crush <strong>in</strong>juries <strong>in</strong>volv<strong>in</strong>g objects (13% of admissions and 32% of ED presentations). There were 9<br />
non-fatal drown<strong>in</strong>g/submersion hospital-treated cases <strong>in</strong> 2006/7 compared with 22 <strong>in</strong> 2005/6.<br />
• The lower extremity was the most commonly <strong>in</strong>jured body site for both admissions and presentations,<br />
account<strong>in</strong>g for 32% of all hospital treated <strong>in</strong>jury, followed by the u<strong>pp</strong>er extremity (25%) and head/face/<br />
neck (22%).<br />
• Forty-four percent of admissions were fracture cases, most commonly knee and lower leg fractures<br />
(29% of fracture cases). Dislocations/spra<strong>in</strong>s/stra<strong>in</strong>s were the next most frequent type of <strong>in</strong>jury (13%,<br />
mostly shoulder dislocations). Among ED presentations, open wounds (26%) and spra<strong>in</strong>s/stra<strong>in</strong>s (21%)<br />
were common <strong>in</strong>juries.<br />
<strong>Mar<strong>in</strong>e</strong> <strong>Safety</strong> <strong>in</strong> <strong>Victoria</strong>: July <strong>2007</strong> to June <strong>2008</strong> 43
Table 12 Pattern of hospital-treated recreational boat<strong>in</strong>g <strong>in</strong>jury,<br />
<strong>Victoria</strong> July 1, 2006 to June 30, <strong>2007</strong> (n=902 cases)<br />
Hospital–treated recreational boat<strong>in</strong>g <strong>in</strong>jury<br />
Characteristics Admissions (VAED) ( n = 223) ED Presentations (VEMD) (n = 679)<br />
Gender • male (78%) • male (73%)<br />
• female (27%) • female (27%)<br />
Age group <strong>in</strong> years • 0-14 (5%) • 0-14 (11%)<br />
Activity/ Watercraft<br />
• 15-29 (35%) • 15-29 (40%)<br />
• 30-44 (29%) • 30-44 (26%)<br />
• 45-59 (21%) • 45-59 (16%)<br />
• 60+ (11%) • 60+ (7%)<br />
• Water ski<strong>in</strong>g and other towed sports<br />
{41% mostly waterski<strong>in</strong>g and<br />
wakeboard<strong>in</strong>g (95%) and <strong>in</strong>flatable<br />
rid<strong>in</strong>g (5%)}<br />
• Personal Watercraft (jet ski) (13%)<br />
• W<strong>in</strong>dsurf<strong>in</strong>g/kitesurf<strong>in</strong>g (9%)<br />
• Yacht<strong>in</strong>g and sail<strong>in</strong>g (7%)<br />
• Fish<strong>in</strong>g from a boat (8%)<br />
• Passenger craft (3%)<br />
• Canoe<strong>in</strong>g/kayak<strong>in</strong>g (2%)<br />
• Raft<strong>in</strong>g (2%)<br />
• Row<strong>in</strong>g/scull<strong>in</strong>g (0.4%)<br />
• Surfboat<strong>in</strong>g (0.4)<br />
• Unspecified boat<strong>in</strong>g (15%)<br />
• Water ski<strong>in</strong>g and other towed sports<br />
{44% mostly water ski<strong>in</strong>g (63%),<br />
wakeboard<strong>in</strong>g (18%), <strong>in</strong>flatable<br />
rid<strong>in</strong>g (8%), kneeboard<strong>in</strong>g (7%)}<br />
• Boat<strong>in</strong>g {36% mostly not further<br />
specified (93%), houseboat (5%),<br />
power boat<strong>in</strong>g (3%)}<br />
• Personal Watercraft (8%)<br />
• Sail<strong>in</strong>g (5%)<br />
• Fish<strong>in</strong>g from boat (1%)<br />
• Canoe/kayak<strong>in</strong>g (2%)<br />
• W<strong>in</strong>dsurf<strong>in</strong>g (2%)<br />
• Kite surf<strong>in</strong>g (1%)<br />
• Row<strong>in</strong>g (1%)<br />
• Raft<strong>in</strong>g (0.3%)<br />
Cause • Fall (24%)<br />
• On-board <strong>in</strong>cident (22%)<br />
• Hit/struck/crush (13%)<br />
• Accident to craft (7%)<br />
• Overexertion (5%)<br />
• Near drown<strong>in</strong>g/submersion (4%)<br />
• Cutt<strong>in</strong>g/pierc<strong>in</strong>g (1%)<br />
• Other/unspecified (25%)<br />
• Falls (32%)<br />
• Struck by/collision with object<br />
(32%)<br />
• Cutt<strong>in</strong>g/pierc<strong>in</strong>g (7%)<br />
• Transport (3%)<br />
• Struck by/collision with person (4%)<br />
• Mach<strong>in</strong>ery (1%)<br />
• Other/unspecified (21%)<br />
44
Hospital–treated recreational boat<strong>in</strong>g <strong>in</strong>jury cont<strong>in</strong>ued<br />
Characteristics Admissions (VAED) n = 244 ED Presentations (VEMD) n = 703<br />
Body site <strong>in</strong>jured<br />
Nature of <strong>in</strong>jury<br />
• Lower extremity {32% mostly knee/<br />
lower leg (63% of lower extremity<br />
<strong>in</strong>juries) and hip/thigh (24%)}<br />
• U<strong>pp</strong>er extremity {22%, mostly<br />
shoulder/u<strong>pp</strong>er arm (45% of u<strong>pp</strong>er<br />
extremity <strong>in</strong>juries) and wrist/hand<br />
(33%)}<br />
• Head/neck {23%: head (69%), neck<br />
(31%)}<br />
• Trunk {18%: abdomen/lower back/<br />
lumbar sp<strong>in</strong>e (51%) and thorax<br />
(49%)}<br />
• Other/unspecified/miss<strong>in</strong>g (6%)<br />
• Fractures {44%, mostly knee/ lower<br />
leg (29% of fractures), head (13%),<br />
wrist/hand (12%), and thorax (10%)<br />
• Dislocations/spra<strong>in</strong>/stra<strong>in</strong> {13%,<br />
mostly shoulder/u<strong>pp</strong>er arm (41%),<br />
knee/lower leg (24%)}<br />
• Open wound {7%, mostly knee/<br />
lower leg (33%) and head (27%)}<br />
• Injury to muscle/tendon (6%)<br />
• Intracranial (5%)<br />
• Injury to <strong>in</strong>ternal organs (4%)<br />
• Superficial (2%)<br />
• Injury to nerves/sp<strong>in</strong>al cord (2%)<br />
• Traumatic amputation (0.4%)<br />
• Other/unspecified/miss<strong>in</strong>g (17%)<br />
• Lower extremity {32%: foot (25%),<br />
lower leg (22%), knee (21%) and<br />
ankle (20%)}<br />
• U<strong>pp</strong>er extremity {26%: hand <strong>in</strong>cl.<br />
f<strong>in</strong>gers (34%), shoulder (26%), wrist<br />
(14%) and forearm (13%)}<br />
• Head, eyes, face and neck {22%<br />
mostly head (45%) and face (41%)}<br />
• Trunk (11%, mostly thorax (65%))<br />
• Other/unspecified (9%)<br />
• Open wound {26%: face (28%),<br />
head (25%), lower leg (12%), foot<br />
(10%), and hand (9%)}<br />
• Spra<strong>in</strong>/stra<strong>in</strong> {21%: ankle (15%),<br />
thorax (15%), foot (8%), wrist (7%)<br />
and neck (7%)}<br />
• Fracture {13%: foot/toe (21%),<br />
hand/f<strong>in</strong>ger (18%); ankle (11%) and<br />
thorax (11%)}<br />
• Superficial (10%)<br />
• Muscle/tendon (9%)<br />
• Dislocation (4%)<br />
• Foreign body (3%)<br />
• Intracranial (2%)<br />
• Crush<strong>in</strong>g <strong>in</strong>jury (2%)<br />
• Other/unspecified/miss<strong>in</strong>g (11%)<br />
Source: Hospital admissions: <strong>Victoria</strong>n Admitted Episodes Dataset (VAED)<br />
Hospital emergency department presentations (non-admissions): <strong>Victoria</strong>n Emergency M<strong>in</strong>imum Dataset (VEMD)<br />
<strong>Mar<strong>in</strong>e</strong> <strong>Safety</strong> <strong>in</strong> <strong>Victoria</strong>: July <strong>2007</strong> to June <strong>2008</strong> 45
5.4.2.1 Hospital admissions (n =223)<br />
Figure 7 shows the trend (rate per 100,000 population) for recreational boat<strong>in</strong>g-related <strong>in</strong>jury hospital<br />
admissions from July 1999 to June <strong>2007</strong>. Reliable and comprehensive participation data are not available<br />
to form the denom<strong>in</strong>ator. The general trend upward is most probably due to <strong>in</strong>jury surveillance data<br />
system improvements.<br />
The annual frequency of admissions for recreational boat<strong>in</strong>g-related <strong>in</strong>juries showed a steady upward<br />
trend over the 6-year period from 1999/2000 to 20005/06 (from an average of 100 cases per year over<br />
the 3-year period 1999/2000 to 2001/2 to 244 cases <strong>in</strong> 2005/06). In 2006/7, the annual frequency of<br />
admissions reduced to 223. This may be a result of deteriorat<strong>in</strong>g case capture follow<strong>in</strong>g the f<strong>in</strong>ish of<br />
the MSV-funded hospital-treated boat<strong>in</strong>g <strong>in</strong>jury call back study. Of the 223 hospitalisations, 100 (44%)<br />
were recorded under the water transport cause of <strong>in</strong>jury codes and 127 (57%) under the expanded<br />
activity codes.<br />
Figure 7 Trend <strong>in</strong> the frequency and rate (per 100,000 population) of recreational boat<strong>in</strong>g-related<br />
hospital admissions by year, <strong>Victoria</strong> 1999/2000 to 2006/<strong>2007</strong><br />
250<br />
200<br />
Frequency<br />
Rate per 100,000 population<br />
6.0<br />
5.0<br />
Frequency<br />
150<br />
100<br />
50<br />
4.0<br />
3.0<br />
2.0<br />
1.0<br />
Rate per 100,000 population<br />
0<br />
199900 200001 200102 200203 200304 200405 200506 200607<br />
F<strong>in</strong>ancial year<br />
0.0<br />
Source: <strong>Victoria</strong>n Admitted Episodes Dataset (VAED)<br />
Figure 8 shows <strong>in</strong>jury admission rates (per 100,000 population) by age and gender. Rates were higher for<br />
males than females <strong>in</strong> most 5-year age groups, with the exception of 10-14 year olds where the female<br />
rate was slightly higher than the male rate. The highest rates for boat<strong>in</strong>g-related <strong>in</strong>jury admissions were<br />
observed <strong>in</strong> males aged 20-24 years, 30-34 years and 25-29 years (13.2, 12.4 and 11.5 admissions per<br />
100,000 male population, respectively). We cannot conclude that males are at higher absolute risk of<br />
serious <strong>in</strong>jury <strong>in</strong> boat<strong>in</strong>g-related recreational activities than females because available participation data<br />
<strong>in</strong>dicate that male exposure to boat<strong>in</strong>g activities is much higher than females (SRV, 2003).<br />
46
Figure 8 Rate of recreational boat<strong>in</strong>g-related hospital admissions per 100,000<br />
population by age and gender, <strong>Victoria</strong> July 1, 2006 to June 30, <strong>2007</strong><br />
(n=223)<br />
14<br />
12<br />
Rate per 100,000 population<br />
10<br />
8<br />
6<br />
4<br />
Male<br />
Female<br />
2<br />
0<br />
0–4 5–9 10–14 15–19 20–24 25–29 30–34 35–39 40–44 45–49 50–54 55–59 60–64 65–69 70–74 75–79 80–84 85+<br />
Age group<br />
Source: <strong>Victoria</strong>n Admitted Episodes Dataset (VAED)<br />
The major causes (mechanisms), body sites <strong>in</strong>jured and the nature of <strong>in</strong>jury are shown <strong>in</strong> Table<br />
12. Falls (24%), onboard <strong>in</strong>cidents (22%) and hit/struck/crush (13%) were the lead<strong>in</strong>g causes of admissions.<br />
The major <strong>in</strong>jury diagnosis was fracture (44%), most frequently affect<strong>in</strong>g the knee/lower leg (29% of<br />
fracture cases), head (13%) wrist/hand (12%) and thorax (10%). Dislocation/spra<strong>in</strong>/stra<strong>in</strong> accounted for<br />
13% of <strong>in</strong>jury diagnoses, most commonly affect<strong>in</strong>g the shoulder/u<strong>pp</strong>er arm (41% of dislocation/spra<strong>in</strong>/<br />
stra<strong>in</strong> <strong>in</strong>jury cases). Overall, the most common specific <strong>in</strong>jury was fracture of the lower leg/knee (13% of all<br />
hospital admissions).<br />
Fifty-n<strong>in</strong>e percent of hospital admitted cases had a length of stay of less than 2 days, 32% stayed 2-7 days,<br />
8% stayed 8-30 days and 1% (n= 2 cases) stayed more than 30 days.<br />
Table 13 shows the length of stay <strong>in</strong> hospital by water craft/activity type.<br />
<strong>Mar<strong>in</strong>e</strong> <strong>Safety</strong> <strong>in</strong> <strong>Victoria</strong>: July <strong>2007</strong> to June <strong>2008</strong> 47
Table 13 Recreational boat<strong>in</strong>g-related <strong>in</strong>jury admissions by water craft/activity type and length of<br />
hospital stay, <strong>Victoria</strong> July 1, 2006 to June 30, <strong>2007</strong> (n=223)<br />
Length of stay (days)<br />
Figure 9 Frequency of recreational boat<strong>in</strong>g-related <strong>in</strong>jury ED presentations (non-admissions) by<br />
age and sex, <strong>Victoria</strong> July 1, 2006 to June 30, <strong>2007</strong> (n=679)<br />
90<br />
80<br />
70<br />
Frequency<br />
60<br />
50<br />
40<br />
Male<br />
Female<br />
30<br />
20<br />
10<br />
0<br />
0–4 5–9 10–14 15–19 20–24 25–29 30–34 35–39 40–44 45–49 50–54 55–59 60–64 65–69 70–74 75–79 80+<br />
Age group<br />
Source: <strong>Victoria</strong>n Emergency M<strong>in</strong>imum Dataset (VEMD)<br />
Results of other analyses are summarised <strong>in</strong> Table 12. Falls and collisions with objects (both 32%) were<br />
the major causes of ED presentations. Open wounds (26%) and spra<strong>in</strong>s and stra<strong>in</strong>s (21%) were the most<br />
frequent <strong>in</strong>jury diagnoses and the lower extremity (32%) and u<strong>pp</strong>er extremity (26%) the most common<br />
body regions <strong>in</strong>jured.<br />
The most common specific <strong>in</strong>juries among ED presentations were open wound to the face or head<br />
(14% of all recreational boat<strong>in</strong>g-related <strong>in</strong>jury ED presentations), shoulder dislocation and ankle spra<strong>in</strong>s<br />
(each 3%).<br />
5.5 Rank<strong>in</strong>g of recreational boat<strong>in</strong>g-related activities for <strong>in</strong>jury<br />
The boat<strong>in</strong>g-related recreational activities most frequently related to fatalities and hospital-treated<br />
<strong>in</strong>jury are shown <strong>in</strong> Table 14, ranked on <strong>in</strong>jury frequency. The rank<strong>in</strong>g is tentative because case<br />
frequency data for hospital admissions and ED presentations underestimate the size of the problem due<br />
to under-report<strong>in</strong>g.<br />
<strong>Mar<strong>in</strong>e</strong> <strong>Safety</strong> <strong>in</strong> <strong>Victoria</strong>: July <strong>2007</strong> to June <strong>2008</strong> 49
Table 14 Provisional rank<strong>in</strong>g of boat<strong>in</strong>g-related recreational activities based on frequency of<br />
fatalities and hospital-treated <strong>in</strong>jury cases, <strong>Victoria</strong> July 1, 2006 to June 30, <strong>2007</strong><br />
Deaths<br />
(NCIS)<br />
(n=2)<br />
Hospital<br />
Admissions<br />
(VAED)<br />
(n=223)<br />
ED<br />
presentations 1<br />
(VEMD)<br />
(n=679<br />
N % N % N %<br />
1. Water ski<strong>in</strong>g and other towed sports - - 91 41 297 44<br />
2. Motor boat<strong>in</strong>g/boat<strong>in</strong>g unspecified - - 41 18 238 35<br />
3. Personal Water Craft (PWC) rid<strong>in</strong>g - - 29 13 51 8<br />
4. Sail<strong>in</strong>g - - 16 7 37 5<br />
5. W<strong>in</strong>d/Kite surf<strong>in</strong>g - - 19 9 20 3<br />
6. Fish<strong>in</strong>g from a boat 3 100 17 (2) 8 11 2<br />
Source: National Coroner’s Information System, <strong>Victoria</strong>n Office (fatalities), VAED (hospital admissions) and VEMD (ED presentations)<br />
Note:<br />
(1) ED presentations data underestimate the size of the problem because identification of cases relies on specific <strong>in</strong>formation on<br />
activity be<strong>in</strong>g <strong>in</strong>cluded <strong>in</strong> text narratives, which vary <strong>in</strong> quality by hospital<br />
(2) Admissions for ‘fish<strong>in</strong>g from a boat’ are underestimated as the activity cod<strong>in</strong>g does not disaggregate fish<strong>in</strong>g from a boat from<br />
other fish<strong>in</strong>g. Only 17 cases were identifiable as fish<strong>in</strong>g from a boat based on the fact that their activity code was fish<strong>in</strong>g and<br />
they attracted one of the ‘Water transport accident’ external cause of <strong>in</strong>jury codes.<br />
5.5.1 Towed water sports (n=388)<br />
Towed water sports <strong>in</strong>clude water ski<strong>in</strong>g, wake or knee board<strong>in</strong>g, and rid<strong>in</strong>g on <strong>in</strong>flatables (tubes, biscuits<br />
etc). Cod<strong>in</strong>g issues <strong>in</strong> both hospital datasets results <strong>in</strong> underestimation of cases.<br />
In the VAED (the hospital admissions dataset) waterski<strong>in</strong>g, wakeboard<strong>in</strong>g and ski board<strong>in</strong>g cases are<br />
grouped together under the one sports activity code ‘Waterski<strong>in</strong>g’ and cases cannot be disaggregated. The<br />
VAED cod<strong>in</strong>g manual does not specify where kneeboard<strong>in</strong>g should be classified. Tub<strong>in</strong>g is classified with<br />
water slid<strong>in</strong>g under the ‘other specified <strong>in</strong>dividual water sport’ code and cases cannot be disaggregated.<br />
N<strong>in</strong>ety-one admissions <strong>in</strong> 2006/7 attracted a towed water sport code.<br />
ED presentations are selected by text search<strong>in</strong>g VEMD case narrative data. The quality of cases narratives<br />
varies across the 38 hospitals that contribute data. The text search identified 297 cases.<br />
There were 388 hospital-treated <strong>in</strong>juries related to towed water sports <strong>in</strong> 2006/7 (91 admissions and 297<br />
presentations) compared with 3<strong>72</strong> <strong>in</strong> 2005/6 (81 admissions and 291 ED presentations). The trend from<br />
1999/2000 to <strong>2007</strong>/8 is shown <strong>in</strong> Figure 10.<br />
50
Figure 10 Trend <strong>in</strong> the frequency of hospital-treated towed water sports <strong>in</strong>jury, <strong>Victoria</strong> July 1999<br />
to June <strong>2007</strong><br />
350<br />
291<br />
297<br />
300<br />
Admissions<br />
Presentations<br />
250<br />
Frequency<br />
200<br />
150<br />
191<br />
242<br />
100<br />
118<br />
122<br />
137<br />
140<br />
74<br />
93<br />
81<br />
91<br />
50<br />
0<br />
33<br />
15 17<br />
49<br />
199900 200001 200102 200203 200304 200405 200506 200607<br />
F<strong>in</strong>ancial year<br />
Sources: <strong>Victoria</strong>n Admitted Episodes Dataset (VAED) and <strong>Victoria</strong>n Emergency M<strong>in</strong>imum Dataset (VEMD)<br />
In 2006/7, the peak age group for towed water sports hospital-treated <strong>in</strong>jury cases was persons aged 20-24<br />
year (Figure 11), followed by persons aged 15-19 (Figure 11).<br />
<strong>Mar<strong>in</strong>e</strong> <strong>Safety</strong> <strong>in</strong> <strong>Victoria</strong>: July <strong>2007</strong> to June <strong>2008</strong> 51
Figure 11<br />
Hospital-treated towed water sports <strong>in</strong>jury by age group, <strong>Victoria</strong> July 1, 2006 to<br />
June 30, <strong>2007</strong> (n=388)<br />
Percentage of admissions and presentations<br />
25<br />
20<br />
15<br />
10<br />
5<br />
0<br />
Admissions (n=91)<br />
Presentations (n=297)<br />
5–9 10–14 15–19 20–24 25–29 30–34 35–39 40–44 45–49 50–54 55–59<br />
Age group<br />
Sources: <strong>Victoria</strong>n Admitted Episodes Dataset (VAED) and <strong>Victoria</strong>n Emergency M<strong>in</strong>imum Dataset (VEMD)<br />
5.5.1.1 Hospital admissions (n =91)<br />
In 2006/7, towed water sports accounted for 41% of all admissions for recreational boat<strong>in</strong>g-related <strong>in</strong>juries.<br />
There were 91 admissions for towed water sports <strong>in</strong> 2006/7 (86 of which were related to water ski<strong>in</strong>g and<br />
wakeboard<strong>in</strong>g) resum<strong>in</strong>g the upward trend evident from 1999/2000 to 2004/5 (Figure 10).<br />
Males were over represented (77%). The age groups with higher <strong>in</strong>jury frequency were 20-24 year olds<br />
(23%), followed by 15-19 years olds (19%) and 30-34 year olds (15%).<br />
Injuries were mostly to the lower extremity (34%) and head and face (22%). Injuries to the u<strong>pp</strong>er extremity<br />
(25%) and the trunk (12%) accounted for most of the rema<strong>in</strong><strong>in</strong>g cases. Thirty-five percent of towed water<br />
sport admissions were fractures and 21% were dislocations, spra<strong>in</strong>s and stra<strong>in</strong>s. The most common specific<br />
<strong>in</strong>juries were knee and lower leg fractures (11%), shoulder and u<strong>pp</strong>er arm dislocation/spra<strong>in</strong>/stra<strong>in</strong> (9%),<br />
knee and lower leg dislocation/spra<strong>in</strong>/stra<strong>in</strong> (7%).<br />
Sixty-eight percent of towed water sport <strong>in</strong>jury cases stayed <strong>in</strong> hospital less than 2 days, 24% stayed 2-7<br />
days and 8% stayed 8-30 days.<br />
The major causes of <strong>in</strong>jury were: falls (44%), hit/struck/crush (11%), and over exertion (9%). The VAED<br />
does not provide any detail of the circumstances of the <strong>in</strong>jury. However, analysis of case narrative data<br />
for admissions recorded on the VEMD (n = 29) provided some more <strong>in</strong>formation on the circumstances of<br />
<strong>in</strong>jury. Injury scenarios <strong>in</strong>cluded the follow<strong>in</strong>g:<br />
52
• Waterski<strong>in</strong>g: arm caught <strong>in</strong> rope, rope burn to arm, deglov<strong>in</strong>g <strong>in</strong>jury to foot from ski rope, whiplash to<br />
neck, hit a tree, hit a branch, water <strong>in</strong> eye and lost corneal transplant, boat ran over legs, fell, ‘accident at<br />
160k/h’.<br />
• Wakeboard<strong>in</strong>g: fell from wakeboard, fell fractur<strong>in</strong>g hip, struck by boat propeller, twisted foot<br />
• Kneeboard<strong>in</strong>g: fell off kneeboard, skied <strong>in</strong>to boat, collided with stationary houseboat<br />
• Towed <strong>in</strong>flatable: fell off sea biscuit, fell on tube and struck nose on sibl<strong>in</strong>g’s knee<br />
5.5.1.2 Hospital ED presentations (non-admissions) (n = 297)<br />
Forty-one percent of the recreational boat<strong>in</strong>g-related <strong>in</strong>jury ED presentations <strong>in</strong> 2006/7 were associated<br />
with water ski<strong>in</strong>g and related towed water sports, the same proportion as <strong>in</strong> 2005/6. There were 6 more<br />
towed water sport <strong>in</strong>jury presentations <strong>in</strong> 2006/7, compared with the previous year (Figure 10). Sixty-three<br />
percent (n=188) of ED presentations for towed water sports <strong>in</strong>juries were related to water ski<strong>in</strong>g; a further<br />
18% (n=54) to wakeboard<strong>in</strong>g, 7% to kneeboard<strong>in</strong>g and 12% (n=36) to biscuit and <strong>in</strong>flatable tube rid<strong>in</strong>g.<br />
Overall, 76% of ED presentations were male. Males were over-represented <strong>in</strong> ED presentations for all<br />
towed water sports activities but not to the same degree: waterski<strong>in</strong>g (80% male), wakeboard<strong>in</strong>g (78%);<br />
kneeboard<strong>in</strong>g (65%); and <strong>in</strong>flatable rid<strong>in</strong>g (54%).<br />
Overall, the 5-year age group with the highest frequency of <strong>in</strong>jury was persons aged 20-24 years (23%),<br />
followed by persons aged 15-19 (21%) (Figure 12). This pattern was evident <strong>in</strong> three of the four water<br />
sports. Injured kneeboarders tended to be older, with 25-29 year olds rank<strong>in</strong>g second on frequency of<br />
ED presentations.<br />
<strong>Mar<strong>in</strong>e</strong> <strong>Safety</strong> <strong>in</strong> <strong>Victoria</strong>: July <strong>2007</strong> to June <strong>2008</strong> 53
Figure 12<br />
ED presentations for towed water sports <strong>in</strong>jury by age group, <strong>Victoria</strong> July 1, 2006 to<br />
June 30, <strong>2007</strong> (n=388)<br />
45<br />
40<br />
35<br />
Frequency<br />
30<br />
25<br />
20<br />
waterski<strong>in</strong>g<br />
wakeboard<strong>in</strong>g<br />
kneeboard<strong>in</strong>g<br />
towed <strong>in</strong>flatable rid<strong>in</strong>g<br />
15<br />
10<br />
5<br />
0<br />
5–9 10–14 15–19 20–24 25–29 30–34 35–39 40–44 45–49 50–54 55–59<br />
Age group<br />
Source: <strong>Victoria</strong>n Emergency M<strong>in</strong>imum Dataset (VEMD)<br />
The lower extremity was the most frequently <strong>in</strong>jured body region (31%), mostly the knee (9% of all ED<br />
presentations for towed watersport <strong>in</strong>juries), foot (6%) and ankle (7%). Other commonly <strong>in</strong>jured body<br />
regions were the head/face/neck [28%, mostly the face (12% of all ED presentations for towed water sport<br />
<strong>in</strong>juries) and head (11%)] and the lower extremity [25%, mostly the forearm (5% of all ED presentations for<br />
towed water sport <strong>in</strong>juries) and the hand <strong>in</strong>clud<strong>in</strong>g f<strong>in</strong>gers (also 5%)].<br />
Spra<strong>in</strong>s and stra<strong>in</strong>s accounted for 26% of ED presentations, followed by open wounds (23%), fractures<br />
(14%) and <strong>in</strong>juries to the muscles and tendons (13%). The most frequently occurr<strong>in</strong>g specific <strong>in</strong>juries were<br />
open wounds to the face/head (17% of towed water sport presentations), knee spra<strong>in</strong>/stra<strong>in</strong> (4%), ankle<br />
spra<strong>in</strong>/stra<strong>in</strong> (4%), and shoulder dislocation (4%).<br />
Analysis of coded and narrative data showed that falls (34%, mostly due to impact with water) and struck<br />
by/collision with an object (33%, ma<strong>in</strong>ly hit by the ski, ski rope or ski handle) were the major causes<br />
of <strong>in</strong>juries.<br />
54
5.5.2 Motor boat<strong>in</strong>g and boat<strong>in</strong>g not specified (n=279)<br />
There were 41 hospital admissions and 238 ED presentations for <strong>in</strong>juries that occurred <strong>in</strong> recreational<br />
motor boat<strong>in</strong>g and ‘other’ recreational boat<strong>in</strong>g. The type of vessel <strong>in</strong>volved <strong>in</strong> these <strong>in</strong>jury <strong>in</strong>cidents is not<br />
recorded on the VAED or well recorded on the VEMD.<br />
5.5.2.1 Hospital admissions (n = 41)<br />
Motor boat<strong>in</strong>g and general boat<strong>in</strong>g (not specified) cases accounted for 18% of all hospital admissions for<br />
recreational boat<strong>in</strong>g-related <strong>in</strong>juries. Males were over-represented <strong>in</strong> cases (70%). Admissions peaked <strong>in</strong><br />
45-49 year olds (20%), followed by 60-64 year olds (15%) then 40-44 year olds (10%).<br />
Injuries were most commonly to the lower extremity (34%), followed by the trunk (22%), the u<strong>pp</strong>er<br />
extremity (20%) and the head/face/neck (15%). Fractures accounted for 59% of hospitalisations, followed<br />
by dislocation/spra<strong>in</strong>/stra<strong>in</strong> (10%), <strong>in</strong>jury to muscle or tendon (7%) and open wounds (5%). The most<br />
common specific <strong>in</strong>juries were: lower knee and lower leg fracture (20%), rib fracture (10%) and elbow/<br />
forearm fracture (7%).<br />
Thirty-two percent of cases were admitted to hospital for less than 2 days, 61% stayed 2-7 days and 7%<br />
(n=3 cases) stayed 8-30 days. The longest stays (11, 14 and 15 days) were related to neck, hip and thigh<br />
and knee and lower leg <strong>in</strong>jury (fracture or <strong>in</strong>jury to muscle/tendon).<br />
The VAED does not <strong>in</strong>clude any descriptive data on the circumstances of the <strong>in</strong>jury. However, some<br />
admissions are also recorded on the VEMD and narrative data on these cases provide some details on the<br />
circumstances of the <strong>in</strong>jury. Injury scenarios <strong>in</strong>cluded:<br />
• Trips/slips/falls: Fell when boat buffeted by wave/rough sea; Lost foot<strong>in</strong>g, fell onto bar; Fell down steps<br />
while at party on cruise boat; Fell from steps on fly bridge onto swim platform then concrete; Fell<br />
off boat onto trailer; Fell <strong>in</strong>to water; Fell when boat hit pylon; Fell off top deck of houseboat; Tri<strong>pp</strong>ed<br />
carry<strong>in</strong>g a 100kg boat motor; Tri<strong>pp</strong>ed and fell; Sli<strong>pp</strong>ed climb<strong>in</strong>g off boat; Sli<strong>pp</strong>ed on wet pier ty<strong>in</strong>g up<br />
boat.<br />
• Hit/struck/crushed: Hand caught/crushed <strong>in</strong> boat eng<strong>in</strong>e/bait box; Hand caught between boat and<br />
ramp/car and boat trailer/ boat and jetty/ two boats/boat trailer; Foot caught <strong>in</strong> rope; Person crushed<br />
when on front of boat and the boat moved forward; Person crushed between boat and other object;<br />
Person hit by a boat.<br />
• Cutt<strong>in</strong>g/pierc<strong>in</strong>g: Cut by boat cha<strong>in</strong>; Cut leg.<br />
• Burn: Burnt by heater when it caught fire; Contact burn when fuel leaked and ignited.<br />
5.5.2.2 ED presentations (non-admissions) (n = 238)<br />
There was a 7% decrease <strong>in</strong> the number of ED presentations for motorised and general boat<strong>in</strong>g <strong>in</strong> 2006/7<br />
(n=238) compared with 2005/6 (n=255 cases).<br />
Just over two-thirds of the ED presentations were male (67%). Half were aged 30-49 years and a further<br />
quarter aged 15-29 years. Forty percent of <strong>in</strong>juries were to the lower extremity, 27% to the u<strong>pp</strong>er<br />
extremity, 16% to the head/face/neck and 11% to the trunk. The hand, <strong>in</strong>clud<strong>in</strong>g f<strong>in</strong>gers (14%), lower leg<br />
(13%), foot, <strong>in</strong>clud<strong>in</strong>g toes (10%); and head, exclud<strong>in</strong>g face (9%) were the most common specific <strong>in</strong>jury<br />
sites. The most common <strong>in</strong>jury diagnoses were: open wounds (34%); spra<strong>in</strong>s/stra<strong>in</strong>s (15%); fracture/<br />
dislocation (14%); superficial <strong>in</strong>jury (13%); crush <strong>in</strong>jury (6%); and <strong>in</strong>jury to muscle/tendons (5%).<br />
<strong>Mar<strong>in</strong>e</strong> <strong>Safety</strong> <strong>in</strong> <strong>Victoria</strong>: July <strong>2007</strong> to June <strong>2008</strong> 55
The major causes of <strong>in</strong>jury were: falls (33%, falls, trips and slips when on boat and falls overboard or when<br />
gett<strong>in</strong>g off the boat); be<strong>in</strong>g struck by, or collid<strong>in</strong>g with, an object (29%, mostly hitt<strong>in</strong>g aga<strong>in</strong>st a part of the<br />
boat body or a piece of equipment or entrapment of hands/f<strong>in</strong>gers or legs between boat and trailer/jetty<br />
etc.); and cutt<strong>in</strong>g/pierc<strong>in</strong>g by an object (12%, mostly the propeller, part of outboard motor, rope or metal).<br />
5.5.3 Personal Watercraft (PWC)/Jet ski rid<strong>in</strong>g (n=80)<br />
There were 80 hospital-treated <strong>in</strong>jury cases <strong>in</strong>volv<strong>in</strong>g PWC <strong>in</strong> 2006/7 (29 admissions and 51 ED<br />
presentations). Males accounted for 93% of admissions and 78% of ED presentations. Admitted cases<br />
were spread across the 5-year age groups from 15-19 to 65-69 years with peaks <strong>in</strong> age groups 25-29, 35-39<br />
and 45-49 years; ED presentations peaked <strong>in</strong> age groups 20-24, 25-29 and 35-39 years (Figure 13).<br />
Figure 13<br />
Hospital-treated powered watercraft (PWC) <strong>in</strong>jury by age group, <strong>Victoria</strong> July 1, 2006 to<br />
June 30, <strong>2007</strong> (n=80)<br />
Percentage of admissions and presentations<br />
25<br />
20<br />
15<br />
10<br />
5<br />
0<br />
Admissions (n=29)<br />
ED Presentations (n=51)<br />
0–4 5–9 10–14 15–19 20–24 25–29 30–34 35–39 40–44 45–49 50+<br />
Age group<br />
Sources: <strong>Victoria</strong>n Admitted Episodes Dataset (VAED) and <strong>Victoria</strong>n Emergency M<strong>in</strong>imum Dataset (VEMD)<br />
5.5.3.1 Hospital admissions (n = 29)<br />
Thirteen percent of all hospital admissions for recreational boat<strong>in</strong>g-related <strong>in</strong>jury were associated with<br />
PWC rid<strong>in</strong>g. There were 29 PWC-related admissions <strong>in</strong> 2006/7.<br />
The most frequently <strong>in</strong>jured body region was the head/face/neck (41%), followed by the trunk (28%) and<br />
lower extremity (17%). Almost half of <strong>in</strong>juries were fractures (48%). The other <strong>in</strong>jury types were open<br />
wounds (14%), <strong>in</strong>tracranial <strong>in</strong>jury (7%) and <strong>in</strong>jury to <strong>in</strong>ternal organs (7%). Forty-one percent of PWC <strong>in</strong>jury<br />
hospitalisations were admitted for less than 2 days, 40% stayed 2-7 days, 17% stayed 8-30 days and 3% (1<br />
case) stayed 31+ days.<br />
The causes of PWC-related admissions were: accident to craft (non-drown<strong>in</strong>g/submersion <strong>in</strong>cident) (31%);<br />
onboard <strong>in</strong>cident (17%); falls (10%); near drown<strong>in</strong>g/submersion (10%); and other and unspecified water<br />
transport (28%).<br />
56
The VAED does not <strong>in</strong>clude descriptive data so no details of the circumstances of the <strong>in</strong>jury are available<br />
from that database. Only 9 of the admissions were recorded on the VEMD: two persons were <strong>in</strong>jured when<br />
<strong>in</strong>volved <strong>in</strong> collisions with another jet ski, two was struck by the jetski, one was knocked off a jetski by a<br />
wave, one got his lower leg caught between two jetskis, one was <strong>in</strong>jured when rid<strong>in</strong>g a tyre beh<strong>in</strong>d a jetski<br />
and two case narratives gave no further details on the circumstances of the <strong>in</strong>jury.<br />
5.5.3.2 Hospital ED presentations (non admissions) (n = 51)<br />
Eight percent of recorded ED presentations for boat<strong>in</strong>g-related recreational <strong>in</strong>juries were PWC rid<strong>in</strong>g cases.<br />
In this current report<strong>in</strong>g year there are 51 cases, four fewer than <strong>in</strong> the previous year. Just over threequarters<br />
of ED presentations were male (77%) and case numbers were highest age groups 20-24 years<br />
(22%), 25-29 years (18%) and 35-39 years (16%).<br />
The lower extremity was the most frequently <strong>in</strong>jured body site (28%), followed by the head/face and u<strong>pp</strong>er<br />
extremity (each 26%) and trunk (14%). Open wounds accounted for 28% of presentations, followed by<br />
spra<strong>in</strong>s and stra<strong>in</strong>s (26%) then fractures and superficial <strong>in</strong>juries (both 6%).<br />
The major causes of <strong>in</strong>jury were falls from the PWC (37%) and be<strong>in</strong>g struck by/collid<strong>in</strong>g with an object<br />
(31%, usually part of their own PWC).<br />
5.5.4 Sail<strong>in</strong>g (n=53)<br />
There were 16 hospital admissions and 37 ED presentations for sail<strong>in</strong>g <strong>in</strong>jury.<br />
5.5.4.1 Hospital admissions (n = 16)<br />
More than two-thirds of sail<strong>in</strong>g hospitalisations were male (69%). Admissions were spread across the<br />
5-year age groups from ages 20-24 years to ages 75-79 years with 56% of cases aged 50 years and older.<br />
Half of the <strong>in</strong>juries were fractures. The most frequently <strong>in</strong>jured body sites were the head (25% of sail<strong>in</strong>g<br />
<strong>in</strong>jury admissions) and wrist/hand (19%). Sixty-n<strong>in</strong>e percent of cases stayed <strong>in</strong> hospital for less than 2 days;<br />
and the rema<strong>in</strong>der (31%) stayed 2-7 days.<br />
The major causes of <strong>in</strong>jury were: be<strong>in</strong>g struck by/crushed between an object; and ‘on-board <strong>in</strong>cident’ (both<br />
38%). Only four of the admissions were recorded on the VEMD – two were hit on the head by the boom,<br />
one fell while on board and one hurt his ribs when the boat capsized.<br />
5.5.4.2 Hospital ED presentations (n = 37)<br />
Males accounted for 57% of ED presentations and females 43%. Cases occurred <strong>in</strong> all 5-year age groups<br />
from age group 5-9 years to age group 75-79 years with small peaks <strong>in</strong> age group 50-54 years (19%, n=7),<br />
followed by age groups 25-29 years and 35-39 years (both 11%, n=4).<br />
Spra<strong>in</strong>/stra<strong>in</strong>s (27%) and fractures (22%) were the most frequently occurr<strong>in</strong>g types of <strong>in</strong>jury. The u<strong>pp</strong>er<br />
extremity was the most commonly <strong>in</strong>jured body region (32%), followed by the head/face/neck (24%).<br />
The most common causes of <strong>in</strong>jury, derived from the analysis of coded data and case narratives, were:<br />
struck by the boom (30%, n=11); struck by/collided with other equipment such as the sp<strong>in</strong>naker pole, sail<br />
or w<strong>in</strong>ch (19%, n=7); and on-board falls (22%, n=8).<br />
<strong>Mar<strong>in</strong>e</strong> <strong>Safety</strong> <strong>in</strong> <strong>Victoria</strong>: July <strong>2007</strong> to June <strong>2008</strong> 57
5.5.5 W<strong>in</strong>dsurf<strong>in</strong>g and kitesurf<strong>in</strong>g (n=39)<br />
There were 19 admissions and 20 ED presentations for <strong>in</strong>juries related to w<strong>in</strong>dsurf<strong>in</strong>g and kitesurf<strong>in</strong>g.<br />
5.5.5.1 Hospital admissions (n =19)<br />
The VAED does not currently have a separate code for w<strong>in</strong>dsurf<strong>in</strong>g and kitesurf<strong>in</strong>g. We presume that<br />
kitesurf<strong>in</strong>g cases are currently be<strong>in</strong>g coded under the w<strong>in</strong>dsurf<strong>in</strong>g code. There were 19 recorded<br />
admissions <strong>in</strong> 2006/7 compared with 23 <strong>in</strong> 2005/6. Seventy-n<strong>in</strong>e percent of admitted cases (n=15) were<br />
male. Thirteen cases were young adults aged between 20 and 44 years (68%). Hit/struck/crush was the<br />
major cause of <strong>in</strong>jury (37%), followed by near drown<strong>in</strong>g or submersion and on-board <strong>in</strong>cidents (both 16%).<br />
The lower extremity was the most frequently <strong>in</strong>jured body region (47%, to the hip, thigh. knee, lower leg,<br />
ankle or foot), followed by the u<strong>pp</strong>er extremity (21%, to the shoulder, u<strong>pp</strong>er arm, wrist or hand), then<br />
head/face/neck (16%, mostly head). The shoulder and knee were the most commonly <strong>in</strong>jured body sites.<br />
The most frequently occurr<strong>in</strong>g <strong>in</strong>juries were fractures (42%) and dislocations/spra<strong>in</strong>s/stra<strong>in</strong>s (21%).<br />
Only 3 admissions were recorded on the VEMD (all kitesurf<strong>in</strong>g <strong>in</strong>cidents). Two case narratives provided<br />
some more detail of the <strong>in</strong>jury <strong>in</strong>cidents: one kitesurfer was dragged 30 metres across a carpark and the<br />
other surfed <strong>in</strong>to a brick wall.<br />
5.5.5.2 Hospital ED presentations (n =20)<br />
Eleven (55%) of the 23 cases present<strong>in</strong>g to EDs were w<strong>in</strong>dsurfers and n<strong>in</strong>e (45%) were kitesurfers. All were<br />
male. Cases were found <strong>in</strong> every 5-year age group from 15-19 to 60-64 years with 40% aged <strong>in</strong> their 30s.<br />
Dislocation/spra<strong>in</strong>/stra<strong>in</strong>s were the most common <strong>in</strong>juries (35%), followed by fractures and open wounds<br />
(both 20%). The shoulder (20%) and knee (15%) were most frequently <strong>in</strong>jured.<br />
Most <strong>in</strong>juries were caused by falls off w<strong>in</strong>d/kite surfer (45%) and struck by/collision with objects (25%, such<br />
as w<strong>in</strong>dsurfer/boom/bar/mast).<br />
5.5.6 Fish<strong>in</strong>g from a boat (n=28)<br />
All 3 boat<strong>in</strong>g-related fatalities recorded on the NCIS <strong>in</strong> 2006/7 were fishers. Data on hospital-treated boat<br />
fish<strong>in</strong>g <strong>in</strong>jury underestimate the number of serious <strong>in</strong>juries associated with fish<strong>in</strong>g from boats. There are<br />
no activity sub-codes <strong>in</strong> the VAED to disaggregate cases coded to ‘activity - fish<strong>in</strong>g’ on the basis of site<br />
(boat, jetty, bank etc.) The only fish<strong>in</strong>g activity that is coded separately is rock fish<strong>in</strong>g. As a result of this<br />
cod<strong>in</strong>g issue, the only ‘fish<strong>in</strong>g from boat’ <strong>in</strong>jury hospitalisations identifiable on the VAED are those that<br />
have been assigned to a ‘water transport’ external cause code; there were 17 such cases. Fifteen were male<br />
(88%). There were 3 cases <strong>in</strong> age groups 30-34 and 65-69 years, two <strong>in</strong> age groups 40-44 and 55-59 years<br />
and one <strong>in</strong> each of the rema<strong>in</strong><strong>in</strong>g 5-year age groups up to age 75 years.<br />
Twelve cases (71%) were due to on-board <strong>in</strong>cidents (no further detail), three (18%) were caused by an<br />
accident to craft, and two (12%) were coded to ‘other and unspecified’ water transport accident. Injuries<br />
were mostly to the head/face/neck (35%), followed by the trunk and lower extremity (both 30%) then<br />
the u<strong>pp</strong>er extremity (6%). The most common <strong>in</strong>jury was fracture (occurr<strong>in</strong>g <strong>in</strong> 53% of cases). Seventy-one<br />
percent of cases (n=12) stayed <strong>in</strong> hospital less than two days, 24% (n=4) had a stay of 2-7 days and 6% (1<br />
case) stayed between 8 and 30 days.<br />
58
Information on specific sport and activity at the time of <strong>in</strong>jury should be <strong>in</strong>cluded <strong>in</strong> VEMD case narrative<br />
data but this <strong>in</strong>formation is not consistently reported. Only 11 cases (half as many as the previous year)<br />
could be def<strong>in</strong>itely identified as <strong>in</strong>volv<strong>in</strong>g persons <strong>in</strong>jured while fish<strong>in</strong>g from a boat. All cases were male<br />
and 81% were aged 30 and older.<br />
Five cases (45%) were treated <strong>in</strong> ED for fishhook <strong>in</strong>juries, four <strong>in</strong>juries to the hand and one to the leg. There<br />
were three other cutt<strong>in</strong>g/pierc<strong>in</strong>g cases <strong>in</strong>volv<strong>in</strong>g a wire used to catch sharks, a spike from an elephant fish<br />
and a foreign body from st<strong>in</strong>gray to the hand. The other 3 <strong>in</strong>jury cases were due to f<strong>in</strong>ger entrapment (<strong>in</strong><br />
the boat canopy), tri<strong>pp</strong><strong>in</strong>g <strong>in</strong> the boat and gett<strong>in</strong>g grit <strong>in</strong> an eye when out fish<strong>in</strong>g.<br />
<strong>Mar<strong>in</strong>e</strong> <strong>Safety</strong> <strong>in</strong> <strong>Victoria</strong>: July <strong>2007</strong> to June <strong>2008</strong> 59
6 Discussion and conclusion<br />
There were 139 commercial and 1,091 recreational vessel-related mar<strong>in</strong>e <strong>in</strong>cidents recorded on the MIR<br />
system <strong>in</strong> <strong>2007</strong>/8, 15 more commercial <strong>in</strong>cidents and 178 more recreational <strong>in</strong>cidents than recorded <strong>in</strong><br />
2006/7. Thirty-five percent of the commercial mar<strong>in</strong>e <strong>in</strong>cidents were classified as ‘response only’ compared<br />
with 85% of the recreational mar<strong>in</strong>e <strong>in</strong>cidents.<br />
Among the 139 commercial mar<strong>in</strong>e <strong>in</strong>cidents <strong>in</strong> <strong>2007</strong>/8, there were 12 reports of serious or m<strong>in</strong>or <strong>in</strong>jury,<br />
six vessels were reported lost and a further 16 <strong>in</strong>cidents resulted <strong>in</strong> vessel or property damage. Two of the<br />
8 <strong>in</strong>cidents <strong>in</strong>volv<strong>in</strong>g hire/drive vessels resulted <strong>in</strong> damage to the vessel or property; there were no reports<br />
of <strong>in</strong>jury. Among the 1,091 recreational mar<strong>in</strong>e <strong>in</strong>cidents that were recorded on the MIR system <strong>in</strong> <strong>2007</strong>/8,<br />
there were 7 fatal <strong>in</strong>cidents caus<strong>in</strong>g 8 deaths, 20 <strong>in</strong>cidents caus<strong>in</strong>g serious or m<strong>in</strong>or <strong>in</strong>juries, 10 <strong>in</strong>cidents<br />
that caused vessel damage and 26 <strong>in</strong>cidents that caused property damage.<br />
There were n<strong>in</strong>e recorded boat<strong>in</strong>g fatalities (<strong>in</strong> 7 serious <strong>in</strong>cidents) on the MIR system <strong>in</strong> <strong>2007</strong>/8 compared<br />
with 5 <strong>in</strong> 2006/7. Two of the <strong>in</strong>cidents that occurred <strong>in</strong> 2006/7 were classified as ‘response only’ <strong>in</strong>cidents<br />
because they were not vessel-related (one was a boogie border and the other a scuba diver), the other 3<br />
deaths were fishers who drowned. All seven fatal <strong>in</strong>cidents <strong>in</strong> <strong>2007</strong>/8 were classified as serious <strong>in</strong>cidents<br />
and were recreational vessel-related. The n<strong>in</strong>e deaths from these <strong>in</strong>cidents were caused by drown<strong>in</strong>g (3),<br />
impact <strong>in</strong>juries related to collisions (4) and fire-related burns (2).<br />
Human factors made the greatest contribution to ‘serious <strong>in</strong>cidents’ <strong>in</strong> <strong>2007</strong>/8, both for commercial and<br />
recreational-boat<strong>in</strong>g <strong>in</strong>cidents (mostly errors of judgment, navigational errors, failure to keep proper<br />
lookout and <strong>in</strong>experience), then environmental factors (mostly related to w<strong>in</strong>d/sea state, tidal and bar<br />
conditions). Material factors (mostly mach<strong>in</strong>ery and electrical equipment failures) made the greatest<br />
contribution to ‘response only’ <strong>in</strong>cidents (both commercial and recreational), followed by human factors<br />
(ma<strong>in</strong>ly lack of ma<strong>in</strong>tenance) for commercial vessel <strong>in</strong>cidents and environmental factors for recreational<br />
vessel <strong>in</strong>cidents.<br />
The reported PFD wear rate among recreational boaters <strong>in</strong>volved <strong>in</strong> ‘serious <strong>in</strong>cidents’ <strong>in</strong> <strong>2007</strong>/8 (n=229)<br />
was 58% for boaters <strong>in</strong> vessels ≤4.8 metres <strong>in</strong> length and 45% for boaters <strong>in</strong> larger vessels (>4.8 metres <strong>in</strong><br />
length) compared with 70 % and 56%, respectively, <strong>in</strong> 2006/7. The correspond<strong>in</strong>g wear rates reported for<br />
summer <strong>2007</strong> from the PFD wear observational study conducted by MUARC for MSV were 63% and 13%<br />
respectively (Cassell et al., <strong>2007</strong>). There was no PFD wear observation study <strong>in</strong> summer <strong>2008</strong>. Recreational<br />
boaters <strong>in</strong>volved <strong>in</strong> serious <strong>in</strong>cidents <strong>in</strong> <strong>2007</strong>/8 form a small proportion of all active recreational boaters,<br />
so no conclusions can be safely drawn from the a<strong>pp</strong>arent deterioration <strong>in</strong> PFD wear among this group<br />
of boaters.<br />
There is a time lag <strong>in</strong> the release of death and hospital-treated <strong>in</strong>jury data so <strong>in</strong>jury surveillance systems<br />
datasets run 12 months beh<strong>in</strong>d the MIR system dataset. In 2006/7 there were 3 boat<strong>in</strong>g-related deaths (all<br />
fishers) recorded on the National Coroners Information System and 223 hospital admissions and 679 ED<br />
presentations recorded on the hospital datasets. One further death was reported <strong>in</strong> the media but was<br />
not found on the NCIS (the Coroner’s <strong>in</strong>vestigation is probably not concluded). The hospital-treated <strong>in</strong>jury<br />
figures are underestimates because there are case capture, data quality and cod<strong>in</strong>g system weaknesses<br />
that affect the identification of relevant cases, especially those that occur <strong>in</strong> fish<strong>in</strong>g.<br />
The highest rank<strong>in</strong>g water sports for hospital-treated <strong>in</strong>jury were: water ski<strong>in</strong>g and other towed water<br />
sports; motor boat<strong>in</strong>g/unspecified boat<strong>in</strong>g; personal water craft (PWC) rid<strong>in</strong>g; sail<strong>in</strong>g; w<strong>in</strong>d/kite surf<strong>in</strong>g;<br />
and fish<strong>in</strong>g.<br />
60
A check of the peer-reviewed research literature showed that, exclud<strong>in</strong>g s<strong>in</strong>gle case reports, there were 3<br />
new published studies <strong>in</strong> <strong>2007</strong>-8 (on alcohol use by boaters and on <strong>in</strong>jury <strong>in</strong> w<strong>in</strong>dsurf<strong>in</strong>g and kitesurf<strong>in</strong>g).<br />
Hence the <strong>in</strong>formation on prevent<strong>in</strong>g <strong>in</strong>juries <strong>in</strong> specific boat<strong>in</strong>g sports and activities reported below is<br />
mostly similar to that provided <strong>in</strong> the last two reports.<br />
Prevent<strong>in</strong>g <strong>in</strong>jury <strong>in</strong> towed water sports<br />
As <strong>in</strong> the previous four years, towed water sports accounted for the highest proportion of recreational<br />
boat<strong>in</strong>g <strong>in</strong>jury hospital admissions and ED presentations (388/920, 43%) <strong>in</strong> 2006/7. There were 16<br />
more cases than <strong>in</strong> 2005/6. Case numbers for the <strong>in</strong>dividual towed sports cannot be disaggregated <strong>in</strong><br />
admissions data, but analyses of ED data for these mar<strong>in</strong>e reports has consistently showed that water<br />
ski<strong>in</strong>g accounts for around 60% of towed water sports <strong>in</strong>jury cases and wakeboard<strong>in</strong>g/skiboard<strong>in</strong>g<br />
about 20%.<br />
Around 30% of hospital-treated <strong>in</strong>juries were to the lower extremity (mostly the knee, foot and ankle)<br />
and 25% to head/face/neck. Fractures, dislocations, spra<strong>in</strong>s and stra<strong>in</strong>s and open wounds were the most<br />
common <strong>in</strong>juries. Falls due to loss of control accounted for around one-third of <strong>in</strong>juries. Struck by/collision<br />
with objects (mostly the ski/board, ski rope or ski handle), entanglements with the towrope, and overexertion<br />
also caused many <strong>in</strong>juries.<br />
These results are generally consistent with those found <strong>in</strong> a study of the characteristics of water ski<strong>in</strong>g<br />
and wakeboard<strong>in</strong>g <strong>in</strong>juries treated <strong>in</strong> emergency departments <strong>in</strong> the United States between 2001 and<br />
2003 (Hostetler et al., 2005). The <strong>in</strong>jury pattern and causes <strong>in</strong>dicate that preventive measures could<br />
<strong>in</strong>clude: promotion of pre-season physical condition<strong>in</strong>g; provision of skills and safety tra<strong>in</strong><strong>in</strong>g for skiers/<br />
wakeboarders, boat operators and observers (spotters); promotion of the use of a quick-release tow<br />
l<strong>in</strong>e device; safety improvements to equipment design; wear<strong>in</strong>g of wet suits and PFD; and regular and<br />
rout<strong>in</strong>e risk assessment of designated towed sports areas by waterway authorities and event/competition<br />
organisers. Hostetler and colleagues commented that the substantial number of head and facial <strong>in</strong>juries<br />
among wakeboarders underscores the need for research on the potential role of helmets or other<br />
protective gear (Hostetler et al., 2005)<br />
Prevent<strong>in</strong>g <strong>in</strong>jury <strong>in</strong> general boat<strong>in</strong>g<br />
As previously stated, <strong>in</strong>juries <strong>in</strong> motor boat<strong>in</strong>g (pleasure cruis<strong>in</strong>g etc.) are underestimated. Cases are underrecorded<br />
or not identifiable on the hospital databases due to cod<strong>in</strong>g weaknesses and data quality issues,<br />
although there has been an improvement <strong>in</strong> the quality of VEMD data narratives over time this has led to<br />
better identification of cases. General boat<strong>in</strong>g accounted for a<strong>pp</strong>roximately one-third of hospital-treated<br />
recreational boat<strong>in</strong>g <strong>in</strong>jury cases <strong>in</strong> 2006/7 (n=279 cases).<br />
The lower extremity (lower leg and foot) and the u<strong>pp</strong>er extremity (hand, elbow/forearm, shoulder) were<br />
the most commonly <strong>in</strong>jured body sites. Open wounds, fractures/dislocations and spra<strong>in</strong>s/stra<strong>in</strong>s were the<br />
most frequent <strong>in</strong>juries. Analysis of ED case narratives <strong>in</strong>dicates that the major causes of general boat<strong>in</strong>g<br />
<strong>in</strong>juries were falls (when on the boat and falls overboard or when gett<strong>in</strong>g off the boat); be<strong>in</strong>g struck by,<br />
or collid<strong>in</strong>g with, an object (mostly hitt<strong>in</strong>g aga<strong>in</strong>st a part of the boat body or a piece of equipment or<br />
entrapment of hands/f<strong>in</strong>gers or legs between boat and trailer/jetty etc.); and cutt<strong>in</strong>g/pierc<strong>in</strong>g by an object<br />
(12%, mostly the propeller, part of outboard motor, rope or metal).<br />
<strong>Mar<strong>in</strong>e</strong> <strong>Safety</strong> <strong>in</strong> <strong>Victoria</strong>: July <strong>2007</strong> to June <strong>2008</strong> 61
Our literature search found only one recently published research article relevant to general boat<strong>in</strong>g safety.<br />
Miller & Pikora (<strong>2008</strong>) undertook a telephone survey of a sample of 500 adult registered boat owners<br />
<strong>in</strong> Western Australia to explore their use of alcohol when boat<strong>in</strong>g. The response rate was 47%. The<br />
researchers used logistic regression analysis to determ<strong>in</strong>e the effects of a range of demographic variables<br />
and boat<strong>in</strong>g characteristics on the use of alcohol among recreational boaters on their last trip.<br />
The use of alcohol was not found to be prevalent among WA recreational boat owners with 19% report<strong>in</strong>g<br />
that they had consumed alcohol of their most recent boat<strong>in</strong>g trip. Previous research, ma<strong>in</strong>ly conducted <strong>in</strong><br />
the U.S., had reported that 30-40% of recreational boaters consume alcohol when on the water. The WA<br />
study only <strong>in</strong>cluded owners of registered vessels and not their passengers which may account for some of<br />
this difference <strong>in</strong> prevalence levels.<br />
Two variables were found to be significantly and <strong>in</strong>dependently associated with alcohol consumption on<br />
the most recent trip. First, those with no boat<strong>in</strong>g education were 45% more likely to report consum<strong>in</strong>g<br />
alcohol on their most recent trip compared with those who had completed a boat<strong>in</strong>g education course<br />
(OR 0.55; 95% CI 0.32-0.95). Previous studies had found no significant difference <strong>in</strong> the consumption of<br />
alcohol while boat<strong>in</strong>g between those who had been formally tra<strong>in</strong>ed and those who had not or that<br />
boaters who had completed boater safety tra<strong>in</strong><strong>in</strong>g were significantly more likely to consume alcohol when<br />
boat<strong>in</strong>g than those who had not.<br />
Second, those who did not have children aged less than 12 years on board were 63% more likely to report<br />
consum<strong>in</strong>g alcohol than those who did have children on board (OR 0.37; 95% CI 0.22-0.63) <strong>in</strong>dicat<strong>in</strong>g that<br />
boaters that carry children may be more safety conscious.<br />
The authors of the WA study made a general recommendation that education, legislation and other<br />
measures to reduce boat<strong>in</strong>g <strong>in</strong>cidents be monitored over time to determ<strong>in</strong>e the effect of these strategies<br />
on safety behaviours.<br />
Other preventive measures recommended <strong>in</strong> earlier research reports <strong>in</strong>clude: extend<strong>in</strong>g skills and safety<br />
tra<strong>in</strong><strong>in</strong>g for boat operators (<strong>in</strong>clud<strong>in</strong>g on-water and boat launch/dock<strong>in</strong>g skills); <strong>in</strong>stitution of boat ramp<br />
upgrades and regular safety <strong>in</strong>spections and associated ma<strong>in</strong>tenance programs by responsible authorities;<br />
promotion of the adoption of regular vessel, fitt<strong>in</strong>gs and equipment ma<strong>in</strong>tenance regimes and safety<br />
checks by boat owners/operators; and <strong>in</strong>itiatives to <strong>in</strong>crease the wear<strong>in</strong>g of personal protective equipment<br />
by boat occupants (PFD, slip resistant shoes and gloves when do<strong>in</strong>g tasks that carry a risk of f<strong>in</strong>ger/<br />
hand <strong>in</strong>jury).<br />
Prevent<strong>in</strong>g <strong>in</strong>jury <strong>in</strong> PWC rid<strong>in</strong>g<br />
Personal watercraft-related <strong>in</strong>juries accounted for 9% of recreational boat<strong>in</strong>g hospital treated <strong>in</strong>juries<br />
(80/902 cases) <strong>in</strong> 2006/7. There were 13 fewer recorded cases <strong>in</strong> 2006/7 than <strong>in</strong> 2005/6.<br />
The age-related pattern <strong>in</strong> 2006/7 was slightly different than <strong>in</strong> previous years where <strong>in</strong>jured PWC riders<br />
were shown to be mostly young males aged 20-39 years. In 2006/7, hospital admissions among the 45-49<br />
year age group were as frequent as among 25-29 year olds and 35-39 year olds.<br />
The lower extremity, head/face and the trunk were the most frequently <strong>in</strong>jured body sites. Fractures, open<br />
wounds, spra<strong>in</strong>s and stra<strong>in</strong>s and <strong>in</strong>tracranial <strong>in</strong>juries were common <strong>in</strong>juries. Available data <strong>in</strong>dicate that the<br />
major causes of <strong>in</strong>jury were falls from the PWC, and collisions with a fixed object (usually a part of the PWC)<br />
or mov<strong>in</strong>g objects (most commonly their own or another PWC). These results are consistent with f<strong>in</strong>d<strong>in</strong>gs<br />
from previous studies of patients treated <strong>in</strong> emergency departments and trauma centres (Latch & Fiser,<br />
2004; Branche et al., 1997).<br />
62
Suggested preventive measures <strong>in</strong> the research literature <strong>in</strong>clude: <strong>in</strong>terventions to improve operat<strong>in</strong>g<br />
skills and safety knowledge (<strong>in</strong>clud<strong>in</strong>g knowledge of the ‘rules of the sea’) and to <strong>in</strong>crease compliance with<br />
safe practices <strong>in</strong>clud<strong>in</strong>g speed limits; imposition of limits on wake jump<strong>in</strong>g; helmet use (post a study of<br />
the hydrostatic drag effect) and foot protection and PFD wear; the fitt<strong>in</strong>g of a lanyard kill switch; and an<br />
evaluation of the current steer<strong>in</strong>g design on PWC.<br />
Prevent<strong>in</strong>g <strong>in</strong>jury <strong>in</strong> sail<strong>in</strong>g<br />
There are comparatively few sail<strong>in</strong>g <strong>in</strong>juries cases treated <strong>in</strong> <strong>Victoria</strong>n hospitals consider<strong>in</strong>g the popularity<br />
of the sport. In 2006/7, 6% (n=53) of all hospital-treated recreational boat<strong>in</strong>g <strong>in</strong>jury cases were <strong>in</strong>jured<br />
dur<strong>in</strong>g sail<strong>in</strong>g activities. Fractures, spra<strong>in</strong>/stra<strong>in</strong>s and open wounds were common <strong>in</strong>juries with the head/<br />
face most vulnerable to boom strike <strong>in</strong>jury.<br />
The ma<strong>in</strong> mechanisms of <strong>in</strong>jury were strikes by the boom and other equipment such as the sp<strong>in</strong>naker<br />
pole, sail or w<strong>in</strong>ch and on-board falls. Interventions <strong>in</strong>dicated by the pattern of <strong>in</strong>jury <strong>in</strong> sail<strong>in</strong>g are the<br />
wear<strong>in</strong>g of protective headgear, slip-resistant closed footwear, gloves and a PFD.<br />
Prevent<strong>in</strong>g <strong>in</strong>jury <strong>in</strong> w<strong>in</strong>dsurf<strong>in</strong>g and kitesurf<strong>in</strong>g<br />
There were 39 hospital-treated w<strong>in</strong>dsurf<strong>in</strong>g (sailboard<strong>in</strong>g/boardsail<strong>in</strong>g) and kitesurf<strong>in</strong>g <strong>in</strong>juries <strong>in</strong> 2006/07,<br />
4% of recorded recreational boat<strong>in</strong>g <strong>in</strong>jury cases. There were 5 fewer hospital admissions and 3 fewer ED<br />
presentations for w<strong>in</strong>dsurf<strong>in</strong>g/kitesurf<strong>in</strong>g <strong>in</strong>jury than <strong>in</strong> 2005/6.<br />
Injured w<strong>in</strong>dsurfers/kitersurfers were most commonly adult males aged <strong>in</strong> their 20s and 30s. Falls and<br />
struck by/collision with objects (<strong>in</strong>clud<strong>in</strong>g the board and natural/man-made objects <strong>in</strong> the water and on<br />
shore) were the major causes of <strong>in</strong>juries. Fractures, dislocations/spra<strong>in</strong>s/stra<strong>in</strong>s and open wounds were the<br />
most common <strong>in</strong>juries and the shoulder and knee were the most commonly <strong>in</strong>jured body sites.<br />
Two research reports, one on w<strong>in</strong>dsurf<strong>in</strong>g and one on kitesurf<strong>in</strong>g, were published <strong>in</strong> the peer-reviewed<br />
literature <strong>in</strong> 2006/7. The article on w<strong>in</strong>dsurf<strong>in</strong>g (Dyson et al., 2006) reported the results of a retrospective<br />
survey of <strong>in</strong>juries among British raceboard and wave/slalom national/<strong>in</strong>ternational and recreational<br />
w<strong>in</strong>dsurfers. The overall <strong>in</strong>jury <strong>in</strong>cidence was 1.5 per person per year. Injury <strong>in</strong>cidence was higher among<br />
elite wave/slalom competitors (1.5/person/year) than elite raceboarders (1.0/person/year) and mixed<br />
activity recreational participants (1.2/person/year). Forty-five percent of new <strong>in</strong>juries were muscle/tendon<br />
stra<strong>in</strong>s with many new and recurrent lower back muscle stra<strong>in</strong>s. This is a different pattern than found <strong>in</strong><br />
hospital-treated <strong>in</strong>jury data as people with stra<strong>in</strong> <strong>in</strong>jury usually do not present to hospital emergency<br />
departments for treatment. The authors recommended specific body condition<strong>in</strong>g for the sport with<br />
specific muscular tra<strong>in</strong><strong>in</strong>g and flexibility exercises focused on the trunk and back muscles with special<br />
consideration of muscles act<strong>in</strong>g at the hip and shoulder jo<strong>in</strong>ts. They also recommended the use of a<br />
neoprene waist and lower back su<strong>pp</strong>ort by novice w<strong>in</strong>d surfers dur<strong>in</strong>g <strong>in</strong>itial shore-based lift<strong>in</strong>g activities<br />
and head protection for wave/slalom w<strong>in</strong>dsurfers.<br />
Spanjersberg & Schi<strong>pp</strong>er (<strong>2007</strong>) describe <strong>in</strong> detail five kitesurf<strong>in</strong>g <strong>in</strong>jury cases that occurred <strong>in</strong> the<br />
Netherlands over 3 years that warranted the call-out of the Helicopter Mobile Medical Team. One patient<br />
lost control of his kite after a gush of w<strong>in</strong>d and was lifted <strong>in</strong>to the air and thrown to the ground from a<br />
height of 10m. He suffered multiple <strong>in</strong>juries <strong>in</strong>clud<strong>in</strong>g a dislocated shoulder, fractured knee, fractured<br />
vertebrae and amputated toes. The second patient was lifted out of the water by a gust of w<strong>in</strong>d and<br />
thrown aga<strong>in</strong>st a billboard, suffer<strong>in</strong>g severe head <strong>in</strong>juries that subsequently resulted <strong>in</strong> extensive<br />
<strong>Mar<strong>in</strong>e</strong> <strong>Safety</strong> <strong>in</strong> <strong>Victoria</strong>: July <strong>2007</strong> to June <strong>2008</strong> 63
ehavioural problems. The third patient was surf<strong>in</strong>g close to shore when the w<strong>in</strong>d picked up strength<br />
and he was thrown over a dyke and aga<strong>in</strong>st a parked car. His ma<strong>in</strong> <strong>in</strong>juries were a dislocated shoulder,<br />
a fractured femur and face lacerations. The fourth patient was thrown onto the beach but suffered only<br />
m<strong>in</strong>or chest <strong>in</strong>juries. The fifth was killed when walk<strong>in</strong>g with his kite toward the waterfront <strong>in</strong> stormy<br />
weather. He was caught by a sudden gust of w<strong>in</strong>d and thrown face first aga<strong>in</strong>st a wooden pile. The risk<br />
factors for serious <strong>in</strong>jury <strong>in</strong> these cases were similar to those reported previously: surf<strong>in</strong>g too close to shore;<br />
loss of kite control and a specific w<strong>in</strong>d condition called onshore flow.<br />
Skills and safety tra<strong>in</strong><strong>in</strong>g to <strong>in</strong>crease knowledge and practice of safety protocols, avoidance of<br />
overpower<strong>in</strong>g w<strong>in</strong>ds and better selection of site and conditions, and the fitt<strong>in</strong>g and use of quick release<br />
safety systems (<strong>in</strong>clud<strong>in</strong>g a release on the foot strap) and helmet wear<strong>in</strong>g all have the potential to reduce<br />
<strong>in</strong>juries <strong>in</strong> these w<strong>in</strong>d-powered sports. The <strong>in</strong>troduction of a mandatory certificate of competence has<br />
been proposed for kitesurf<strong>in</strong>g.<br />
Prevent<strong>in</strong>g <strong>in</strong>jury <strong>in</strong> fish<strong>in</strong>g<br />
The activity codes on the hospital admissions dataset (VAED) <strong>in</strong>cludes a code for ‘fish<strong>in</strong>g’ but there<br />
are only three sub-codes: rock fish<strong>in</strong>g, other specified fish<strong>in</strong>g and fish<strong>in</strong>g, unspecified. Consequently,<br />
hospitalisations related to fish<strong>in</strong>g from a boat cannot be disaggregated. For ED presentations recorded<br />
on the VEMD, case identification is based on a word search of case narratives but few of the narratives that<br />
conta<strong>in</strong> the search term ‘fish<strong>in</strong>g’ provide more detail about the sett<strong>in</strong>g (boat, pier, jetty, river bank etc.).<br />
These weaknesses result <strong>in</strong> the under-report<strong>in</strong>g of <strong>in</strong>juries related to fish<strong>in</strong>g from a vessel.<br />
In 2006/7, there were 2 deaths and 28 reported hospital-treated fish<strong>in</strong>g <strong>in</strong>juries, the same number of<br />
hospital-treated <strong>in</strong>juries as <strong>in</strong> 2005/6. As previously reported both deaths were due to drown<strong>in</strong>g and<br />
neither of the decedents was wear<strong>in</strong>g a PFD. There were few details on the hospital-treated <strong>in</strong>jury cases.<br />
Hospitalisations were mostly fracture cases that occurred <strong>in</strong> ‘on-board <strong>in</strong>cidents’ and accidents to craft.<br />
Less serious <strong>in</strong>juries were ma<strong>in</strong>ly cutt<strong>in</strong>g and pierc<strong>in</strong>g by fishhooks, wires and spikes.<br />
Comments on MIR system data quality<br />
S<strong>in</strong>ce 2004/5 the frequency of reported commercial and recreational vessel <strong>in</strong>cidents has steadily<br />
<strong>in</strong>creased probably reflect<strong>in</strong>g improved report<strong>in</strong>g rather than a real <strong>in</strong>crease <strong>in</strong> <strong>in</strong>cidents. However, the<br />
amount of miss<strong>in</strong>g data on some variables rema<strong>in</strong>s problematic. Variables that conta<strong>in</strong> substantial miss<strong>in</strong>g<br />
data <strong>in</strong>clude: <strong>in</strong>cident sub-type for ‘response-only’ commercial <strong>in</strong>cidents; visibility, w<strong>in</strong>d speed, weather<br />
and water conditions for commercial vessel <strong>in</strong>cidents; vessel activity for commercial vessel <strong>in</strong>cidents; and<br />
the role of the <strong>in</strong>jured person, activity of persons onboard and the operator’s licence status for recreational<br />
vessel <strong>in</strong>cidents.<br />
In <strong>2007</strong>/8 contributory factors were recorded for 96% of commercial vessel response only <strong>in</strong>cidents and<br />
60% of commercial vessel serious <strong>in</strong>cidents compared with report<strong>in</strong>g rates of 56% and 51% respectively <strong>in</strong><br />
2006/7. This data item was well recorded for recreational vessel ‘response only’ (89%) and ‘serious’ (94%)<br />
<strong>in</strong>cidents. These data provided more useful <strong>in</strong>formation on the relative contribution of material, human<br />
and environmental factors to <strong>in</strong>cidents than previous years.<br />
64
The MIR system does not capture the major proportion of serious <strong>in</strong>jury <strong>in</strong>cidents. However, it is unrealistic<br />
to expect that the MIR system will ever have the capacity to capture all serious <strong>in</strong>cidents as there is no<br />
legal requirement for recreational boat operators/boaters to report <strong>in</strong>jurious <strong>in</strong>cidents to MSV or the<br />
police. Therefore, hospital <strong>in</strong>jury surveillance systems data will always be required to su<strong>pp</strong>lement the MIR<br />
system data.<br />
CONCLUSION<br />
Injury rates cannot be calculated for any of the recreational boat<strong>in</strong>g sports because participation and<br />
exposure data (hours at risk) are not available. However, the frequency data reported here provide useful<br />
<strong>in</strong>formation to guide <strong>in</strong>jury prevention <strong>in</strong>itiatives. Based on the results of this study, priority should be<br />
given to reduc<strong>in</strong>g drown<strong>in</strong>g <strong>in</strong> recreational boat<strong>in</strong>g and reduc<strong>in</strong>g <strong>in</strong>juries <strong>in</strong> towed water sports, PWC<br />
rid<strong>in</strong>g and kitesurf<strong>in</strong>g/w<strong>in</strong>dsurf<strong>in</strong>g.<br />
<strong>Mar<strong>in</strong>e</strong> <strong>Safety</strong> <strong>in</strong> <strong>Victoria</strong>: July <strong>2007</strong> to June <strong>2008</strong> 65
7 References<br />
Ashby K, Cassell E. (2004). Boat<strong>in</strong>g-related sports and recreational <strong>in</strong>jury, <strong>Victoria</strong> July 2000 to June 2002.<br />
Hazard Edition 56. Monash University Accident Research Centre, Melbourne.<br />
Ashby K, Cassell E and Congiu (<strong>2007</strong>). Follow-up study of hospital treated recreational boat<strong>in</strong>g <strong>in</strong>jury.<br />
Prepared for <strong>Mar<strong>in</strong>e</strong> <strong>Safety</strong> <strong>Victoria</strong> by Monash University Accident Research Centre, Melbourne.<br />
Branche CM, Conn J, Annest JL. Personal watercraft-related <strong>in</strong>juries: A grow<strong>in</strong>g public health concern.<br />
Journal of the American Medical Association. 1997;278(8):663-5.<br />
Cassell E, Ashby K, Guy J. Evaluation of the effectiveness of the 2005 <strong>Victoria</strong>n personal flotation device<br />
(PFD) wear regulations: a pre- and post-observational study. <strong>Report</strong> to <strong>Mar<strong>in</strong>e</strong> <strong>Safety</strong> <strong>Victoria</strong> by Monash<br />
University Accident Research Centre, Melbourne, <strong>2007</strong> (Unpublished).<br />
Dyson R, Buchanan M, Hale T. Incidence of sports <strong>in</strong>juries <strong>in</strong> elite competitive and recreational w<strong>in</strong>dsurfers.<br />
British Journal of Sports Medic<strong>in</strong>e 2006:40;346-350.<br />
Hostetler SG, Hostetler TL, Smith GA, Xiang H. Characteristics of water ski<strong>in</strong>g-related and wakeboard<strong>in</strong>grelated<br />
<strong>in</strong>juries treated <strong>in</strong> Emergency Departments <strong>in</strong> the United States, 2001-3. The American Journal of<br />
Sports Medic<strong>in</strong>e 2005;33(7):1065-70.<br />
Latch R & Fiser DH. The <strong>in</strong>creas<strong>in</strong>g threat of personal watercraft <strong>in</strong>juries. Cl<strong>in</strong>ical Paediatrics<br />
2004;43(4):309-311.<br />
Miller JR, Pikora TJ. Alcohol consumption among recreational boaters: Factors for <strong>in</strong>tervention. Accident<br />
Analysis & Prevention <strong>2008</strong>; 40:496-501.<br />
Spanjersberg WR, Schi<strong>pp</strong>er IB. Kitesurf<strong>in</strong>g: When fun turns to trauma – The Dangers of a new extreme<br />
sport. Journal of Trauma <strong>2007</strong>;63:E76-80.<br />
Sport and Recreation <strong>Victoria</strong> and <strong>Victoria</strong>n Health Promotion Foundation. (2003). <strong>Victoria</strong>ns’ participation<br />
<strong>in</strong> exercise, recreation and sport (2001-02).<br />
66
<strong>Mar<strong>in</strong>e</strong> <strong>Safety</strong> <strong>in</strong> <strong>Victoria</strong>: July <strong>2007</strong> to June <strong>2008</strong> 67
For further <strong>in</strong>formation call <strong>Mar<strong>in</strong>e</strong> <strong>Safety</strong> <strong>Victoria</strong> on 1800 223 022 or visit www.mar<strong>in</strong>esafety.vic.gov.au<br />
Published by <strong>Mar<strong>in</strong>e</strong> <strong>Safety</strong> <strong>Victoria</strong>, Level 11, 121 Exhibition Street, Melbourne March <strong>2008</strong>.<br />
Also published on www.mar<strong>in</strong>esafety.vic.gov.au<br />
Authorised by the <strong>Victoria</strong>n Government, Melbourne.<br />
Pr<strong>in</strong>ted by On Demand 152 Sturt Street, Southbank, VIC 3006.<br />
DOI 3458/08