Marine Safety in Victoria Report 2007-2008 (PDF, 1.3 MB, 72 pp.)
Marine Safety in Victoria Report 2007-2008 (PDF, 1.3 MB, 72 pp.)
Marine Safety in Victoria Report 2007-2008 (PDF, 1.3 MB, 72 pp.)

Create successful ePaper yourself
Turn your PDF publications into a flip-book with our unique Google optimized e-Paper software.
ecorded (ra<strong>in</strong>) but not the visibility level. Eighteen <strong>in</strong>cidents (37%) occurred <strong>in</strong> clear weather with good<br />
visibility. Two (4%) occurred <strong>in</strong> cloudy weather with fair visibility, one (2%) <strong>in</strong> cloudy weather with poor<br />
visibility and one (2%) <strong>in</strong> cloudy weather with good visibility. One <strong>in</strong>cident (2%) occurred <strong>in</strong> hazy weather<br />
with fair visibility.<br />
3.2.6 Contributory factors<br />
Contribut<strong>in</strong>g factors were noted for 47 of the 49 ‘response only’ commercial <strong>in</strong>cidents. Eighty-two percent<br />
of the primary contributory factors noted were material factors (n=44 <strong>in</strong>cidents, either mach<strong>in</strong>ery or<br />
electrical failures), 8% were human factors (n=4; vessel disabled due to lack of fuel or lack of ma<strong>in</strong>tenance,<br />
vessel came adrift, vessel was steered <strong>in</strong>to an object/sand when the operator was try<strong>in</strong>g to free another<br />
vessel that had run aground) and 6% (n=3) were environmental (two due to tidal and bay conditions and<br />
the other to a length of canvas fire hose w<strong>in</strong>d<strong>in</strong>g around the propeller).<br />
3.3 Serious <strong>in</strong>cidents (n=90)<br />
There were 90 serious <strong>in</strong>cidents <strong>in</strong>volv<strong>in</strong>g commercial vessels recorded on the MIR system <strong>in</strong> <strong>2007</strong>/8, the<br />
same numbers <strong>in</strong> 2006/7.<br />
3.3.1 Severity of serious <strong>in</strong>cidents<br />
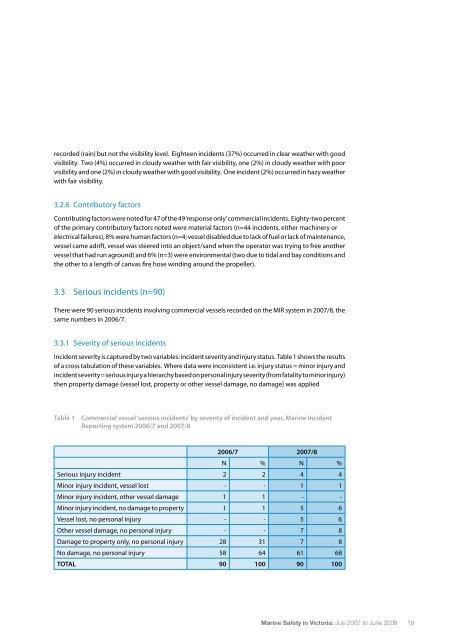
Incident severity is captured by two variables: <strong>in</strong>cident severity and <strong>in</strong>jury status. Table 1 shows the results<br />
of a cross tabulation of these variables. Where data were <strong>in</strong>consistent i.e. <strong>in</strong>jury status = m<strong>in</strong>or <strong>in</strong>jury and<br />
<strong>in</strong>cident severity = serious <strong>in</strong>jury a hierarchy based on personal <strong>in</strong>jury severity (from fatality to m<strong>in</strong>or <strong>in</strong>jury)<br />
then property damage (vessel lost, property or other vessel damage, no damage) was a<strong>pp</strong>lied<br />
Table 1<br />
Commercial vessel ‘serious <strong>in</strong>cidents’ by severity of <strong>in</strong>cident and year, <strong>Mar<strong>in</strong>e</strong> Incident<br />
<strong>Report</strong><strong>in</strong>g system 2006/7 and <strong>2007</strong>/8<br />
2006/7 <strong>2007</strong>/8<br />
N % N %<br />
Serious <strong>in</strong>jury <strong>in</strong>cident 2 2 4 4<br />
M<strong>in</strong>or <strong>in</strong>jury <strong>in</strong>cident, vessel lost - - 1 1<br />
M<strong>in</strong>or <strong>in</strong>jury <strong>in</strong>cident, other vessel damage 1 1 - -<br />
M<strong>in</strong>or <strong>in</strong>jury <strong>in</strong>cident, no damage to property 1 1 5 6<br />
Vessel lost, no personal <strong>in</strong>jury - - 5 6<br />
Other vessel damage, no personal <strong>in</strong>jury - - 7 8<br />
Damage to property only, no personal <strong>in</strong>jury 28 31 7 8<br />
No damage, no personal <strong>in</strong>jury 58 64 61 68<br />
TOTAL 90 100 90 100<br />
<strong>Mar<strong>in</strong>e</strong> <strong>Safety</strong> <strong>in</strong> <strong>Victoria</strong>: July <strong>2007</strong> to June <strong>2008</strong> 19