Marine Safety in Victoria Report 2007-2008 (PDF, 1.3 MB, 72 pp.)
Marine Safety in Victoria Report 2007-2008 (PDF, 1.3 MB, 72 pp.)
Marine Safety in Victoria Report 2007-2008 (PDF, 1.3 MB, 72 pp.)

Create successful ePaper yourself
Turn your PDF publications into a flip-book with our unique Google optimized e-Paper software.
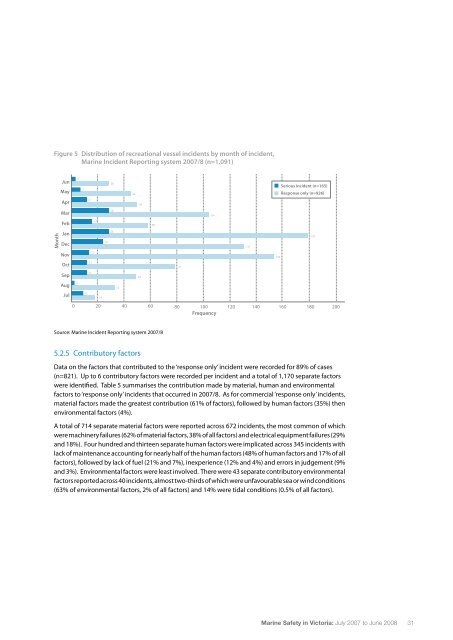
Figure 5 Distribution of recreational vessel <strong>in</strong>cidents by month of <strong>in</strong>cident,<br />
<strong>Mar<strong>in</strong>e</strong> Incident <strong>Report</strong><strong>in</strong>g system <strong>2007</strong>/8 (n=1,091)<br />
Jun<br />
May<br />
2<br />
7<br />
28<br />
44<br />
Serious <strong>in</strong>cident (n=165)<br />
Response only (n=926)<br />
Apr<br />
12<br />
50<br />
Mar<br />
28<br />
104<br />
Feb<br />
16<br />
58<br />
Month<br />
Jan<br />
Dec<br />
24<br />
28<br />
131<br />
178<br />
Nov<br />
13<br />
154<br />
Oct<br />
12<br />
79<br />
Sep<br />
12<br />
48<br />
Aug<br />
2<br />
33<br />
Jul<br />
9<br />
19<br />
0 20 40 60 80 100 120 140 160 180 200<br />
Frequency<br />
Source: <strong>Mar<strong>in</strong>e</strong> Incident <strong>Report</strong><strong>in</strong>g system <strong>2007</strong>/8<br />
5.2.5 Contributory factors<br />
Data on the factors that contributed to the ‘response only’ <strong>in</strong>cident were recorded for 89% of cases<br />
(n=821). Up to 6 contributory factors were recorded per <strong>in</strong>cident and a total of 1,170 separate factors<br />
were identified. Table 5 summarises the contribution made by material, human and environmental<br />
factors to ‘response only’ <strong>in</strong>cidents that occurred <strong>in</strong> <strong>2007</strong>/8. As for commercial ‘response only’ <strong>in</strong>cidents,<br />
material factors made the greatest contribution (61% of factors), followed by human factors (35%) then<br />
environmental factors (4%).<br />
A total of 714 separate material factors were reported across 6<strong>72</strong> <strong>in</strong>cidents, the most common of which<br />
were mach<strong>in</strong>ery failures (62% of material factors, 38% of all factors) and electrical equipment failures (29%<br />
and 18%). Four hundred and thirteen separate human factors were implicated across 345 <strong>in</strong>cidents with<br />
lack of ma<strong>in</strong>tenance account<strong>in</strong>g for nearly half of the human factors (48% of human factors and 17% of all<br />
factors), followed by lack of fuel (21% and 7%), <strong>in</strong>experience (12% and 4%) and errors <strong>in</strong> judgement (9%<br />
and 3%). Environmental factors were least <strong>in</strong>volved. There were 43 separate contributory environmental<br />
factors reported across 40 <strong>in</strong>cidents, almost two-thirds of which were unfavourable sea or w<strong>in</strong>d conditions<br />
(63% of environmental factors, 2% of all factors) and 14% were tidal conditions (0.5% of all factors).<br />
<strong>Mar<strong>in</strong>e</strong> <strong>Safety</strong> <strong>in</strong> <strong>Victoria</strong>: July <strong>2007</strong> to June <strong>2008</strong> 31