Tang et al. Nature Immunology. 2006 - Departments of Pathology ...
Tang et al. Nature Immunology. 2006 - Departments of Pathology ...
Tang et al. Nature Immunology. 2006 - Departments of Pathology ...

You also want an ePaper? Increase the reach of your titles
YUMPU automatically turns print PDFs into web optimized ePapers that Google loves.
ARTICLES<br />
© <strong>2006</strong> <strong>Nature</strong> Publishing Group http://www.nature.com/natureimmunology<br />
Visu<strong>al</strong>izing regulatory T cell control <strong>of</strong> autoimmune<br />
responses in nonobese diab<strong>et</strong>ic mice<br />
Qizhi <strong>Tang</strong> 1,2 , Jason Y Adams 1 , Aaron J Tooley 2 , Mingying Bi 1 , Brian T Fife 1 , Pau Serra 4 , Pere Santamaria 4 ,<br />
Richard M Locksley 3 , Matthew F Krummel 2,5 & Jeffrey A Bluestone 1,2,5<br />
The in vivo mechanism <strong>of</strong> regulatory T cell (T reg cell) function in controlling autoimmunity remains controversi<strong>al</strong>. Here we<br />
have used two-photon laser-scanning microscopy to an<strong>al</strong>yze lymph node priming <strong>of</strong> diab<strong>et</strong>ogenic T cells and to delineate<br />
the mechanisms <strong>of</strong> T reg cell control <strong>of</strong> autoimmunity in vivo. Isl<strong>et</strong> antigen–specific CD4 + CD25 – T helper cells (T H cells) and<br />
T reg cells swarmed and arrested in the presence <strong>of</strong> autoantigens. These T H cell activities were progressively inhibited in the<br />
presence <strong>of</strong> increasing numbers <strong>of</strong> T reg cells. There were no d<strong>et</strong>ectable stable associations b<strong>et</strong>ween T reg and T H cells during<br />
active suppression. In contrast, T reg cells directly interacted with dendritic cells bearing isl<strong>et</strong> antigen. Such persistent<br />
T reg cell–dendritic cell contacts preceded the inhibition <strong>of</strong> T H cell activation by dendritic cells, supporting the idea that<br />
dendritic cells are centr<strong>al</strong> to T reg cell function in vivo.<br />
Autoimmune disease results from the dysregulation <strong>of</strong> basic processes<br />
designed to maintain self-tolerance. The identification <strong>of</strong> regulatory T<br />
(T reg ) lymphocytes as an important component <strong>of</strong> self-tolerance has<br />
opened a princip<strong>al</strong> area <strong>of</strong> investigation in immunology, and many<br />
studies have demonstrated the potent influence <strong>of</strong> T reg cells on natur<strong>al</strong><br />
and induced autoimmune diseases in a vari<strong>et</strong>y <strong>of</strong> mouse models 1–5 .<br />
For example, NOD.Cd28 / nonobese diab<strong>et</strong>ic mice, deficient in T reg<br />
cells, develop diab<strong>et</strong>es at an accelerated rate compared with<br />
NOD mice 6 . Injection <strong>of</strong> NOD T reg cells into NOD.Cd28 / mice<br />
delays and in some cases prevents the development <strong>of</strong> diab<strong>et</strong>es 6 .<br />
Isl<strong>et</strong> antigen–specific T reg cell populations isolated and expanded<br />
from BDC2.5 T cell receptor (TCR)–transgenic mice (c<strong>al</strong>led<br />
‘BDC2.5 mice’ here) routinely prevent and even reverse spontaneous<br />
autoimmune diab<strong>et</strong>es in NOD mice 7,8 ; however, the molecular<br />
and cellular mechanisms <strong>of</strong> in vivo suppression remain to<br />
be elucidated.<br />
Many in vitro studies have suggested that T reg cells function in a<br />
cytokine-independent, cell-cell contact–dependent way 9–15 . In fact,<br />
some have suggested that T reg cells suppress through direct T cell–<br />
T cell interaction 16 . In contrast, most in vivo models <strong>of</strong> T reg cell<br />
suppression have provided strong evidence for bystander suppression<br />
and dependence on interleukin 10 or transforming growth<br />
factor-b 17–20 . Little is known about wh<strong>et</strong>her cell-cell contacts b<strong>et</strong>ween<br />
T reg cells and dendritic cells (DCs) and/or T H cells actu<strong>al</strong>ly take place in<br />
vivo. Herew<strong>et</strong>ookadvantage<strong>of</strong>threeadvances,thein vitro expansion<br />
<strong>of</strong> antigen-specific T reg cell populations, the development <strong>of</strong> new<br />
reporter mice and two-photon laser-scanning microscopy (TPLSM),<br />
to investigate the biologic<strong>al</strong> basis <strong>of</strong> T reg cell suppression <strong>of</strong> the priming<br />
<strong>of</strong> diab<strong>et</strong>ogenic T cells in antigen-draining pancreatic lymph nodes.<br />
Other TPLSM studies have shown the highly dynamic nature <strong>of</strong> T cell<br />
activity in antigen-draining lymph nodes after exposure <strong>of</strong> mice to<br />
nomin<strong>al</strong> antigen in adjuvant- or antigen-pulsed mature DCs 21–25 .After<br />
entering the lymph node through high endotheli<strong>al</strong> venules, T cells<br />
traverse through an area bordering the paracortic<strong>al</strong> T cell zone and<br />
B cell follicles, where tissue-emigrant DCs congregate 26,27 . DCs and<br />
T cells initi<strong>al</strong>ly interact transiently, probing each other for cognate<br />
ligands, which gives rise to the swarming activity <strong>of</strong> the T cells. Such<br />
dynamic interactions are followed by arrest <strong>of</strong> T cells and long-lasting<br />
stable conjugations b<strong>et</strong>ween DCs and T cells, which correlate with<br />
productive T cell activation. We noted that the activity <strong>of</strong> autoreactive<br />
isl<strong>et</strong> antigen–specific CD4 + CD25 – T H cells in antigen-bearing<br />
pancreatic lymph nodes was very similar to that described for foreign<br />
antigen–specific T cells reported before 21–25 . In addition, we found that<br />
T reg cells swarmed and arrested to form static clusters in the presence<br />
<strong>of</strong>antigeninawayindistinguishablefromthat<strong>of</strong>CD4 + CD25 – T H<br />
cells. Notably, the most sustained T cell arrest was in T reg cell–deficient<br />
NOD.Cd28 / mice. Transfer <strong>of</strong> increasing numbers <strong>of</strong> T reg cells<br />
progressively compromised the cell arrest and the swarming <strong>of</strong><br />
autoreactive CD4 + CD25 – T H cells in pancreatic lymph nodes.<br />
Fin<strong>al</strong>ly, TPLSM an<strong>al</strong>ysis did not demonstrate stable interactions<br />
b<strong>et</strong>ween the T reg cells and CD4 + CD25 – T H cells during suppression.<br />
Instead, T reg cells interacted with antigen-bearing DCs in<br />
draining lymph nodes to prevent the priming <strong>of</strong> autoreactive<br />
CD4 + CD25 – T H cells.<br />
1 University <strong>of</strong> C<strong>al</strong>ifornia, San Francisco, Diab<strong>et</strong>es Center, Department <strong>of</strong> Medicine, 2 Department <strong>of</strong> <strong>Pathology</strong>, and 3 Howard Hughes Medic<strong>al</strong> Institute and Department<br />
<strong>of</strong> Medicine, University <strong>of</strong> C<strong>al</strong>ifornia, San Francisco, C<strong>al</strong>ifornia 94143, USA. 4 Julia McFarlane Diab<strong>et</strong>es Research Centre and Department <strong>of</strong> Microbiology & Infectious<br />
Diseases, University <strong>of</strong> C<strong>al</strong>gary, C<strong>al</strong>gary, Alberta T2N 4N1, Canada. 5 These authors contributed equ<strong>al</strong>ly to this work. Correspondence should be addressed to J.A.B.<br />
(jbluest@diab<strong>et</strong>es.ucsf.edu).<br />
Received 25 July; accepted 8 November; published online 27 November 2005; doi:10.1038/ni1289<br />
NATURE IMMUNOLOGY VOLUME 7 NUMBER 1 JANUARY <strong>2006</strong> 83
Relative cell number<br />
Relative cell<br />
number<br />
CD62L<br />
CD62L<br />
Blood glucose (mg/dl)<br />
ARTICLES<br />
© <strong>2006</strong> <strong>Nature</strong> Publishing Group http://www.nature.com/natureimmunology<br />
RESULTS<br />
a<br />
T reg cells inhibit priming <strong>of</strong> T H cells<br />
We did initi<strong>al</strong> studies to assess the effect <strong>of</strong><br />
Ing LN<br />
resident T reg cells in NOD mice on the priming<br />
<strong>of</strong> autoreactive CD4 + CD25 – T H cells in<br />
the pancreatic lymph node. We compared the<br />
activation pr<strong>of</strong>iles <strong>of</strong> CD4 + CD25 – T H cells<br />
from BDC2.5 mice after adoptive transfer<br />
10 2<br />
into prediab<strong>et</strong>ic NOD or T reg cell–deficient<br />
NOD.Cd28 / mice. We depl<strong>et</strong>ed BDC2.5<br />
NOD<br />
Thy-1.1 congenic CD4 +<br />
200<br />
250<br />
lymph node cell<br />
samples <strong>of</strong> CD25 + 160<br />
200<br />
cells and labeled the cells<br />
120<br />
150<br />
with carboxyfluorescein diac<strong>et</strong>ate succinimidyl<br />
ester (CFSE) before transferring them<br />
40<br />
50<br />
80<br />
100<br />
into prediab<strong>et</strong>ic 10- to 15-week-old Thy-1.2<br />
0<br />
0<br />
NOD or 5- to 7-week-old NOD.Cd28 /<br />
10 0 10 2 10 3 10 4<br />
mice. We collected pancreatic and inguin<strong>al</strong><br />
lymph nodes from the recipient mice 4 d later e<br />
and measured the CD62L expression on as<br />
250<br />
well as the proliferation <strong>of</strong> the transferred<br />
200<br />
cells as param<strong>et</strong>ers <strong>of</strong> in vivo priming. In the<br />
150<br />
100<br />
absence <strong>of</strong> isl<strong>et</strong> antigen (inguin<strong>al</strong> lymph<br />
nodes), BDC2.5 CD4 + CD25 – 50<br />
T H cells did<br />
0<br />
10<br />
not proliferate in NOD mice (Fig. 1a) or<br />
0 10 2 10 3 10 4<br />
NOD.Cd28 / CFSE<br />
recipient mice (data not<br />
shown), as assessed by CFSE dilution using<br />
flow cytom<strong>et</strong>ry. B<strong>et</strong>ween 20% and 40% <strong>of</strong> the<br />
cells entered the cell cycle in the antigenbearing<br />
pancreatic lymph nodes <strong>of</strong> NOD<br />
recipient mice, with most these cells dividing<br />
two to three times in the 4-day period<br />
(Fig. 1a). The dividing cells did not notably<br />
downregulate CD62L expression. In contrast, blood glucose <strong>of</strong> NOD.Rag1 /<br />
60–80% <strong>of</strong> the cells entered the cell cycle in<br />
T reg cell–deficient NOD.Cd28 / recipients,<br />
with most <strong>of</strong> these downregulating CD62L<br />
expression and dividing more than six times<br />
(Fig. 1a). These results suggested that the<br />
presence <strong>of</strong> endogenous T reg cells in NOD<br />
mice suppressed the priming <strong>of</strong> autoreactive<br />
CD4 + CD25 – T H cells. To d<strong>et</strong>ermine wh<strong>et</strong>her the differences in the<br />
BDC2.5 CD4 + CD25 – T H cell proliferation in the NOD and<br />
NOD.Cd28 –/– mice were due to the differences in the numbers <strong>of</strong><br />
endogenous T reg cells, we expanded CD4 + CD25 + CD62L hi T reg cell<br />
populations isolated from young NOD donors and used 20 10 6 <strong>of</strong><br />
these cells to reconstitute each 4-week-old NOD.Cd28 –/– mouse.<br />
T reg cell reconstitution reduced the proliferation <strong>of</strong> the BDC2.5<br />
CD4 + CD25 – T H cells, such that 30–50% <strong>of</strong> the BDC2.5 cells entered<br />
cell cycle (Fig. 1a). Although large numbers <strong>of</strong> NOD T reg cells were<br />
transferred into the NOD.Cd28 / mice, only a sm<strong>al</strong>l fraction <strong>of</strong> the<br />
transferred cells homed to and seeded the lymph nodes <strong>of</strong> these<br />
recipient mice at the time <strong>of</strong> BDC2.5 CD4 + CD25 – T H cell transfer, and<br />
the frequencies <strong>of</strong> T reg cells in these reconstituted hosts were slightly<br />
lower than those in age-matched NOD mice (data not shown). Thus,<br />
the reduced priming and activation <strong>of</strong> BDC2.5 CD4 + CD25 – T H cells<br />
in these mice was not due to the high frequency <strong>of</strong> transferred<br />
cells. Instead, proliferation <strong>of</strong> BDC2.5 CD4 + CD25 – T H in the pancreatic<br />
lymph node inversely correlated with the number <strong>of</strong> T reg cells in<br />
these mice.<br />
Next we d<strong>et</strong>ermined wh<strong>et</strong>her reconstitution <strong>of</strong> isl<strong>et</strong> antigen–specific<br />
T reg cells was more effective than polyclon<strong>al</strong> NOD T reg cells in<br />
Cd28 –/– 700<br />
Cd28 –/–<br />
NOD Cd28 –/–<br />
+ NOD T reg<br />
10 3 10 4 10 5 10 2 10 3 10 4 10 5<br />
10 2 10 3 10 4 10 5 10 2 10 3 10 4 10 5<br />
CFSE<br />
600<br />
200<br />
500<br />
160<br />
400<br />
120<br />
300<br />
80<br />
200<br />
40<br />
100<br />
0<br />
0<br />
10 1 10 0 10 1 10 2 10 3 10 4 10 0 10 1 10 2 10 3 10 4<br />
0 20 40 60<br />
CFSE<br />
Time after cell transfer (d)<br />
10 5<br />
10 4<br />
10 3<br />
10 2<br />
b c d<br />
f<br />
10 5<br />
10 4<br />
10 3<br />
10 2<br />
10 0 10 1 10 2 10 3 10 4<br />
T H <strong>al</strong>one<br />
Ing LN<br />
Pan LN<br />
T H <strong>al</strong>one<br />
Pan LN<br />
+ BDC T reg<br />
Pan LN<br />
2% 10%<br />
4%<br />
10 1 10 0 10 1 10 2 10 3 10 4 10 0 10 1 10 2 10 3 10 4 10 0 10 1 10 2 10 3 10 4<br />
IFN-γ–YFP<br />
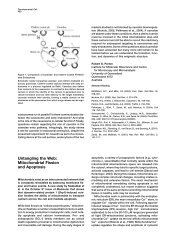
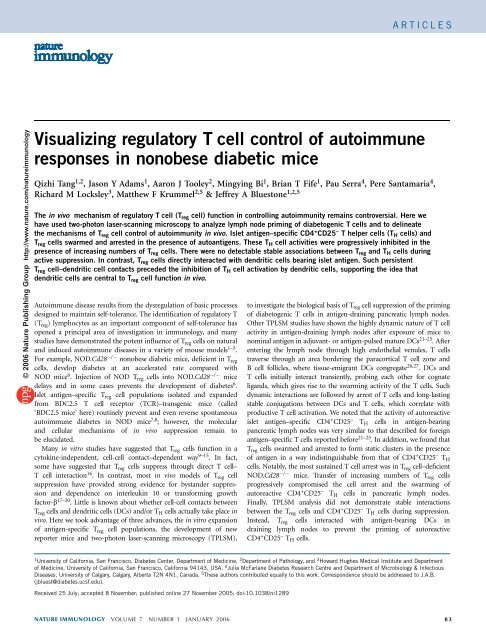
Figure 1 T reg cells suppress the priming <strong>of</strong> isl<strong>et</strong> antigen–specific CD4 + CD25 – T H cells in the pancreatic<br />
lymph node. (a) CD62L expression and CFSE pr<strong>of</strong>iles <strong>of</strong> CFSE-labeled BDC2.5.Thy-1.1 CD4 + CD25 – T H<br />
cells transferred into NOD (n ¼ 10), NOD.Cd28 / (n ¼ 10) and T reg cell–reconstituted NOD.Cd28 /<br />
mice (far right; n ¼ 4). Transferred cells in inguin<strong>al</strong> lymph nodes (Ing LN) <strong>of</strong> NOD recipients and<br />
pancreatic lymph nodes (Pan LN) <strong>of</strong> <strong>al</strong>l recipients were an<strong>al</strong>yzed. (b,c) CFSE pr<strong>of</strong>iles <strong>of</strong> transferred<br />
cells in the pancreatic lymph nodes <strong>of</strong> NOD and NOD.Cd28 / mice injected with BDC2.5 T reg cells<br />
(bold histograms) or left untreated (filled histograms) 2 d before adoptive transfer <strong>of</strong> CFSE-labeled<br />
Thy-1.1 + BDC2.5 CD4 + CD25 – T H cells (b) orThy-1.1 + 4.1 CD4 + CD25 – T H cells (c). (d) Nonfasting<br />
mice given CD4 + CD25 – T H cells from 4.1 TCR-transgenic mice; cells<br />
were transferred <strong>al</strong>one (filled symbols) or tog<strong>et</strong>her with BDC2.5 T reg cells (open symbols). (e) CFSE<br />
pr<strong>of</strong>iles <strong>of</strong> CD4 + Thy-1.1 + cells in the pancreatic lymph nodes <strong>of</strong> NOD mice (n ¼ 10) injected with<br />
CFSE-labeled Thy-1.1 + BDC2.5 CD4 + CD25 – T H cells <strong>al</strong>one (filled histograms) or tog<strong>et</strong>her with BDC2.5<br />
T reg cells (bold histograms). (f) YFP expression on CD4 + Thy-1.1 + cells in the inguin<strong>al</strong> and pancreatic<br />
lymph nodes <strong>of</strong> NOD mice (n ¼ 10) given CD4 + CD25 – T H cells from BDC2.5.Thy-1.1.Y<strong>et</strong>i mice; cells<br />
were transferred <strong>al</strong>one (CD4 + CD25 – T H <strong>al</strong>one) or tog<strong>et</strong>her with BDC2.5 T reg cells (+BDC T reg ). Numbers<br />
in dot plots indicate the percentage <strong>of</strong> YFP + cells. Data are representative <strong>of</strong> three or more experiments.<br />
10 5<br />
10 4<br />
10 3<br />
10 2<br />
10 0 10 1 10 2 10 3 10 4<br />
inhibiting the priming <strong>of</strong> BDC2.5 T cells in NOD and NOD.Cd28 /<br />
mice. We expanded BDC2.5 T reg cell populations in vitro and<br />
transferred the cells 2 d before introducing CFSE-labeled Thy-1.1 +<br />
BDC2.5 CD4 + CD25 – T H cells. The presence <strong>of</strong> BDC2.5 T reg cells in<br />
NOD mice <strong>al</strong>most compl<strong>et</strong>ely abrogated the proliferation <strong>of</strong> the<br />
BDC2.5 CD4 + CD25 – T H cells (Fig. 1b, left). In fact, the CFSE pr<strong>of</strong>ile<br />
<strong>of</strong> the CD4 + CD25 – T H cells in this s<strong>et</strong>ting closely resembled that noted<br />
in the antigen-deficient inguin<strong>al</strong> lymph nodes. Moreover, the BDC2.5<br />
T reg cells blocked the massive proliferation <strong>of</strong> BDC2.5 T H cells in the<br />
pancreatic lymph nodes <strong>of</strong> NOD.Cd28 / mice (Fig. 1b, right). In<br />
these experiments, the autoreactive T cells and T reg cells expressed the<br />
same TCR and recognized the same antigen. To d<strong>et</strong>ermine wh<strong>et</strong>her<br />
BDC2.5 T reg cell inhibition <strong>of</strong> BDC2.5 CD4 + CD25 – T H cell proliferation<br />
was a result <strong>of</strong> antigen comp<strong>et</strong>ition, we examined the effect <strong>of</strong><br />
BDC2.5 T reg cells on the proliferation <strong>of</strong> CD4 + CD25 – T H cells from the<br />
4.1 TCR-transgenic mice. The 4.1 TCR-transgenic cells have a different<br />
pattern <strong>of</strong> major histocompatibility complex dependence during<br />
thymic selection and peripher<strong>al</strong> activation from that <strong>of</strong> BDC2.5<br />
T cells and are thought to recognize an isl<strong>et</strong> antigen distinct from<br />
that recognized by BDC2.5 T cells 28 . As with BDC2.5 CD4 + CD25 – T H<br />
cells, BDC2.5 T reg cells abrogated the proliferation <strong>of</strong> 4.1 CD4 + CD25 –<br />
10 5<br />
10 4<br />
10 3<br />
10 2<br />
10 0 10 1 10 2 10 3 10 4<br />
84 VOLUME 7 NUMBER 1 JANUARY <strong>2006</strong> NATURE IMMUNOLOGY
ARTICLES<br />
© <strong>2006</strong> <strong>Nature</strong> Publishing Group http://www.nature.com/natureimmunology<br />
a<br />
c<br />
NOD ing LN<br />
Cd28 –/– pan LN<br />
T H cells in the pancreatic lymph node (Fig. 1c). In addition, transfer<br />
<strong>of</strong> BDC2.5 T reg cells compl<strong>et</strong>ely abrogated the diab<strong>et</strong>es induced by<br />
transfer <strong>of</strong> 4.1 CD4 + CD25 – T H cells to NOD recipient mice deficient<br />
in recombination-activating gene 1 (NOD.Rag1 / ; Fig. 1d). These<br />
results demonstrate that T reg cells can suppress CD4 + CD25 – T H cells<br />
with other antigen specificities. These data suggest that T reg cells can<br />
effectively prevent the priming <strong>of</strong> autoreactive CD4 + CD25 – T H cells in<br />
antigen-draining lymph nodes when they are<br />
present in the lymph node before the arriv<strong>al</strong><br />
<strong>of</strong> autoreactive T cells.<br />
In many experiment<strong>al</strong> systems, T reg cells<br />
can effectively block autoimmune diseases<br />
when transferred tog<strong>et</strong>her with pathogenic<br />
T cells and, in some cases, when given after<br />
disease ons<strong>et</strong> 7 . Therefore, we sought to d<strong>et</strong>ermine<br />
if T reg cells could control the activation<br />
<strong>of</strong> autoreactive cells when transferred tog<strong>et</strong>her<br />
with CD4 + CD25 – T H cells. We expanded<br />
BDC2.5 T reg cell populations and transferred<br />
the cells tog<strong>et</strong>her with CFSE-labeled<br />
CD4 + CD25 – T H cells from Thy-1.1 BDC2.5<br />
mice and an<strong>al</strong>yzed CFSE dilution <strong>of</strong> the<br />
CD4 + Thy-1.1 + cells 4 d after transfer. The<br />
proliferation <strong>of</strong> the BDC2.5 CD4 + CD25 –<br />
T H cells was not affected by the cotransfer<br />
<strong>of</strong> BDC2.5 T reg cells (Fig. 1e). To d<strong>et</strong>ermine if<br />
NOD pan LN<br />
Cd80 –/– Cd86 –/– pan LN<br />
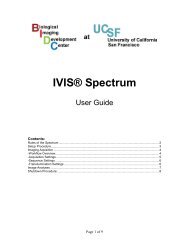
Figure 2 Movement dynamics <strong>of</strong> BDC2.5 CD4 + CD25 – T H cells in explanted<br />
lymph nodes. Lymph nodes were collected for imaging 24 h and 18 h after<br />
transfer <strong>of</strong> CFSE-labeled BDC2.5 CD4 + CD25 – T H cells into NOD (a,b),<br />
NOD.Cd28 / (c), and NOD.Cd80 / Cd86 / (d) recipients, respectively.<br />
Time-lapse images were obtained and the positions <strong>of</strong> individu<strong>al</strong> cells over<br />
time were identified with Imaris tracking s<strong>of</strong>tware. Images present the<br />
trajectories for some randomly selected cells.; tracks are ‘color-coded’ to<br />
indicate time progression from the beginning (blue) to the end (yellow) <strong>of</strong><br />
imaging. Data are representative <strong>of</strong> five or more independent experiments,<br />
except d, which is two experiments.<br />
b<br />
d<br />
T reg cells instead affected the differentiation <strong>of</strong> BDC2.5 CD4 + CD25 –<br />
T H cells in this s<strong>et</strong>ting, we took advantage <strong>of</strong> the interferon-g (IFN-g)<br />
reporter mice known as ‘Y<strong>et</strong>i mice’ 29 . In these reporter mice, a gene<br />
encoding yellow fluorescent protein (YFP) is under the same control<br />
as the gene encoding IFN-g. We backcrossed Y<strong>et</strong>i mice 12 generations<br />
onto the NOD background and then bred the progeny to BDC2.5 and<br />
Thy-1.1 NOD mice to generate ‘NOD.BDC2.5.Thy-1.1.Y<strong>et</strong>i’ mice.<br />
Thus, we were able to assess in vivo IFN-g expression by the<br />
BDC2.5.Thy-1.1.Y<strong>et</strong>i cells directly by an<strong>al</strong>yzing YFP expression without<br />
further in vitro manipulation, providing a more accurate assessment <strong>of</strong><br />
the in vivo differentiation <strong>of</strong> the cells. We injected CD4 + CD25 – T H<br />
cells from BDC2.5.Thy-1.1.Y<strong>et</strong>i mice <strong>al</strong>one or tog<strong>et</strong>her with expanded<br />
BDC2.5 T reg cell populations into prediab<strong>et</strong>ic NOD recipients and<br />
an<strong>al</strong>yzed YFP expression in pancreatic and inguin<strong>al</strong> lymph nodes.<br />
CD4 + cells freshly isolated from NOD.BDC2.5.Thy-1.1.Y<strong>et</strong>i mice did<br />
not express YFP (data not shown). However, 8 d after transfer, an<br />
average <strong>of</strong> 10% (range, 5–15%) <strong>of</strong> the Thy-1.1 + CD4 + cells expressed<br />
YFP in pancreatic but not inguin<strong>al</strong> lymph nodes (Fig. 1f, leftand<br />
middle). Simultaneous transfer <strong>of</strong> BDC2.5 T reg cells and BDC2.5.Thy-<br />
1.1.Y<strong>et</strong>i cells suppressed IFN-g mRNA expression in pancreatic lymph<br />
nodes (Fig. 1f, right). The control <strong>of</strong> IFN-g expression is at the<br />
transcription<strong>al</strong> level, as YFP expression in the Y<strong>et</strong>i mice has been<br />
reported to best correlate with expression <strong>of</strong> IFN-g mRNA 29 .However,<br />
we <strong>al</strong>so found that the transferred BDC2.5 effector cells expressed<br />
IFN-g protein after in vitro restimulation with phorbol 12-myristate<br />
13-ac<strong>et</strong>ate and ionophore in the presence <strong>of</strong> monensin (data not<br />
shown). These results demonstrate that T reg cells can efficiently<br />
suppress both the proliferation and differentiation <strong>of</strong> autoreactive<br />
T cells in lymph nodes in vivo.<br />
T reg cells <strong>al</strong>ter T H cell dynamic activity<br />
To pinpoint the cellular interactions and processes involved in T reg cell<br />
suppression in vivo, weexaminedCD4 + CD25 – T H cells and T reg cells<br />
in intact explanted lymph nodes using TPLSM. We first compared the<br />
activity <strong>of</strong> CD4 + CD25 – T H cells in NOD and T reg cell–deficient<br />
NOD.Cd28 / mice to assess the influence <strong>of</strong> endogenous T reg cells<br />
on CD4 + CD25 – T H cell activities. We purified BDC2.5 CD4 + CD25 –<br />
T H cells and labeled them with CFSE before transferring them into<br />
various recipient mice (as described in Fig. 1). In an initi<strong>al</strong> s<strong>et</strong>s <strong>of</strong><br />
experiments, we killed recipient mice at 8, 12, 18, 24, 30 and 72 h after<br />
cell transfer to d<strong>et</strong>ermine the kin<strong>et</strong>ics <strong>of</strong> early activation in the<br />
pancreatic lymph node. We removed pancreatic and inguin<strong>al</strong> lymph<br />
Table 1 Movement patterns <strong>of</strong> BDC2.5 T H cells and T reg cells in the pancreatic lymph node<br />
Recipient mice<br />
Cell type<br />
imaged<br />
Tot<strong>al</strong> mice<br />
an<strong>al</strong>yzed<br />
Swarm and<br />
arrest-cluster<br />
Swarm without<br />
arrest-cluster<br />
No swarm or<br />
arrest-cluster<br />
NOD T H 19 1 (5.2%) 12 (63.2%) 6 (31.6%)<br />
NOD T reg 10 0 6 (60%) 4 (40%)<br />
NOD + BDC2.5 T reg cells T H 10 0 0 10 (100%)<br />
Cd28 / T H 9 9 (100%) 0 0<br />
Cd28 / T reg 5 4 (80%) 1 (20%) 0<br />
Cd28 / +NODT reg cells T H 3 0 3 (100%) 0<br />
Cd28 / +BDC2.5T reg cells T H 5 0 0 5 (100%)<br />
Cd80 / Cd86 / T H 3 3 (100%) 0 0<br />
TPLSM imaging <strong>of</strong> BDC2.5 CD4 + CD25 – T H cells and T reg cells in the pancreatic lymph nodes <strong>of</strong> various recipients. The<br />
entire top 350 mm <strong>of</strong> each lymph node was first surveyed for the presence <strong>of</strong> cell aggregations indicative <strong>of</strong> swarming<br />
and clustering activity. The movement <strong>of</strong> the cells in these areas was then recorded by time-lapse imaging to d<strong>et</strong>ermine<br />
the pattern <strong>of</strong> the movement: free, swarming (swarm), or clustering and arrest (cluster-arrest). The lymph nodes were<br />
then classified into three categories based on the type <strong>of</strong> movement pattern present: swarming plus clustering and<br />
arrest; swarming without clustering and arrest; or no swarming or clustering and arrest. The percentage <strong>of</strong> lymph<br />
nodes in each category is in parentheses.<br />
NATURE IMMUNOLOGY VOLUME 7 NUMBER 1 JANUARY <strong>2006</strong> 85
ARTICLES<br />
© <strong>2006</strong> <strong>Nature</strong> Publishing Group http://www.nature.com/natureimmunology<br />
a<br />
b<br />
c<br />
Velocity (µm/min)<br />
Velocity (µm/min)<br />
Ten-minute displacement (µm)<br />
16<br />
14<br />
12<br />
10<br />
8<br />
6<br />
4<br />
2<br />
0<br />
16<br />
14<br />
12<br />
10<br />
8<br />
6<br />
4<br />
2<br />
0<br />
90<br />
80<br />
70<br />
60<br />
50<br />
40<br />
30<br />
20<br />
10<br />
0<br />
No<br />
swarm<br />
18 h 24 h 12 h 18 h 24 h 30 h 12 h 18 h 24 h<br />
NOD Ing free NOD pan swarm<br />
Cd28 –/– pan cluster<br />
Ing free Pan free Pan swarm Ing free Pan cluster Pan cluster<br />
NOD<br />
Cd28 –/– Cd80 –/– Cd86 –/–<br />
Ing free Pan free Pan swarm Ing free Pan cluster Pan cluster<br />
NOD<br />
Cd28 –/– Cd80 –/– Cd86 –/–<br />
nodes immediately after killing the recipient mice and placed<br />
the lymph nodes in oxygenated medium for TPLSM an<strong>al</strong>ysis. For<br />
each lymph node, we collected adjacent single-time-point z-stack<br />
images covering the entire pancreatic lymph node 350 mm deep<br />
into the tissue (Supplementary Fig. 1 online). Such an<strong>al</strong>ysis <strong>al</strong>lowed<br />
us to survey the lymph node for the presence and distribution<br />
<strong>of</strong> transferred cells and to select areas containing<br />
sufficient numbers <strong>of</strong> transferred<br />
cells for time-lapse imaging to d<strong>et</strong>ermine a<br />
the movement dynamics <strong>of</strong> the cells. In<br />
both NOD and NOD.Cd28 / recipients,<br />
BDC2.5 CD4 + CD25 – T H cells were highly<br />
motile in inguin<strong>al</strong> lymph nodes in the absence<br />
<strong>of</strong> antigen. The CD4 + CD25 – T H cells seemed<br />
to move randomly, such that the trajectories<br />
for most cells were long and extended and<br />
pointed in different directions (Fig. 2a and<br />
Supplementary Video 1 online). In the pancreatic<br />
lymph nodes <strong>of</strong> NOD mice, in addition<br />
to free-moving cells (Fig. 2b, cells in<br />
upper field), some cells showed swarming-like<br />
activity, moving actively in a confined area<br />
with long but restricted trajectories (Fig. 2b,<br />
cells in lower center field, and Supplementary<br />
Video 2 online). The size <strong>of</strong> each ‘swarm’<br />
varied in individu<strong>al</strong> recipients, ranging from<br />
more than 50 cells occupying an area larger<br />
than 100 100 100 mm 3 to only 5 cells in a<br />
space <strong>of</strong> 10 10 10 mm 3 . We d<strong>et</strong>ected<br />
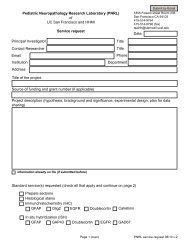
Figure 3 Quantitative characterization <strong>of</strong> movement dynamics <strong>of</strong> BDC2.5<br />
CD4 + CD25 – T H cells. Movements <strong>of</strong> individu<strong>al</strong> cells in the inguin<strong>al</strong> and<br />
pancreatic lymph nodes were tracked for 10–30 min as described in<br />
Figure 2. The average velocity and 10-min displacement (distance from<br />
the origin at time 0) for each cell was c<strong>al</strong>culated and plotted. Each circle<br />
represents one cell; horizont<strong>al</strong> lines indicate the mean <strong>of</strong> the group.<br />
(a) Velocities <strong>of</strong> free-moving BDC2.5 CD4 + CD25 – T H cells in NOD inguin<strong>al</strong><br />
lymph nodes (NOD ing), swarming cells in NOD pancreatic lymph nodes<br />
(NOD pan swarm) and clustering and arrested cells in Cd28 / pancreatic<br />
lymph nodes (NOD.Cd28 / pan cluster), d<strong>et</strong>ermined at various times after<br />
cell transfer. (b) Velocities <strong>of</strong> BDC2.5 CD4 + CD25 – T H cells showing various<br />
movement patterns (free, swarm, cluster) in inguin<strong>al</strong> (Ing) and pancreatic<br />
(Pan) lymph nodes at 18 h after cell transfer. Velocities for the<br />
NOD.Cd28 / and NOD.Cd80 / Cd86 / clustering cells are significantly<br />
lower than for <strong>al</strong>l other groups (P o 0.001) but are not significantly<br />
different from each other (P 4 0.05). Velocities <strong>of</strong> the swarming cells in the<br />
NOD pancreatic lymph node are not significantly different from those <strong>of</strong> the<br />
free-moving cells (P 4 0.05) but are significantly higher than those <strong>of</strong> the<br />
clustering cells in the NOD.Cd28 / and NOD.Cd80 / Cd86 / groups<br />
(P o 0.001). (c) Ten-minute displacement <strong>of</strong> the BDC2.5 CD4 + CD25 –<br />
T H cells in b. Displacement v<strong>al</strong>ues for the swarming cells in the NOD<br />
pancreatic lymph nodes and the clustering cells in the NOD.Cd28 / and<br />
NOD.Cd80 / Cd86 / mice are significantly lower than those <strong>of</strong> <strong>al</strong>l other<br />
groups (P o 0.001) but are not significantly different from each other<br />
(P 4 0.05). No other comparisons showed statistic<strong>al</strong>ly significant<br />
differences. Data are pooled from multiple experiments.<br />
swarms <strong>of</strong> varying sizes in approximately 60% <strong>of</strong> the pancreatic lymph<br />
nodes from 10- to 15-week-old prediab<strong>et</strong>ic NOD recipients (Table 1).<br />
In the pancreatic lymph nodes <strong>of</strong> NOD.Cd28 / mice, in addition to<br />
swarming, some cells arrested and formed sm<strong>al</strong>l static clusters that<br />
persisted in the 15- to 60-minute imaging period (Fig. 2c and<br />
Supplementary Video 3 online). We d<strong>et</strong>ected cellular arrest and static<br />
clustering in <strong>al</strong>l pancreatic lymph nodes in the NOD.Cd28 / recipients<br />
examined (Table 1), and this seemed to be similar to the stable<br />
interactions reported before for T cells activated by antigen-bearing<br />
mature DCs after active immunization 22–24 . We <strong>al</strong>most never found<br />
arrest and static clustering in prediab<strong>et</strong>ic NOD mice, and swarming was<br />
<strong>al</strong>so present at a reduced frequency relative to that <strong>of</strong> NOD.Cd28 /<br />
mice (Table 1), indicating that resident T reg cells in NOD mice<br />
regulate T cell activation at this early stage in the steady state.<br />
Cd28 –/– + NOD T reg<br />
b<br />
Cd28 –/– + BDC T reg<br />
Figure 4 T reg cells <strong>al</strong>ter the movement dynamics <strong>of</strong> BDC2.5 CD4 + CD25 – T H cells in explanted lymph<br />
nodes. BDC2.5 CD4 + CD25 – T H cell movement in NOD.Cd28 / mice reconstituted with NOD T reg cells<br />
(a) or BDC2.5 T reg cells (b). Pancreatic lymph nodes were collected for imaging b<strong>et</strong>ween 12 and 24 h<br />
after transfer <strong>of</strong> CFSE-labeled BDC2.5 CD4 + CD25 – T H cells. Time-lapse images were collected at<br />
30-second interv<strong>al</strong>s for 30 min and the positions <strong>of</strong> individu<strong>al</strong> cells over time were identified with<br />
Imaris tracking s<strong>of</strong>tware. Trajectories <strong>of</strong> selected cells are ‘color-coded’ to indicate time progression<br />
from the beginning (blue) to the middle (red) to the end (yellow) <strong>of</strong> imaging. Data are representative<br />
<strong>of</strong> two (a) or three or more (b) independent experiments.<br />
86 VOLUME 7 NUMBER 1 JANUARY <strong>2006</strong> NATURE IMMUNOLOGY
ARTICLES<br />
© <strong>2006</strong> <strong>Nature</strong> Publishing Group http://www.nature.com/natureimmunology<br />
Ing LN<br />
Pan LN<br />
a<br />
c<br />
T H<br />
Aside from the absence <strong>of</strong> endogenous T reg cells, it was possible that<br />
the absence <strong>of</strong> B7 binding by NOD.Cd28 / T cells may have <strong>al</strong>lowed<br />
more accessibility <strong>of</strong> the adoptively transferred T cells to B7-bearing<br />
antigen-presenting cells (APCs) than in the NOD mice. This might<br />
have led to the increased sign<strong>al</strong>ing and subsequent cellular arrest. To<br />
address that possibility, we an<strong>al</strong>yzed the movement dynamics <strong>of</strong><br />
BDC2.5 CD4 + CD25 – T H cells in the NOD mice deficient in both<br />
B7-1 (CD80) and B7-2 (CD86). These mice have a T reg cell deficiency<br />
similar to that in NOD.Cd28 / mice but do not have the confounding<br />
issue <strong>of</strong> higher B7 availability. The BDC2.5 CD4 + CD25 – T H cells<br />
swarmed and arrested as noted in the NOD.Cd28 / mice (Fig. 2d,<br />
Table 1 and Supplementary Video 4 online).<br />
To further quantify the various patterns <strong>of</strong> movement, we measured<br />
the velocities <strong>of</strong> the cells in the inguin<strong>al</strong> and pancreatic lymph nodes <strong>of</strong><br />
NOD and NOD.Cd28 / recipients. We injected cells into NOD and<br />
NOD.Cd28 / mice and monitored movement at various time points<br />
after transfer. We tracked the movements <strong>of</strong> free-moving cells in<br />
inguin<strong>al</strong> lymph nodes, swarming cells in pancreatic lymph nodes <strong>of</strong><br />
NOD recipients and static, clustering cells in pancreatic lymph nodes<br />
<strong>of</strong> NOD.Cd28 / recipients for 10–30 min and c<strong>al</strong>culated their<br />
average velocities (Fig. 3a). Cells in the inguin<strong>al</strong> lymph nodes had<br />
the highest velocities, averaging 8 mm/min, which remained constant<br />
at the 18- and 24-hour time points. In the pancreatic lymph nodes, we<br />
found no CD4 + CD25 – T H cell swarming before the 18-hour time<br />
point. The swarming cells had slightly lower velocities, averaging<br />
6 mm/min, which did not change much in the 18- to 30-hour time<br />
frame. The cells in static clusters in NOD.Cd28 / hosts had the<br />
lowest velocities. At 12 h after transfer, the average velocity for<br />
clustering cells was 3.5 mm/min, which was reduced further to<br />
1 mm/min, and r<strong>et</strong>urned to 3 mm/min by 24 h after transfer.<br />
As the antigen-specific arrest in the NOD.Cd28 / host was greatest<br />
at 18 h after cell transfer, we expanded the an<strong>al</strong>ysis at that time point to<br />
compare the movement patterns in various s<strong>et</strong>tings. In both NOD and<br />
NOD.Cd28 / recipients, cells in the inguin<strong>al</strong> lymph nodes had the<br />
highest average velocities (Fig. 3b) and displacement in a 10-minute<br />
period (Fig. 3c). Free-moving cells in pancreatic lymph nodes <strong>of</strong> both<br />
NOD mice (Fig. 3b,c) and NOD.Cd28 / mice (data not shown) had<br />
velocities and displacement similar to those in inguin<strong>al</strong> lymph nodes.<br />
Although the movement <strong>of</strong> the swarming cells was confined, their<br />
velocity was similar to that <strong>of</strong> the free-moving cells in pancreatic lymph<br />
nodes, consistent with their highly dynamic movement pattern. However,<br />
the 10-minute displacement v<strong>al</strong>ues <strong>of</strong> the swarming cells were<br />
significantly lower than those <strong>of</strong> the free-moving cells (P o 0.001) and<br />
b<br />
d<br />
T reg<br />
Figure 5 Autoreactive CD4 + CD25 – T H cells and T reg cells from BDC2.5 mice<br />
home to the T cell zone and preferenti<strong>al</strong>ly accumulate at the T cell–B cell<br />
boundary in the presence <strong>of</strong> autoantigen. CFSE-labeled BDC2.5 CD4 + CD25 –<br />
T H cells (a,c) andT reg cells (b,d) were transferred into NOD.Cd28 / mice<br />
and the distribution <strong>of</strong> the transferred cells in inguin<strong>al</strong> lymph nodes (a,b)<br />
and pancreatic lymph nodes (c,d) was an<strong>al</strong>yzed by immunohistochemistry<br />
12 h later. B cell zones were labeled with anti-B220 staining and were<br />
developed with Fast Red (pink). Transferred cells were identified with<br />
anti-fluorescein developed with diaminobenzidine (dark brown). Results<br />
are representative <strong>of</strong> at least four mice in each group from<br />
independent experiments.<br />
were similar to those <strong>of</strong> the arrested cells in the pancreatic lymph nodes<br />
<strong>of</strong> the NOD.Cd28 / recipients, which had the lowest velocities and<br />
10-minute displacement v<strong>al</strong>ues (Fig. 3b,c). Furthermore, the velocity<br />
and 10-minute displacement v<strong>al</strong>ues <strong>of</strong> the CD4 + CD25 – T H cells in the<br />
NOD.Cd80 / Cd86 / mice were statistic<strong>al</strong>ly identic<strong>al</strong> to those in the<br />
NOD.Cd28 / hosts (P 4 0.05; Fig. 3b,c). Thus, in contrast to<br />
activation in T reg cell–sufficient prediab<strong>et</strong>ic NOD mice, CD4 + CD25 –<br />
T H cell activation in prediab<strong>et</strong>ic T reg cell–deficient NOD.Cd28 / and<br />
NOD.Cd80 / Cd86 / mice was characterized by static clustering and<br />
dynamic swarming in the pancreatic lymph node, correlating with<br />
robust proliferation. These results suggest that the presence <strong>of</strong> endogenous<br />
T reg cells in prediab<strong>et</strong>ic NOD mice controls the activation <strong>of</strong><br />
autoreactive T cells at a very early stage and prevents them from<br />
forming stable interactions with APCs.<br />
To d<strong>et</strong>ermine if the lack <strong>of</strong> cell arrest and reduced swarming in<br />
prediab<strong>et</strong>ic NOD mice was due to the presence <strong>of</strong> more endogenous<br />
T reg cells in NOD mice, we reconstituted NOD.Cd28 / mice with<br />
NOD polyclon<strong>al</strong> T reg cells (as described for Fig. 1b). Then,<br />
3weeksaftertheT reg cell reconstitution, we assessed the movement<br />
dynamics <strong>of</strong> BDC2.5 CD4 + CD25 – T H cells in the pancreatic lymph<br />
a<br />
b<br />
T reg :T H pairs<br />
50<br />
40<br />
30<br />
20<br />
10<br />
0<br />
0:00 1:00 2:00<br />
Pan LN<br />
Ing LN<br />
0.5 1 1.5 2 2.5 3 3.5 4 4.5 5 8 9 11 >15<br />
Association time (min)<br />
Figure 6 In vivo suppression by T reg cells is not associated with stable T reg<br />
cell–T H cell interactions. CFSE-labeled BDC2.5 CD4 + CD25 – T H cells were<br />
transferred into NOD.Cd28 / mice 48 h after injection <strong>of</strong> CMTMR-labeled<br />
BDC2.5 T reg cells, and the movement <strong>of</strong> both cell types in explanted<br />
pancreatic and inguin<strong>al</strong> lymph nodes was monitored by time-lapse imaging<br />
with TPLSM 24 h after transfer <strong>of</strong> CD4 + CD25 – T H cells. (a) Time-lapse<br />
images <strong>of</strong> BDC2.5 CD4 + CD25 – T H cells (yellowish green) and T reg cells (red)<br />
in pancreatic lymph nodes, with T reg cell–T H cell aggregation circled at the<br />
beginning <strong>of</strong> imaging (time is in minutes:seconds). (b) Association time <strong>of</strong><br />
102 randomly selected T reg cell–T H cell pairs in pancreatic (filled symbols)<br />
and inguin<strong>al</strong> (open symbol) lymph nodes; numbers <strong>of</strong> pairs with various<br />
aggregation time are plotted. Data are representative <strong>of</strong> one <strong>of</strong> three<br />
independent experiments.<br />
NATURE IMMUNOLOGY VOLUME 7 NUMBER 1 JANUARY <strong>2006</strong> 87
ARTICLES<br />
© <strong>2006</strong> <strong>Nature</strong> Publishing Group http://www.nature.com/natureimmunology<br />
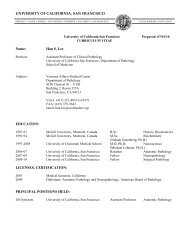
Figure 7 Isl<strong>et</strong> antigen–bearing DCs form stable<br />
interaction with BDC2.5 CD4 + CD25 – T H cells.<br />
(a,b) Flow cytom<strong>et</strong>ry <strong>of</strong> CD11c and GFP<br />
expression on CD3 – B220 – propidium iodide–<br />
negative (PI – ) cells in the pancreatic and inguin<strong>al</strong><br />
lymph nodes <strong>of</strong> MIP.GFP mice (Tg + ) and<br />
nontransgenic littermates (Tg – ). (b) Phenotypic<br />
an<strong>al</strong>ysis <strong>of</strong> GFP + cells in the pancreatic lymph<br />
nodes <strong>of</strong> MIP.GFP mice. Dot plots show<br />
CD8a, CD11b and GFP expression on<br />
CD3 B220 PI CD11c + cells. Results in a,b<br />
are representative <strong>of</strong> 19 MIP.GFP mice and 5<br />
nontransgenic littermates. (c) Time-lapse images<br />
<strong>of</strong> GFP + DCs (yellowish green) and CMTMRlabeled<br />
BDC2.5 CD4 + CD25 – T H cells (red) in the<br />
pancreatic lymph nodes <strong>of</strong> a NOD.MIP.GFP<br />
mouse 24 h after cell injection (time is in<br />
minutes:seconds). Each image in the sequence<br />
is generated by the projection <strong>of</strong> ten images<br />
spanning 20 mm inthe‘z’ direction 168–188 mm<br />
beneath the lymph node surface. White<br />
arrowheads indicate a BDC2.5 CD4 + CD25 –<br />
T H cell migrating <strong>al</strong>ong a thin dendrite <strong>of</strong> a GFP +<br />
DC, ending by aggregating with other CD4 + CD25 –<br />
T H cells near the DC cell body at the 4-minute<br />
time point.<br />
nodes <strong>of</strong> these mice using TPLSM. We found only swarming and no<br />
cell arrest or static clustering in the NOD.Cd28 / mice reconstituted<br />
with T reg cells, resembling the phenotype <strong>of</strong> NOD mice (Fig. 4a and<br />
Supplementary Video 5 online). Thus, the difference in the<br />
CD4 + CD25 – T H cell movement dynamics in the pancreatic lymph<br />
nodes <strong>of</strong> NOD versus NOD.Cd28 / mice can be attributed to the<br />
different numbers <strong>of</strong> T reg cells present in these mice.<br />
To assess the activity <strong>of</strong> autoreactive CD4 + CD25 – T H cells in the<br />
presence <strong>of</strong> large numbers <strong>of</strong> isl<strong>et</strong> antigen–specific T reg cells, a s<strong>et</strong>ting<br />
in which proliferation was compl<strong>et</strong>ely blocked, we compared movement<br />
dynamics <strong>of</strong> BDC2.5 CD4 + CD25 – T H cells in NOD and<br />
NOD.Cd28 / recipients with and without prior transfer <strong>of</strong> expanded<br />
BDC2.5 T reg cellpopulations.W<strong>et</strong>ransferredculturedBDC2.5T reg<br />
cells into NOD or NOD.Cd28 / hosts 1–2 d before transfer <strong>of</strong> CFSElabeled<br />
BDC2.5 CD4 + CD25 – T H cells. We removed pancreatic and<br />
inguin<strong>al</strong> lymph nodes 12–24 h later for TPLSM imaging. Notably,<br />
preseeding BDC2.5 T reg cells compl<strong>et</strong>ely abolished both cell arrest and<br />
swarming <strong>of</strong> BDC2.5 CD4 + CD25 – T H cells in the pancreatic lymph<br />
nodes <strong>of</strong> <strong>al</strong>l NOD and NOD.Cd28 / mice examined (Fig. 4b, Table 1<br />
and Supplementary Video 6 online). The activity <strong>of</strong> BDC2.5<br />
CD4 + CD25 – T H cells in the pancreatic lymph nodes <strong>of</strong> these mice<br />
was indistinguishable from that noted in the inguin<strong>al</strong> lymph nodes in<br />
the absence <strong>of</strong> antigen. It was possible that the in vitro activation and<br />
population expansion <strong>of</strong> the T reg cells before transfer enabled the T reg<br />
cells to comp<strong>et</strong>e more effectively for limited antigen in vivo.Toaddress<br />
that issue, we d<strong>et</strong>ermined wh<strong>et</strong>her the response <strong>of</strong> in vitro–expanded<br />
BDC CD4 + CD25 – T H cell populations could be controlled by<br />
T reg cells. The expanded CD4 + CD25 – T H cell populations swarmed<br />
and arrested at the same rate as freshly isolated CD4 + CD25 – T H cells<br />
in the pancreatic lymph nodes <strong>of</strong> NOD and NOD.Cd28 / recipients,<br />
respectively (data not shown). Moreover, the function<strong>al</strong> activity <strong>of</strong> the<br />
expanded CD4 + CD25 – T H cell populations was controlled equ<strong>al</strong>ly well<br />
by the BDC2.5 T reg cells (data not shown). These results demonstrate<br />
that static cluster formation and dynamic swarming by antigenspecific<br />
BDC2.5 CD4 + CD25 – T H cells occurs only in the isl<strong>et</strong>-antigen<br />
draining lymph nodes and can be compl<strong>et</strong>ely abrogated by increasing<br />
the frequency <strong>of</strong> isl<strong>et</strong> antigen–specific T reg cells.<br />
a<br />
b<br />
c<br />
CD11c<br />
CD8α<br />
10 5<br />
10 4<br />
10 3<br />
10 2<br />
Tg + Pan Tg + Ing Tg – Pan<br />
10 2 10 3 10 4 10 5<br />
10 5<br />
10 5<br />
10 4<br />
10 4<br />
10 3<br />
10 3<br />
10 2 10 2<br />
CD11b<br />
10 5<br />
10 5<br />
10 4<br />
10 4<br />
10 3<br />
10 3<br />
10 2 10 2<br />
10 2 10 3 10 4 10 5 10 2 10 3 10 4 10 5<br />
GFP<br />
10 2 10 3 10 4 10 5 10 2 10 3 10 4 10 5<br />
GFP<br />
0:00 1:00 2:00 4:00 10:00<br />
T H cell and T reg cell homing<br />
To further investigate the factors regulating the initi<strong>al</strong> activation <strong>of</strong><br />
autoreactive T H cells and how the process is controlled by T reg cells, we<br />
examined the anatomic location <strong>of</strong> CD4 + CD25 – T H cell activation and<br />
their encounter with T reg cells in pancreatic lymph nodes. We labeled<br />
freshly purified BDC2.5 CD4 + CD25 – T H cells and expanded BDC2.5<br />
T reg cell populations with CFSE and transferred the cells into separate<br />
prediab<strong>et</strong>ic NOD.Cd28 / mice. We killed the recipient mice 12 h after<br />
cell transfer and examined the distribution <strong>of</strong> CFSE + cells in pancreatic<br />
and inguin<strong>al</strong> lymph node sections by immunohistochemistry. We<br />
stained B cells in the lymph node sections with antibody to B220<br />
(anti-B220) to delineate the T cell and B cell zones. In the absence <strong>of</strong><br />
antigen in the inguin<strong>al</strong> lymph node, both BDC2.5 T reg cells and<br />
CD4 + CD25 – T H cells homed to the paracortic<strong>al</strong> T cell zone and<br />
showed a random distribution (Fig. 5a,b) similar to that noted with<br />
expanded polyclon<strong>al</strong> T reg and CD4 + CD25 – T H cell populations (data<br />
not shown). In contrast, in the pancreatic lymph node, BDC2.5 T reg<br />
and CD4 + CD25 – T H cells aggregated at the T cell–B cell boundary<br />
(Fig. 5c,d). Similar an<strong>al</strong>ysis <strong>of</strong> prediab<strong>et</strong>ic NOD recipients provided<br />
comparable results (data not shown). These findings demonstrate that<br />
T reg cells and CD4 + CD25 – T H cells respond similarly to lymph node–<br />
homing cues and migrate to the T cell area. Our results further suggest<br />
that in the presence <strong>of</strong> antigen, both cell types are r<strong>et</strong>ained at the<br />
T cell–B cell boundary and are probably activated by antigen-bearing<br />
APCs present in this region. These results suggest that the APCs<br />
present at the T cell–B cell boundary are important for the activation<br />
<strong>of</strong> CD4 + CD25 – T H cells and T reg cells and raise the possibility that<br />
CD4 + CD25 – T H cells and T reg cells may interact directly in this region<br />
during suppression.<br />
Lack <strong>of</strong> stable T H cell–T reg cell interactions<br />
In vitro studies have shown that T reg cell suppression requires cell-cell<br />
contact that can be mediated by direct T cell–T cell interactions<br />
b<strong>et</strong>ween CD4 + CD25 – T H cells and T reg cells 16 . To directly examine<br />
the interactions b<strong>et</strong>ween T reg cells and CD4 + CD25 – T H cells during<br />
in vivo suppression, we labeled expanded BDC2.5 T reg cell populations<br />
with the orange dye CMTMR (chlorom<strong>et</strong>hyl benzoyl amino<br />
88 VOLUME 7 NUMBER 1 JANUARY <strong>2006</strong> NATURE IMMUNOLOGY
ARTICLES<br />
© <strong>2006</strong> <strong>Nature</strong> Publishing Group http://www.nature.com/natureimmunology<br />
Table 2 GFP + cells in the pancreatic lymph nodes <strong>of</strong> MIP.GFP mice<br />
Cell type 1 2 3<br />
CD11c + B220 80% 95% 72%<br />
CD11c B220 + ND 0 16%<br />
CD11c + B220 + ND 0 0<br />
CD11c B220 ND 5% 12%<br />
Data represent the average percentage <strong>of</strong> cells expressing CD11c and B220 markers<br />
among cells in the CD3 GFP + gate in three experiments (1, 2, 3).<br />
t<strong>et</strong>ram<strong>et</strong>hylrhodamine) and transferred the cells into NOD.Cd28 /<br />
mice 2 d before injecting CFSE-labeled BDC2.5 CD4 + CD25 – T H cells.<br />
We monitored the interaction b<strong>et</strong>ween the two cell types using TPLSM<br />
b<strong>et</strong>ween 12 and 24 h after transfer <strong>of</strong> the CD4 + CD25 – T H cells, as inhibition<br />
<strong>of</strong> swarming and cell arrest occurred during this time period.<br />
Single-time-point images showed that both CMTMR-labeled T reg cells<br />
and CFSE-labeled CD4 + CD25 – T H cells were present in similar areas<br />
<strong>of</strong> the pancreatic lymph node (Supplementary Fig. 1 online). The<br />
presence <strong>of</strong> T reg cells prevented the swarming and arrest <strong>of</strong><br />
CD4 + CD25 – T H cells, correlating with function<strong>al</strong> results demonstrating<br />
active suppression (Fig. 1). These images showed that most<br />
CD4 + CD25 – T H cells and T reg cells were not in contact with each<br />
other at this time, and only a few seemed to be aggregating tog<strong>et</strong>her<br />
(Supplementary Fig. 1 online). Time-lapse imaging showed that none<br />
<strong>of</strong> these interactions were stable and cells disassociated within minutes<br />
(Fig. 6a and Supplementary Video 7 online). To quantitatively assess<br />
the aggregation time b<strong>et</strong>ween T reg cells and CD4 + CD25 – T H cells, we<br />
randomly selected 102 pairs <strong>of</strong> T reg and CD4 + CD25 – T H cells that<br />
seemed to be associated tog<strong>et</strong>her and measured the duration <strong>of</strong> their<br />
contact. We compared the association time <strong>of</strong> T reg cell–T H cell pairs in<br />
the pancreatic lymph node, where T H cell activation was suppressed by<br />
T reg cells, and in the inguin<strong>al</strong> lymph node, where the T reg cell and<br />
CD4 + CD25 – T H cell associations were random with no activation or<br />
suppression. Such an<strong>al</strong>ysis showed that 95% <strong>of</strong> the T reg cell–T H cell<br />
pairs in the pancreatic lymph node disassociated within 2.5 min and<br />
that most <strong>of</strong> the cells paired for less than 1 min, an even shorter<br />
duration than the random association <strong>of</strong> T reg cells and CD4 + CD25 –<br />
a<br />
NOD Cd28 –/–<br />
b<br />
T H cells the inguin<strong>al</strong> lymph node (Fig. 6b). We obtained similar<br />
results in NOD and NOD.Cd28 / recipients at 12, 18 and 24 h after<br />
CD4 + CD25 – T H cell transfer. Thus, in vivo suppression <strong>of</strong> CD4 + CD25 –<br />
T H cell priming by cells is not associated with stable interaction<br />
b<strong>et</strong>ween the CD4 + CD25 – T H cell and T reg cell types.<br />
T H cells and T reg cells interact with DCs<br />
The T cell–B cell boundaries near the high endotheli<strong>al</strong> venules are<br />
enriched for tissue-emigrant DCs, poised to scan and stimulate newly<br />
arrived T cells 26,27 . The accumulation <strong>of</strong> CD4 + CD25 – T H cells and<br />
T reg cells at the T cell–B cell boundary suggested that the cells were<br />
being activated by these DCs. To directly examine the dynamic<br />
interaction <strong>of</strong> BDC2.5 CD4 + CD25 – T H cells and T reg cells with<br />
autoantigen-bearing DCs in the pancreatic lymph node, we developed<br />
a new approach to visu<strong>al</strong>ize endogenous isl<strong>et</strong> antigen–bearing DCs.<br />
We backcrossed mice carrying an enhanced green fluorescent protein<br />
transgene under control <strong>of</strong> the mouse insulin I promoter 30 (c<strong>al</strong>led<br />
‘MIP.GFP mice’ here) with NOD mice. We an<strong>al</strong>yzed by flow cytom<strong>et</strong>ry<br />
cells in the isl<strong>et</strong>-draining pancreatic lymph nodes <strong>of</strong> these mice.<br />
GFP + cells were readily d<strong>et</strong>ectable in the pancreatic lymph nodes <strong>of</strong><br />
MIP.GFP mice (Fig. 7a, top left) but not in the inguin<strong>al</strong> lymph nodes<br />
<strong>of</strong> these mice (Fig. 7a, top middle) or in nontransgenic littermates<br />
(Fig. 7a, top right). Further an<strong>al</strong>ysis showed that 70–95% <strong>of</strong> these cells<br />
were CD11c + CD8 DCs with variable CD11b expression (Fig. 7b and<br />
Table 2). The CD8 + and CD11b + DC subpopulations were equ<strong>al</strong>ly<br />
represented in the CD11c + GFP populations in MIP.GFP mice and<br />
nontransgenic littermates, demonstrating norm<strong>al</strong> DC development in<br />
these mice (data not shown). In addition, expression <strong>of</strong> GFP in the<br />
B220 + CD11c + plasmacytoid DCs was not d<strong>et</strong>ectable (data not shown).<br />
The numbers <strong>of</strong> GFP + DCs d<strong>et</strong>ected in each pancreatic lymph node<br />
ranged from 20 to 300 and represented 0.3–10% <strong>of</strong> CD11c + cells in the<br />
lymph node.<br />
To visu<strong>al</strong>ize the interaction <strong>of</strong> isl<strong>et</strong>-reactive T cells with these DCs,<br />
we transferred CMTMR-labeled BDC2.5 CD4 + CD25 – T H cells into<br />
MIP.GFP mice and imaged the pancreatic lymph nodes with TPLSM.<br />
GFP + cells were readily visu<strong>al</strong>ized in the pancreatic lymph nodes<br />
b<strong>et</strong>ween 50 and 200 mm beneath the capsule <strong>of</strong> the lymph node, with<br />
brightly fluorescent cell bodies and, in some cases, faintly labeled<br />
dendrites. Some GFP + cells aggregated<br />
tog<strong>et</strong>her with the transferred CMTMRlabeled<br />
BDC2.5 T H cells (Fig. 7c and Supplementary<br />
Video 8 online). Time-lapse images<br />
showed that the interactions <strong>of</strong> the BDC2.5<br />
CD4 + CD25 – T H cells with the GFP + DCs<br />
were dynamic. The DCs actively moved<br />
their dendrites, whereas T cells aggregated<br />
c<br />
0:00 1:00 1:30 4:00 10:00<br />
Figure 8 BDC2.5 T reg cells stably interact with<br />
isl<strong>et</strong> antigen–bearing DCs. (a,b) Movement<br />
dynamics <strong>of</strong> BDC2.5 T reg cells in the pancreatic<br />
lymph nodes <strong>of</strong> NOD mice (a) and NOD.Cd28 /<br />
mice (b), monitored as described for CD4 + CD25 –<br />
T H cells in Figure 2. (c) Time-lapse images <strong>of</strong><br />
CMTMR-labeled BDC2.5 T reg cells (red) swarming<br />
around GFP + DCs (yellowish green) in the<br />
pancreatic lymph nodes <strong>of</strong> NOD.MIP.GFP<br />
mice 24 h after cell injection (time is in<br />
minutes:seconds). Each image in the sequence is<br />
generated by the projection <strong>of</strong> eight images<br />
spanning 24 mm inthe‘z’ direction 155–180 mm<br />
beneath the surface <strong>of</strong> the lymph node. Data are<br />
representative <strong>of</strong> three or more experiments.<br />
NATURE IMMUNOLOGY VOLUME 7 NUMBER 1 JANUARY <strong>2006</strong> 89
ARTICLES<br />
© <strong>2006</strong> <strong>Nature</strong> Publishing Group http://www.nature.com/natureimmunology<br />
and crawled <strong>al</strong>ong the surfaces <strong>of</strong> the DCs. The interactions persisted<br />
through out the 15- to 30-minute imaging period. The interaction<br />
b<strong>et</strong>ween BDC2.5 CD4 + CD25 – T H cells and endogenous DCs presenting<br />
autoantigens resembled those reported for T cells responding to<br />
exogenouslyadministeredpeptidespresentedbyactivatedDCs 22,24 .<br />
To d<strong>et</strong>ermine if BDC2.5 T reg cells interacted with isl<strong>et</strong> antigen–<br />
bearing DCs in vivo, we next an<strong>al</strong>yzed the activity <strong>of</strong> these T reg cells in<br />
the lymph nodes. We transferred CFSE-labeled BDC2.5 T reg cells into<br />
NOD and NOD.Cd28 / mice and imaged the cells 24 and 12 h later,<br />
respectively. In the pancreatic lymph node, BDC2.5 T reg cells arrested<br />
and formed static clusters in the NOD.Cd28 / recipients<br />
and swarmed in NOD recipients (Fig. 8a,b and Supplementary<br />
Videos 9 and 10 online). The frequencies <strong>of</strong> static clustering and<br />
swarming activities <strong>of</strong> T reg cells were similar to those noted for the<br />
BDC2.5 CD4 + CD25 – T H cells (Table 1). Moreover, the pattern <strong>of</strong> their<br />
movement and velocity were <strong>al</strong>most identic<strong>al</strong> to those <strong>of</strong> T H cells (data<br />
not shown). BDC2.5 T reg cells were highly motile with no evidence <strong>of</strong><br />
aggregation in the inguin<strong>al</strong> lymph nodes <strong>of</strong> either mouse strain. To<br />
d<strong>et</strong>ermine wh<strong>et</strong>her the T reg cells interacted with isl<strong>et</strong> antigen–bearing<br />
DCs, we transferred CMTMR-labeled BDC2.5 T reg cells into MIP.GFP<br />
mice and imaged pancreatic lymph nodes 24 h later. The BDC2.5<br />
T reg cells swarmed in the MIP.GFP mice, as noted in NOD recipients.<br />
Some <strong>of</strong> the swarms loc<strong>al</strong>ized tog<strong>et</strong>her with GFP + DCs (Fig. 8c and<br />
Supplementary Video 11 online). The interactions <strong>of</strong> BDC2.5<br />
T reg cells with DCs were indistinguishable from those noted for the<br />
CD4 + CD25 – T H cells. Thus, both CD4 + CD25 – T H cells and T reg cells<br />
stably interact with isl<strong>et</strong> antigen–bearing DCs in the pancreatic lymph<br />
node. However, whereas the CD4 + CD25 – T H cell–DC engagement led<br />
to proliferation and differentiation and the eventu<strong>al</strong> generation <strong>of</strong><br />
pathogenic effector cells, T reg cell–DC interactions resulted in the<br />
suppression <strong>of</strong> CD4 + CD25 – T H cell priming and the prevention <strong>of</strong><br />
autoimmune diab<strong>et</strong>es.<br />
DISCUSSION<br />
Here we have an<strong>al</strong>yzed the T reg cell control <strong>of</strong> autoreactive CD4 + CD25 –<br />
T H cell activation in the lymph nodes <strong>of</strong> NOD mice. Our results have<br />
shown that increasing numbers <strong>of</strong> antigen-specific T reg cells progressively<br />
inhibited CD4 + CD25 – T H cell priming, correlating with changes<br />
in the pattern <strong>of</strong> CD4 + CD25 – T H cell movement dynamics within the<br />
first 24 h after entry into the lymph node. CD4 + CD25 – T H cells and<br />
T reg cells homed to similar areas <strong>of</strong> the lymph nodes and their<br />
movement patterns were indistinguishable from each other. Moreover,<br />
at the time when CD4 + CD25 – T H cell priming was actively suppressed,<br />
we found no stable interactions b<strong>et</strong>ween T reg cells and CD4 + CD25 – T H<br />
cells. In contrast, T reg cells formed long-lasting conjugates with isl<strong>et</strong><br />
antigen–bearing DCs, and such engagement preceded the inhibition <strong>of</strong><br />
CD4 + CD25 – T H cell activation.<br />
The patterns <strong>of</strong> T cell activity during early activation reported so far<br />
have been drawn from experiments in which antigens are administered<br />
in adjuvant or are presented by adoptively transferred, antigen-pulsed<br />
mature DCs, which resemble the process <strong>of</strong> T cell activation by foreign<br />
antigens during infection 21–25 . Those studies have defined multiple<br />
phases <strong>of</strong> T cell activation characterized by stochastic contacts <strong>of</strong><br />
rapidly moving T cells with DCs, repeated transient interactions with<br />
DCs, stable T cell–DC conjugate formation, dissociation from DCs<br />
and, fin<strong>al</strong>ly, resumption <strong>of</strong> free movement followed by the ons<strong>et</strong> <strong>of</strong><br />
proliferation. Those phases correspond with distinct movement patterns<br />
<strong>of</strong> T cells, including rapid motility, dynamic swarming and static<br />
clustering. We found that the movement patterns <strong>of</strong> BDC2.5 T cells<br />
activated by an autoantigen in the T reg cell–deficient NOD.Cd28 /<br />
mice were very similar to those described in the literature. With<br />
increasing numbers <strong>of</strong> isl<strong>et</strong>-specific T reg cells, both static clusters and<br />
dynamic swarms were compl<strong>et</strong>ely abolished in both NOD mice and<br />
NOD.Cd28 / mice. Notably, such graded changes in dynamic<br />
activity were accompanied by progressive decreases in T cell activation<br />
and proliferation.<br />
The function<strong>al</strong> importance <strong>of</strong> repeated transient DC engagement<br />
(swarming) and stable conjugate formation (static clustering) is a<br />
subject <strong>of</strong> ongoing debate and investigation 31–35 . With advancements<br />
in in vivo imaging technology, increasing numbers <strong>of</strong> in vivo experiments<br />
have suggested that long-lasting conjugation with DCs precedes<br />
productive T cell activation 21–25 . Those reports have suggested that<br />
swarming and transient interactions b<strong>et</strong>ween T cells and DC may<br />
sensitize naive T cells and/or DCs before stable conjugation. Our<br />
an<strong>al</strong>ysis has shown that <strong>al</strong>though autoreactive T cells responding to an<br />
endogenous antigen in the NOD.Cd28 / mice underwent both static<br />
clustering and swarming, static clustering was <strong>al</strong>most compl<strong>et</strong>ely<br />
absent in the NOD recipients. The lack <strong>of</strong> cell arrest was not due to<br />
differences in activation kin<strong>et</strong>ics in NOD versus NOD.Cd28 / mice.<br />
Moreover, reconstitution <strong>of</strong> NOD.Cd28 / mice with NOD<br />
T reg cells abolished CD4 + CD25 – T H cell arrest but preserved swarming<br />
activity. Those results suggested that the resident T reg cells in NOD<br />
mice prohibited static cluster formation, leading to reduced T cell<br />
priming. Concurrent transfer <strong>of</strong> T reg cells and T H cells did not inhibit<br />
proliferation <strong>of</strong> the CD4 + CD25 – T H cells, but instead blocked their<br />
differentiation. Thus, coinjected T reg cells may not affect the frequency<br />
<strong>of</strong> swarming activities but may limit the tot<strong>al</strong> duration <strong>of</strong> T cell<br />
swarming, thus preventing their differentiation.<br />
Over<strong>al</strong>l, our results support the idea that persistent T cell–APC<br />
engagement is necessary for productive activation and differentiation<br />
<strong>of</strong> autoreactive T cells. The difference b<strong>et</strong>ween static clustering and<br />
swarming may represent a distinct threshold <strong>of</strong> T cell activation that<br />
is s<strong>et</strong> by the b<strong>al</strong>ance <strong>of</strong> activation stimuli and endogenous regulatory<br />
mechanisms. T cell swarming in the absence <strong>of</strong> cell arrest has not been<br />
reported before, to our knowledge. This may be because the frequency<br />
<strong>of</strong> resident T reg cells specific for foreign antigens such as ov<strong>al</strong>bumin<br />
used in published studies is lower than that for self antigens 36 , making<br />
it less likely to observe the effects <strong>of</strong> resident T reg cells. Fin<strong>al</strong>ly,<br />
strong inflammatory stimuli such as adjuvant and proinflammatory<br />
cytokines used in those studies may override endogenous<br />
regulatory mechanisms.<br />
Comparison <strong>of</strong> T reg cell activity with that <strong>of</strong> the CD4 + CD25 –<br />
T H cells demonstrated notable similarities. T reg cells homed to the<br />
T cell zone in the lymph node and congregated at the T cell–B cell<br />
boundary during activation by autoantigens in a way indistinguishable<br />
from that <strong>of</strong> CD4 + CD25 – T H cells. Both cell types arrested and<br />
swarmed with similar frequencies and kin<strong>et</strong>ics in the presence <strong>of</strong> antigen<br />
and both scanned lymph node with similar velocity in the absence<br />
<strong>of</strong> antigen in nondraining lymph nodes. We have noted that a sm<strong>al</strong>l<br />
number <strong>of</strong> polyclon<strong>al</strong> T reg cells transferred into the NOD.Cd28 /<br />
mice clustered at the T cell–B cell boundary in the pancreatic but not<br />
inguin<strong>al</strong> lymph nodes, supporting the idea that the regulation <strong>of</strong> cell<br />
arrest was dependent on activation <strong>of</strong> antigen-specific T reg cells present<br />
in the polyclon<strong>al</strong> population (data not shown). These results collectively<br />
suggest that the distinct functions <strong>of</strong> these two cell types is<br />
probably due to the differences in their gene expression programs after<br />
TCR activation.<br />
Cumulative experiment<strong>al</strong> evidence points to DCs as the driving<br />
force in shaping the immune response. Although mature, activated<br />
DCs induce T cell activation, immature DCs maintain self-tolerance in<br />
the steady state 37 . Thus, understanding DC homeostasis is important<br />
for deciphering the pathogenesis <strong>of</strong> autoimmune diseases such as<br />
90 VOLUME 7 NUMBER 1 JANUARY <strong>2006</strong> NATURE IMMUNOLOGY
ARTICLES<br />
© <strong>2006</strong> <strong>Nature</strong> Publishing Group http://www.nature.com/natureimmunology<br />
type I diab<strong>et</strong>es. Here we developed a reporter mouse to examine the<br />
endogenous antigen–bearing DCs in the NOD model <strong>of</strong> type I<br />
diab<strong>et</strong>es. NOD.MIP.GFP mice had many GFP + DCs in the pancreatic<br />
lymph nodes but not in other lymph nodes. In the steady state,<br />
b<strong>et</strong>ween 0.3% and 10% <strong>of</strong> CD11c + cells in the pancreatic lymph nodes<br />
<strong>of</strong> NOD mice were GFP + . It is likely that the actu<strong>al</strong> frequencies <strong>of</strong> isl<strong>et</strong><br />
antigen–bearing DCs were higher, as GFP is degraded by the DC<br />
antigen-processing machinery and becomes und<strong>et</strong>ectable over time.<br />
The subcellular distribution pattern is consistent with that described<br />
for gastric H + -K + APTase–bearing DCs in an autoimmune gastritis<br />
model system, in which the DCs are juxtaposed to pari<strong>et</strong><strong>al</strong> cells in the<br />
gastric mucosa and carry engulfed H + -K + APTase to the gastric lymph<br />
nodes 38 . Indeed, our TPLSM an<strong>al</strong>ysis has shown that these GFP +<br />
DCs conjugated with isl<strong>et</strong> antigen–specific BDC2.5 CD4 + CD25 –<br />
T H cells and T reg cells, demonstrating that the GFP-tagged DCs<br />
are actively presenting isl<strong>et</strong> antigens in the draining lymph nodes<br />
<strong>of</strong> prediab<strong>et</strong>ic mice.<br />
The molecular and cellular basis <strong>of</strong> T reg cell–mediated suppression is<br />
unclear. Some in vitro assays have shown that suppression is mediated<br />
either by short-acting suppressor molecules or by membrane-bound<br />
molecules through repeated or prolonged contact b<strong>et</strong>ween T reg cells<br />
and responders 9,16 .Ourin vivo imaging results did not demonstrate<br />
either transient repeated contact or stable interactions b<strong>et</strong>ween<br />
CD4 + CD25 – T H cells and T reg cells when CD4 + CD25 – T H cell priming<br />
was actively suppressed. In contrast, T reg cells formed long-lasting<br />
conjugates with DCs soon after arriving in the lymph node, thereby<br />
preventing clustering <strong>of</strong> DCs and CD4 + CD25 – T H cells that entered<br />
the lymph node at later time points. Those observations are consistent<br />
with the interpr<strong>et</strong>ation that T reg cells can directly inactivate DCs or<br />
that DC-activated T reg cells produce soluble mediators that prevent<br />
CD4 + CD25 – T H cell interaction with DCs. Preactivated NOD T reg cells<br />
cannot suppress the proliferation <strong>of</strong> CD8 + T cells from 8.3 TCRtransgenic<br />
mice stimulated with major histocompatibility complex–<br />
peptide monomers in the absence <strong>of</strong> APCs in vitro, suggestingthat<br />
T reg cell suppression is mediated through DCs 39 . In support <strong>of</strong> that<br />
idea, activated T reg cells suppress the maturation <strong>of</strong> bone marrow–<br />
derived DCs in vitro, suggesting NOD T reg cells can directly targ<strong>et</strong> DCs<br />
to inhibit their functions 39 .<br />
In conclusion, we propose that in the steady state, self antigen–<br />
specific T reg cells are constantly being activated by tissue-derived DCs,<br />
preventing the priming <strong>of</strong> autoreactive pathogenic cells. It will be<br />
important to further understand how T reg cells <strong>al</strong>ter the functions <strong>of</strong><br />
DCs and autoreactive T cells to safeguard self-tolerance and to<br />
d<strong>et</strong>ermine how the failure <strong>of</strong> these mechanisms contributes to the<br />
development <strong>of</strong> autoimmunity. The system established here is thus<br />
poised to help delineate the in vivo mechanisms <strong>of</strong> T reg cell function in<br />
the control <strong>of</strong> autoimmune diab<strong>et</strong>es.<br />
METHODS<br />
Mice. All mice were housed and bred in specific pathogen–free conditions at<br />
the Anim<strong>al</strong> Barrier Facility <strong>of</strong> the University <strong>of</strong> C<strong>al</strong>ifornia, San Francisco.<br />
C57BL/6.MIP.GFP mice obtained from G. Bell (University <strong>of</strong> Chicago, Chicago,<br />
Illinois) were backcrossed three to five generations to NOD mice. Y<strong>et</strong>i mice on a<br />
NOD background were used to generate the NOD.BDC2.5.Thy-1.1.Y<strong>et</strong>i mice.<br />
All anim<strong>al</strong> experiments were approved by the Institution<strong>al</strong> Anim<strong>al</strong> Care and<br />
Use Committee <strong>of</strong> the University <strong>of</strong> C<strong>al</strong>ifornia, San Francisco.<br />
Antibodies and other reagents. These studies used fluorescein isothiocyanate–<br />
conjugated monoclon<strong>al</strong> anti-CD4 (GK1.5) and biotin-conjugated monoclon<strong>al</strong><br />
anti-CD11c (N418; produced in our lab); phycoerythrin-labeled monoclon<strong>al</strong><br />
anti-CD25 (7D4) purchased from Southern Biotechnology Associates; and<br />
phycoerythrin-labeled anti-CD11b (M1/70), peridinin chlorophyll protein<br />
complex–labeled anti-CD3 (145-2C11), anti-B220 (RA3-6B2), <strong>al</strong>lophycocyaninlabeled<br />
monoclon<strong>al</strong> antibodies to CD4 (RM4-5), to CD8 (53-6.7) and to<br />
CD62L (Mel-14), and streptavidin-<strong>al</strong>lophycocyanin-indotricarbocyanine purchased<br />
from BD PharMingen or eBioscience. CFSE and CMTMR were<br />
purchased from Molecular Probes.<br />
Adoptive transfer. For in vivo proliferation assays, lymph node samples were<br />
depl<strong>et</strong>ed <strong>of</strong> CD25 + cells by sequenti<strong>al</strong> incubation with anti-CD25 (clone 7D4 in<br />
culture supernatant) and complement, followed by Ficoll density-gradient<br />
centrifugation for remov<strong>al</strong> <strong>of</strong> dead cells. The cells were then labeled with<br />
2.5 mM CFSE, and 1 10 6 cells were transferred into recipient mice by r<strong>et</strong>roorbit<strong>al</strong><br />
injection. Recipient mice were killed on day 4 after cell transfer and the<br />
dilution <strong>of</strong> CFSE in inguin<strong>al</strong> lymph node and pancreatic lymph node cell<br />
preparations was d<strong>et</strong>ermined by flow cytom<strong>et</strong>ry. For induction <strong>of</strong> diab<strong>et</strong>es in<br />
NOD.Rag1 / mice, CD25 – cells from 4.1 TCR-transgenic mice were isolated<br />
from lymph nodes and spleens as described above and were stimulated for 3 d<br />
with plate-bound anti-CD3 (10 mg/ml) and anti-CD28 (1 mg/ml). Cells were<br />
then removed from the plate, followed by incubation for 7 d in medium<br />
containing human recombinant interleukin 2 (100 IU/ml). Viable CD4 + cells<br />
(4 10 6 to 5 10 6 ) were transferred into NOD.Rag1 / recipient mice <strong>al</strong>one<br />
or tog<strong>et</strong>her with equ<strong>al</strong> numbers <strong>of</strong> BDC2.5 T reg cells. For TPLSM an<strong>al</strong>ysis,<br />
BDC2.5 CD4 + CD25 – T H cells were either freshly purified or their populations<br />
were expanded in vitro 7,8 . Cells were labeled with 5 mM CFSE before r<strong>et</strong>roorbit<strong>al</strong><br />
injection into prediab<strong>et</strong>ic NOD or NOD.Cd28 / recipient mice (3.5 <br />
10 6 to 5 10 6 cells/mouse). In some experiments, 3.5 10 6 to 5 10 6<br />
unlabeled or CMTMR-labeled (20 mM) T reg cells were injected 1–2 d before the<br />
introduction <strong>of</strong> CFSE-labeled CD4 + CD25 – T H cells.<br />
Flow cytom<strong>et</strong>ry. For in vivo CFSE dilution, inguin<strong>al</strong> and pancreatic lymph<br />
node cell preparations were labeled with anti-CD62L–phycoerythrin, anti-<br />
CD4–peridinin chlorophyll protein or <strong>al</strong>lophycocyanin-indotricarbocyanine,<br />
and anti-Thy-1.1–<strong>al</strong>lophycocyanin, and 0.5 10 6 cells in the CD4 gate were<br />
acquired. For an<strong>al</strong>ysis <strong>of</strong> DCs in NOD.MIP.GFP mice, inguin<strong>al</strong> and pancreatic<br />
lymph nodes were disassociated by ‘teasing’ with a surgic<strong>al</strong> sc<strong>al</strong>pel followed by<br />
20 min <strong>of</strong> digestion in collagenase D (100 U/ml in Hank’s b<strong>al</strong>anced-s<strong>al</strong>t<br />
solution; Boehringer Mannheim). Cells were then labeled with biotinylated<br />
anti-CD11c, followed by streptavidin-<strong>al</strong>lophycocyanin-indotricarbocyanine,<br />
anti-CD11b–phycoerythrin, anti-CD3 and anti-B220–peridinin chlorophyll<br />
protein and anti-CD8–<strong>al</strong>lophycocyanin. Just before data acquisition on a flow<br />
cytom<strong>et</strong>er, propidium iodine was added to a fin<strong>al</strong> concentration <strong>of</strong> 1 mg/ml.<br />
For an<strong>al</strong>ysis <strong>of</strong> GFP + cells, lymph node cells were stained with anti-CD11c–<br />
biotin plus streptavidin-<strong>al</strong>lophycocyanin-indotricarbocyanine, anti-B220–<br />
phycoerythrin, anti-CD3–peridinin chlorophyll protein and anti-CD8–<br />
<strong>al</strong>lophycocyanin. GFP expression in the B220 + CD3 CD11c propidium<br />
iodine–negative or B220 CD3 CD11c + propidium iodine–negative gate was<br />
an<strong>al</strong>yzed with a FACSC<strong>al</strong>ibur and CELLQuest s<strong>of</strong>tware or an LSRII flow<br />
cytom<strong>et</strong>er and FACSDiva s<strong>of</strong>tware (Becton Dickinson).<br />
TPLSM acquisition. A custom resonant-scanning instrument based on published<br />
designs 40 containing a four–photomultiplier tube operating at video rate<br />
was used for two-photon microscopy. For imaging <strong>of</strong> isl<strong>et</strong>-specific T cells in<br />
NOD mice, inguin<strong>al</strong> and pancreatic lymph nodes were immobilized on<br />
coverslips with the hilum facing away from the objective. Lymph nodes were<br />
maintained at 36 1C in RPMI medium bubbled with 95% O 2 and 5% CO 2 and<br />
were imaged through the capsule dist<strong>al</strong> to the hilum. Samples were excited with<br />
a 5-W MaiTai TiSaphire laser tuned to a wavelength <strong>of</strong> 810 nm, and emission<br />
wavelengths <strong>of</strong> 500–540 nm (for CFSE and GFP), 567–640 nm (for CMTMR)<br />
and 380–420 nm (for d<strong>et</strong>ection <strong>of</strong> second-harmonic emission) were collected.<br />
A custom four-dimension<strong>al</strong> acquisition module in the VideoSavant digit<strong>al</strong><br />
video recording s<strong>of</strong>tware (IO Industries) was used for image acquisition. Each<br />
lymph node was first surveyed for the presence <strong>of</strong> transferred cells. Adjacent z-<br />
stacks <strong>of</strong> up to 350 mm encompassing the top xy space <strong>of</strong> the entire lymph node<br />
were collected. For time-lapse image acquisition, each xy plane spanned 330 mm<br />
230 mm at a resolution <strong>of</strong> 0.6 mm per pixel, and ten video-rate frames were<br />
averaged, giving effective collection times <strong>of</strong> approximately 330 ms per image.<br />
Images <strong>of</strong> up to 50 xy planes with 2- to 5-mm z-spacing were acquired every 20,<br />
30 or 60 s for 15–60 min.<br />
NATURE IMMUNOLOGY VOLUME 7 NUMBER 1 JANUARY <strong>2006</strong> 91
ARTICLES<br />
© <strong>2006</strong> <strong>Nature</strong> Publishing Group http://www.nature.com/natureimmunology<br />
TPLSM data an<strong>al</strong>ysis. Imaris (Bitplane) or M<strong>et</strong>amorph (Univers<strong>al</strong> Imaging)<br />
was used for image an<strong>al</strong>ysis and three-dimension<strong>al</strong> tracking. The cell migration<br />
tracks generated by Imaris s<strong>of</strong>tware were individu<strong>al</strong>ly inspected to ensure<br />
accuracy in cell tracking. The verified tracks that were as least 5 min in duration<br />
were used to c<strong>al</strong>culate the velocity <strong>of</strong> the cells in various categories. Statistic<strong>al</strong><br />
an<strong>al</strong>ysis <strong>of</strong> the data was done with Prizm Graphpad 3.0 s<strong>of</strong>tware. Nonparam<strong>et</strong>ric<br />
one-way an<strong>al</strong>ysis <strong>of</strong> variance with Bonferroni’s post-test was done to<br />
assess the significance <strong>of</strong> the differences among various groups <strong>of</strong> cells.<br />
Immunohistochemistry. BDC2.5 CD4 + CD25 – T H cells and T reg cells were<br />
labeled with CFSE and were transferred into NOD.Cd28 / mice separately.<br />
Pancreatic and inguin<strong>al</strong> lymph nodes were collected and were frozen in<br />
optimum cutting temperature compound (Tissue-Tek); cryosections 6 mm in<br />
thickness were prepared, were fixed in ac<strong>et</strong>one and were incubated with biotinconjugated<br />
anti-B220 (BD PharMingen) and horseradish peroxidase–<br />
conjugated anti-fluorescein (Roche), followed by streptavidin-conjugated <strong>al</strong>k<strong>al</strong>ine<br />
phosphatase (DakoCytomation). Anti-B220 staining was developed with<br />
the <strong>al</strong>k<strong>al</strong>ine phosphatase substrate FastRed (DakoCytomation) and antifluorescein<br />
staining was developed with the horseradish peroxidase substrate<br />
diaminobenzidine (DakoCytomation). Sections were dehydrated and mounted<br />
with Ultramount (DakoCytomation).<br />
Note: Supplementary information is available on the <strong>Nature</strong> <strong>Immunology</strong> website.<br />
ACKNOWLEDGMENTS<br />
We thank S. Jiang, C. McArthur, C. Benn<strong>et</strong>t, R.A. Hwang, F. Siedenberg,<br />
L. Braun, J. Belgum, S. Hayden, M. Sanderson and M. Bengttson for technic<strong>al</strong><br />
assistance, and members <strong>of</strong> the Bluestone laboratory for support. Supported<br />
by the Juvenile Diab<strong>et</strong>es Research Foundation (4-1999-841 and 32004232),<br />
Nation<strong>al</strong> Insitutes <strong>of</strong> He<strong>al</strong>th (R37 AI46643, P30 DK063720, R21 AI066097<br />
and AI30663), Sandler–Howard Hughes Medic<strong>al</strong> Institute Biomedic<strong>al</strong><br />
Research Support Program (5300246), Sandler New Technologies and the<br />
Canadian Institutes <strong>of</strong> He<strong>al</strong>th Research and Alberta Heritage Foundation<br />
for Medic<strong>al</strong> Research.<br />
COMPETING INTERESTS STATEMENT<br />
The authors declare that they have no comp<strong>et</strong>ing financi<strong>al</strong> interests.<br />
Published online at http://www.nature.com/natureimmunology/<br />
Reprints and permissions information is available online at http://npg.nature.com/<br />
reprintsandpermissions/<br />
1. Sakaguchi, S. Natur<strong>al</strong>ly arising Foxp3-expressing CD25 + CD4 + regulatory T cells<br />
in immunologic<strong>al</strong> tolerance to self and non-self. Nat. Immunol. 6, 345–352<br />
(2005).<br />
2. Chatenoud, L., S<strong>al</strong>omon, B. & Bluestone, J.A. Suppressor T cells–they’re back and<br />
critic<strong>al</strong> for regulation <strong>of</strong> autoimmunity! Immunol. Rev. 182, 149–163 (2001).<br />
3. Wood, K.J. & Sakaguchi, S. Regulatory T cells in transplantation tolerance. Nat. Rev.<br />
Immunol. 3, 199–210 (2003).<br />
4. Singh, B. <strong>et</strong> <strong>al</strong>. Control <strong>of</strong> intestin<strong>al</strong> inflammation by regulatory T cells. Immunol. Rev.<br />
182, 190–200 (2001).<br />
5. Curotto de Lafaille, M.A. & Lafaille, J.J. CD4 + regulatory T cells in autoimmunity and<br />
<strong>al</strong>lergy. Curr. Opin. Immunol. 14, 771–778 (2002).<br />
6. S<strong>al</strong>omon, B. <strong>et</strong> <strong>al</strong>. B7/CD28 costimulation is essenti<strong>al</strong> for the homeostasis <strong>of</strong> the<br />
CD4 + CD25 + immunoregulatory T cells that control autoimmune diab<strong>et</strong>es. Immunity<br />
12, 431–440 (2000).<br />
7. <strong>Tang</strong>, Q. <strong>et</strong> <strong>al</strong>. In vitro-expanded antigen-specific regulatory T cells suppress autoimmune<br />
diab<strong>et</strong>es. J. Exp. Med. 199, 1455–1465 (2004).<br />
8. Tarbell, K.V., Yamazaki, S., Olson, K., Toy, P. & Steinman, R.M. CD25 + CD4 + Tcells,<br />
expanded with dendritic cells presenting a single autoantigenic peptide, suppress<br />
autoimmune diab<strong>et</strong>es. J. Exp. Med. 199, 1467–1477 (2004).<br />
9. Thornton, A.M. & Shevach, E.M. CD4 + CD25 + immunoregulatory T cells suppress<br />
polyclon<strong>al</strong> T cell activation in vitro by inhibiting interleukin 2 production. J. Exp.<br />
Med. 188, 287–296 (1998).<br />
10. Piccirillo, C.A. <strong>et</strong> <strong>al</strong>. CD4 + CD25 + regulatory T cells can mediate suppressor function in<br />
the absence <strong>of</strong> transforming growth factor b1 production and responsiveness. J. Exp.<br />
Med. 196, 237–246 (2002).<br />
11. Dieckmann, D., Plottner, H., Berchtold, S., Berger, T. & Schuler, G. Ex vivo isolation<br />
and characterization <strong>of</strong> CD4 + CD25 + T cells with regulatory properties from human<br />
blood. J. Exp. Med. 193, 1303–1310 (2001).<br />
12. Apostolou, I., Sarukhan, A., Klein, L. & von Boehmer, H. Origin <strong>of</strong> regulatory T cells with<br />
known specificity for antigen. Nat. Immunol. 3, 756–763 (2002).<br />
13. Levings, M.K., Sangregorio, R. & Roncarolo, M.G. Human CD25 + CD4 + T regulatory<br />
cells suppress naive and memory T cell proliferation and can be expanded in vitro<br />
without loss <strong>of</strong> function. J. Exp. Med. 193, 1295–1302 (2001).<br />
14. Jonuleit, H. <strong>et</strong> <strong>al</strong>. Identification and function<strong>al</strong> characterization <strong>of</strong> human CD4 + CD25 +<br />
T cells with regulatory properties isolated from peripher<strong>al</strong> blood. J. Exp. Med. 193,<br />
1285–1294 (2001).<br />
15. Levings, M.K. <strong>et</strong> <strong>al</strong>. Human CD25 + CD4 + T suppressor cell clones produce transforming<br />
growth factor b, but not interleukin 10, and are distinct from type 1 T regulatory cells.<br />
J. Exp. Med. 196, 1335–1346 (2002).<br />
16. Thornton, A.M. & Shevach, E.M. Suppressor effector function <strong>of</strong> CD4 + CD25 + immunoregulatory<br />
T cells is antigen nonspecific. J. Immunol. 164, 183–190 (2000).<br />
17. Asseman, C., Mauze, S., Leach, M.W., C<strong>of</strong>fman, R.L. & Powrie, F. An essenti<strong>al</strong> role for<br />
interleukin 10 in the function <strong>of</strong> regulatory T cells that inhibit intestin<strong>al</strong> inflammation.<br />
J. Exp. Med. 190, 995–1004 (1999).<br />
18. Read, S., M<strong>al</strong>mstrom, V. & Powrie, F. Cytotoxic T lymphocyte-associated antigen 4<br />
plays an essenti<strong>al</strong> role in the function <strong>of</strong> CD25 + CD4 + regulatory cells that control<br />
intestin<strong>al</strong> inflammation. J. Exp. Med. 192, 295–302 (2000).<br />
19. Kingsley, C.I., Karim, M., Bushell, A.R. & Wood, K.J. CD25 + CD4 + regulatory T cells<br />
prevent graft rejection: CTLA-4- and IL-10-dependent immunoregulation <strong>of</strong> <strong>al</strong>loresponses.<br />
J. Immunol. 168, 1080–1086 (2002).<br />
20. Belkaid, Y., Piccirillo, C.A., Mendez, S., Shevach, E.M. & Sacks, D.L. CD4 + CD25 +<br />
regulatory T cells control Leishmania major persistence and immunity. <strong>Nature</strong> 420,<br />
502–507 (2002).<br />
21. Stoll, S., Delon, J., Brotz, T.M. & Germain, R.N. Dynamic imaging <strong>of</strong> T cell-dendritic<br />
cell interactions in lymph nodes. Science 296, 1873–1876 (2002).<br />
22. Mempel, T.R., Henrickson, S.E. & Von Andrian, U.H. T-cell priming by dendritic cells in<br />
lymph nodes occurs in three distinct phases. <strong>Nature</strong> 427, 154–159 (2004).<br />
23. Miller, M.J., Wei, S.H., Parker, I. & Cah<strong>al</strong>an, M.D. Two-photon imaging <strong>of</strong> lymphocyte<br />
motility and antigen response in intact lymph node. Science 296, 1869–1873 (2002).<br />
24. Miller, M.J., Safrina, O., Parker, I. & Cah<strong>al</strong>an, M.D. Imaging the single cell dynamics <strong>of</strong><br />
CD4 + T cell activation by dendritic cells in lymph nodes. J. Exp. Med. 200, 847–856<br />
(2004).<br />
25. Bousso, P. & Robey, E. Dynamics <strong>of</strong> CD8 + T cell priming by dendritic cells in intact<br />
lymph nodes. Nat. Immunol. 4, 579–585 (2003).<br />
26. Itano, A.A. <strong>et</strong> <strong>al</strong>. Distinct dendritic cell populations sequenti<strong>al</strong>ly present antigen to<br />
CD4 T cells and stimulate different aspects <strong>of</strong> cell-mediated immunity. Immunity 19,<br />
47–57 (2003).<br />
27. Itano, A.A. & Jenkins, M.K. Antigen presentation to naive CD4 T cells in the lymph<br />
node. Nat. Immunol. 4, 733–739 (2003).<br />
28. Schmidt, D., Verdaguer, J., Averill, N. & Santamaria, P. A mechanism for the major<br />
histocompatibility complex-linked resistance to autoimmunity. J. Exp. Med. 186,<br />
1059–1075 (1997).<br />
29. St<strong>et</strong>son, D.B. <strong>et</strong> <strong>al</strong>. Constitutive cytokine mRNAs mark natur<strong>al</strong> killer (NK) and NK<br />
T cells poised for rapid effector function. J. Exp. Med. 198, 1069–1076 (2003).<br />
30. Hara, M. <strong>et</strong> <strong>al</strong>. Transgenic mice with green fluorescent protein-labeled pancreatic<br />
b-cells. Am. J. Physiol. Endocrinol. M<strong>et</strong>ab. 284, E177–E183 (2003).<br />
31. Iezzi, G., Scot<strong>et</strong>, E., Scheidegger, D. & Lanzavecchia, A. The interplay b<strong>et</strong>ween the<br />
duration <strong>of</strong> TCR and cytokine sign<strong>al</strong>ing d<strong>et</strong>ermines T cell polarization. Eur. J. Immunol.<br />
29, 4092–4101 (1999).<br />
32. G<strong>et</strong>t, A.V., S<strong>al</strong>lusto, F., Lanzavecchia, A. & Geginat, J. T cell fitness d<strong>et</strong>ermined by<br />
sign<strong>al</strong> strength. Nat. Immunol. 4, 355–360 (2003).<br />
33. Huppa, J.B., Gleimer, M., Sumen, C. & Davis, M.M. Continuous T cell receptor<br />
sign<strong>al</strong>ing required for synapse maintenance and full effector potenti<strong>al</strong>. Nat. Immunol.<br />
4, 749–755 (2003).<br />
34. Gunzer, M. <strong>et</strong> <strong>al</strong>. Antigen presentation in extracellular matrix: interactions <strong>of</strong> T cells<br />
with dendritic cells are dynamic, short lived, and sequenti<strong>al</strong>. Immunity 13, 323–332<br />
(2000).<br />
35. Gunzer, M. <strong>et</strong> <strong>al</strong>. A spectrum <strong>of</strong> biophysic<strong>al</strong> interaction modes b<strong>et</strong>ween T cells and<br />
different antigen-presenting cells during priming in 3-D collagen and in vivo. Blood<br />
104, 2801–2809 (2004).<br />
36. Hsieh, C.S. <strong>et</strong> <strong>al</strong>. Recognition <strong>of</strong> the peripher<strong>al</strong> self by natur<strong>al</strong>ly arising CD25 + CD4 +<br />
T cell receptors. Immunity 21, 267–277 (2004).<br />
37. Steinman, R.M., Hawiger, D. & Nussenzweig, M.C. Tolerogenic dendritic cells. Annu.<br />
Rev. Immunol. 21, 685–711 (2003).<br />
38. Scheinecker, C., McHugh, R., Shevach, E.M. & Germain, R.N. Constitutive presentation<br />
<strong>of</strong> a natur<strong>al</strong> tissue autoantigen exclusively by dendritic cells in the draining lymph<br />
node. J. Exp. Med. 196, 1079–1090 (2002).<br />
39. Serra, P. <strong>et</strong> <strong>al</strong>. CD40 ligation releases immature dendritic cells from the control <strong>of</strong><br />
regulatory CD4 + CD25 + Tcells.Immunity 19, 877–889 (2003).<br />
40. Sanderson, M.J. & Parker, I. Video-rate confoc<strong>al</strong> microscopy. M<strong>et</strong>hods Enzymol. 360,<br />
447–481 (2003).<br />
92 VOLUME 7 NUMBER 1 JANUARY <strong>2006</strong> NATURE IMMUNOLOGY