Tang et al. Nature Immunology. 2006 - Departments of Pathology ...
Tang et al. Nature Immunology. 2006 - Departments of Pathology ...
Tang et al. Nature Immunology. 2006 - Departments of Pathology ...

Create successful ePaper yourself
Turn your PDF publications into a flip-book with our unique Google optimized e-Paper software.
ARTICLES<br />
© <strong>2006</strong> <strong>Nature</strong> Publishing Group http://www.nature.com/natureimmunology<br />
Ing LN<br />
Pan LN<br />
a<br />
c<br />
T H<br />
Aside from the absence <strong>of</strong> endogenous T reg cells, it was possible that<br />
the absence <strong>of</strong> B7 binding by NOD.Cd28 / T cells may have <strong>al</strong>lowed<br />
more accessibility <strong>of</strong> the adoptively transferred T cells to B7-bearing<br />
antigen-presenting cells (APCs) than in the NOD mice. This might<br />
have led to the increased sign<strong>al</strong>ing and subsequent cellular arrest. To<br />
address that possibility, we an<strong>al</strong>yzed the movement dynamics <strong>of</strong><br />
BDC2.5 CD4 + CD25 – T H cells in the NOD mice deficient in both<br />
B7-1 (CD80) and B7-2 (CD86). These mice have a T reg cell deficiency<br />
similar to that in NOD.Cd28 / mice but do not have the confounding<br />
issue <strong>of</strong> higher B7 availability. The BDC2.5 CD4 + CD25 – T H cells<br />
swarmed and arrested as noted in the NOD.Cd28 / mice (Fig. 2d,<br />
Table 1 and Supplementary Video 4 online).<br />
To further quantify the various patterns <strong>of</strong> movement, we measured<br />
the velocities <strong>of</strong> the cells in the inguin<strong>al</strong> and pancreatic lymph nodes <strong>of</strong><br />
NOD and NOD.Cd28 / recipients. We injected cells into NOD and<br />
NOD.Cd28 / mice and monitored movement at various time points<br />
after transfer. We tracked the movements <strong>of</strong> free-moving cells in<br />
inguin<strong>al</strong> lymph nodes, swarming cells in pancreatic lymph nodes <strong>of</strong><br />
NOD recipients and static, clustering cells in pancreatic lymph nodes<br />
<strong>of</strong> NOD.Cd28 / recipients for 10–30 min and c<strong>al</strong>culated their<br />
average velocities (Fig. 3a). Cells in the inguin<strong>al</strong> lymph nodes had<br />
the highest velocities, averaging 8 mm/min, which remained constant<br />
at the 18- and 24-hour time points. In the pancreatic lymph nodes, we<br />
found no CD4 + CD25 – T H cell swarming before the 18-hour time<br />
point. The swarming cells had slightly lower velocities, averaging<br />
6 mm/min, which did not change much in the 18- to 30-hour time<br />
frame. The cells in static clusters in NOD.Cd28 / hosts had the<br />
lowest velocities. At 12 h after transfer, the average velocity for<br />
clustering cells was 3.5 mm/min, which was reduced further to<br />
1 mm/min, and r<strong>et</strong>urned to 3 mm/min by 24 h after transfer.<br />
As the antigen-specific arrest in the NOD.Cd28 / host was greatest<br />
at 18 h after cell transfer, we expanded the an<strong>al</strong>ysis at that time point to<br />
compare the movement patterns in various s<strong>et</strong>tings. In both NOD and<br />
NOD.Cd28 / recipients, cells in the inguin<strong>al</strong> lymph nodes had the<br />
highest average velocities (Fig. 3b) and displacement in a 10-minute<br />
period (Fig. 3c). Free-moving cells in pancreatic lymph nodes <strong>of</strong> both<br />
NOD mice (Fig. 3b,c) and NOD.Cd28 / mice (data not shown) had<br />
velocities and displacement similar to those in inguin<strong>al</strong> lymph nodes.<br />
Although the movement <strong>of</strong> the swarming cells was confined, their<br />
velocity was similar to that <strong>of</strong> the free-moving cells in pancreatic lymph<br />
nodes, consistent with their highly dynamic movement pattern. However,<br />
the 10-minute displacement v<strong>al</strong>ues <strong>of</strong> the swarming cells were<br />
significantly lower than those <strong>of</strong> the free-moving cells (P o 0.001) and<br />
b<br />
d<br />
T reg<br />
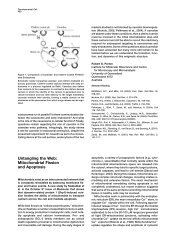
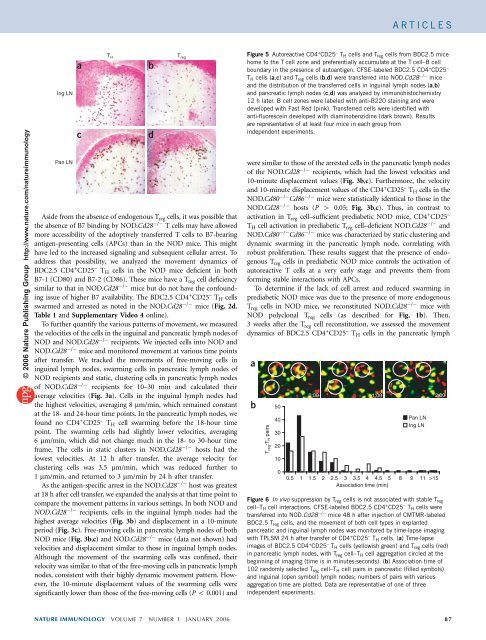
Figure 5 Autoreactive CD4 + CD25 – T H cells and T reg cells from BDC2.5 mice<br />
home to the T cell zone and preferenti<strong>al</strong>ly accumulate at the T cell–B cell<br />
boundary in the presence <strong>of</strong> autoantigen. CFSE-labeled BDC2.5 CD4 + CD25 –<br />
T H cells (a,c) andT reg cells (b,d) were transferred into NOD.Cd28 / mice<br />
and the distribution <strong>of</strong> the transferred cells in inguin<strong>al</strong> lymph nodes (a,b)<br />
and pancreatic lymph nodes (c,d) was an<strong>al</strong>yzed by immunohistochemistry<br />
12 h later. B cell zones were labeled with anti-B220 staining and were<br />
developed with Fast Red (pink). Transferred cells were identified with<br />
anti-fluorescein developed with diaminobenzidine (dark brown). Results<br />
are representative <strong>of</strong> at least four mice in each group from<br />
independent experiments.<br />
were similar to those <strong>of</strong> the arrested cells in the pancreatic lymph nodes<br />
<strong>of</strong> the NOD.Cd28 / recipients, which had the lowest velocities and<br />
10-minute displacement v<strong>al</strong>ues (Fig. 3b,c). Furthermore, the velocity<br />
and 10-minute displacement v<strong>al</strong>ues <strong>of</strong> the CD4 + CD25 – T H cells in the<br />
NOD.Cd80 / Cd86 / mice were statistic<strong>al</strong>ly identic<strong>al</strong> to those in the<br />
NOD.Cd28 / hosts (P 4 0.05; Fig. 3b,c). Thus, in contrast to<br />
activation in T reg cell–sufficient prediab<strong>et</strong>ic NOD mice, CD4 + CD25 –<br />
T H cell activation in prediab<strong>et</strong>ic T reg cell–deficient NOD.Cd28 / and<br />
NOD.Cd80 / Cd86 / mice was characterized by static clustering and<br />
dynamic swarming in the pancreatic lymph node, correlating with<br />
robust proliferation. These results suggest that the presence <strong>of</strong> endogenous<br />
T reg cells in prediab<strong>et</strong>ic NOD mice controls the activation <strong>of</strong><br />
autoreactive T cells at a very early stage and prevents them from<br />
forming stable interactions with APCs.<br />
To d<strong>et</strong>ermine if the lack <strong>of</strong> cell arrest and reduced swarming in<br />
prediab<strong>et</strong>ic NOD mice was due to the presence <strong>of</strong> more endogenous<br />
T reg cells in NOD mice, we reconstituted NOD.Cd28 / mice with<br />
NOD polyclon<strong>al</strong> T reg cells (as described for Fig. 1b). Then,<br />
3weeksaftertheT reg cell reconstitution, we assessed the movement<br />
dynamics <strong>of</strong> BDC2.5 CD4 + CD25 – T H cells in the pancreatic lymph<br />
a<br />
b<br />
T reg :T H pairs<br />
50<br />
40<br />
30<br />
20<br />
10<br />
0<br />
0:00 1:00 2:00<br />
Pan LN<br />
Ing LN<br />
0.5 1 1.5 2 2.5 3 3.5 4 4.5 5 8 9 11 >15<br />
Association time (min)<br />
Figure 6 In vivo suppression by T reg cells is not associated with stable T reg<br />
cell–T H cell interactions. CFSE-labeled BDC2.5 CD4 + CD25 – T H cells were<br />
transferred into NOD.Cd28 / mice 48 h after injection <strong>of</strong> CMTMR-labeled<br />
BDC2.5 T reg cells, and the movement <strong>of</strong> both cell types in explanted<br />
pancreatic and inguin<strong>al</strong> lymph nodes was monitored by time-lapse imaging<br />
with TPLSM 24 h after transfer <strong>of</strong> CD4 + CD25 – T H cells. (a) Time-lapse<br />
images <strong>of</strong> BDC2.5 CD4 + CD25 – T H cells (yellowish green) and T reg cells (red)<br />
in pancreatic lymph nodes, with T reg cell–T H cell aggregation circled at the<br />
beginning <strong>of</strong> imaging (time is in minutes:seconds). (b) Association time <strong>of</strong><br />
102 randomly selected T reg cell–T H cell pairs in pancreatic (filled symbols)<br />
and inguin<strong>al</strong> (open symbol) lymph nodes; numbers <strong>of</strong> pairs with various<br />
aggregation time are plotted. Data are representative <strong>of</strong> one <strong>of</strong> three<br />
independent experiments.<br />
NATURE IMMUNOLOGY VOLUME 7 NUMBER 1 JANUARY <strong>2006</strong> 87