PDF | 2 MB - Australian Building Codes Board
PDF | 2 MB - Australian Building Codes Board
PDF | 2 MB - Australian Building Codes Board

Create successful ePaper yourself
Turn your PDF publications into a flip-book with our unique Google optimized e-Paper software.
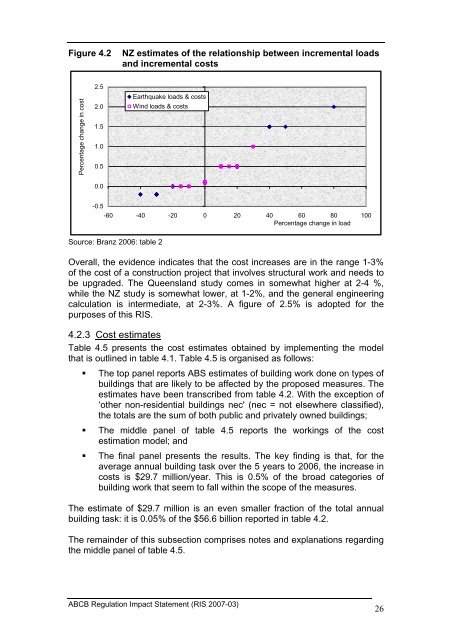
Figure 4.2<br />
NZ estimates of the relationship between incremental loads<br />
and incremental costs<br />
Percentage change in cost<br />
2.5<br />
2.0<br />
1.5<br />
1.0<br />
0.5<br />
Earthquake loads & costs<br />
Wind loads & costs<br />
0.0<br />
-0.5<br />
-60 -40 -20 0 20 40 60 80 100<br />
Percentage change in load<br />
Source: Branz 2006: table 2<br />
Overall, the evidence indicates that the cost increases are in the range 1-3%<br />
of the cost of a construction project that involves structural work and needs to<br />
be upgraded. The Queensland study comes in somewhat higher at 2-4 %,<br />
while the NZ study is somewhat lower, at 1-2%, and the general engineering<br />
calculation is intermediate, at 2-3%. A figure of 2.5% is adopted for the<br />
purposes of this RIS.<br />
4.2.3 Cost estimates<br />
Table 4.5 presents the cost estimates obtained by implementing the model<br />
that is outlined in table 4.1. Table 4.5 is organised as follows:<br />
• The top panel reports ABS estimates of building work done on types of<br />
buildings that are likely to be affected by the proposed measures. The<br />
estimates have been transcribed from table 4.2. With the exception of<br />
‘other non-residential buildings nec' (nec = not elsewhere classified),<br />
the totals are the sum of both public and privately owned buildings;<br />
• The middle panel of table 4.5 reports the workings of the cost<br />
estimation model; and<br />
• The final panel presents the results. The key finding is that, for the<br />
average annual building task over the 5 years to 2006, the increase in<br />
costs is $29.7 million/year. This is 0.5% of the broad categories of<br />
building work that seem to fall within the scope of the measures.<br />
The estimate of $29.7 million is an even smaller fraction of the total annual<br />
building task: it is 0.05% of the $56.6 billion reported in table 4.2.<br />
The remainder of this subsection comprises notes and explanations regarding<br />
the middle panel of table 4.5.<br />
ABCB Regulation Impact Statement (RIS 2007-03)<br />
26