Create successful ePaper yourself
Turn your PDF publications into a flip-book with our unique Google optimized e-Paper software.
DEFINITIONS FOR COMPARATIVE COMPANY ANALYSIS TABLES<br />
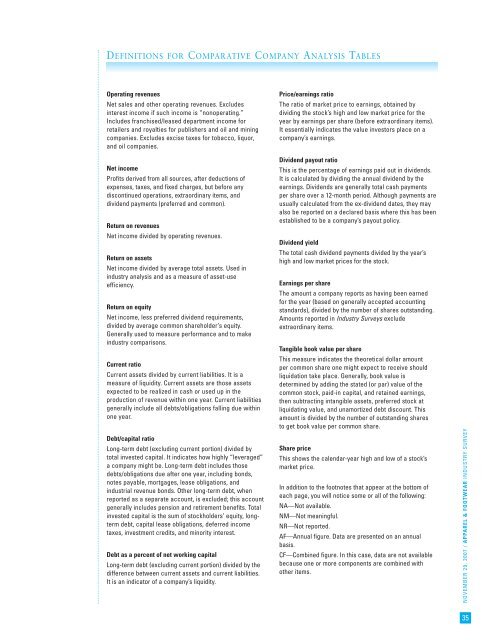
Operating revenues<br />
Net sales and other operating revenues. Excludes<br />
interest income if such income is “nonoperating.”<br />
Includes franchised/leased department income for<br />
retailers and royalties for publishers and oil and mining<br />
companies. Excludes excise taxes for tobacco, liquor,<br />
and oil companies.<br />
Net income<br />
Profits derived from all sources, after deductions of<br />
expenses, taxes, and fixed charges, but before any<br />
discontinued operations, extraordinary items, and<br />
dividend payments (preferred and common).<br />
Return on revenues<br />
Net income divided by operating revenues.<br />
Return on assets<br />
Net income divided by average total assets. Used in<br />
industry analysis and as a measure of asset-use<br />
efficiency.<br />
Return on equity<br />
Net income, less preferred dividend requirements,<br />
divided by average common shareholder‘s equity.<br />
Generally used to measure performance and to make<br />
industry comparisons.<br />
Current ratio<br />
Current assets divided by current liabilities. It is a<br />
measure of liquidity. Current assets are those assets<br />
expected to be realized in cash or used up in the<br />
production of revenue within one year. Current liabilities<br />
generally include all debts/obligations falling due within<br />
one year.<br />
Debt/capital ratio<br />
Long-term debt (excluding current portion) divided by<br />
total invested capital. It indicates how highly “leveraged”<br />
a company might be. Long-term debt includes those<br />
debts/obligations due after one year, including bonds,<br />
notes payable, mortgages, lease obligations, and<br />
industrial revenue bonds. Other long-term debt, when<br />
reported as a separate account, is excluded; this account<br />
generally includes pension and retirement benefits. Total<br />
invested capital is the sum of stockholders’ equity, longterm<br />
debt, capital lease obligations, deferred income<br />
taxes, investment credits, and minority interest.<br />
Debt as a percent of net working capital<br />
Long-term debt (excluding current portion) divided by the<br />
difference between current assets and current liabilities.<br />
It is an indicator of a company’s liquidity.<br />
Price/earnings ratio<br />
The ratio of market price to earnings, obtained by<br />
dividing the stock’s high and low market price for the<br />
year by earnings per share (before extraordinary items).<br />
It essentially indicates the value investors place on a<br />
company’s earnings.<br />
Dividend payout ratio<br />
This is the percentage of earnings paid out in dividends.<br />
It is calculated by dividing the annual dividend by the<br />
earnings. Dividends are generally total cash payments<br />
per share over a 12-month period. Although payments are<br />
usually calculated from the ex-dividend dates, they may<br />
also be reported on a declared basis where this has been<br />
established to be a company’s payout policy.<br />
Dividend yield<br />
The total cash dividend payments divided by the year’s<br />
high and low market prices for the stock.<br />
Earnings per share<br />
The amount a company reports as having been earned<br />
for the year (based on generally accepted accounting<br />
standards), divided by the number of shares outstanding.<br />
Amounts reported in <strong>Industry</strong> <strong>Surveys</strong> exclude<br />
extraordinary items.<br />
Tangible book value per share<br />
This measure indicates the theoretical dollar amount<br />
per common share one might expect to receive should<br />
liquidation take place. Generally, book value is<br />
determined by adding the stated (or par) value of the<br />
common stock, paid-in capital, and retained earnings,<br />
then subtracting intangible assets, preferred stock at<br />
liquidating value, and unamortized debt discount. This<br />
amount is divided by the number of outstanding shares<br />
to get book value per common share.<br />
Share price<br />
This shows the calendar-year high and low of a stock’s<br />
market price.<br />
In addition to the footnotes that appear at the bottom of<br />
each page, you will notice some or all of the following:<br />
NA—Not available.<br />
NM—Not meaningful.<br />
NR—Not reported.<br />
AF—Annual figure. Data are presented on an annual<br />
basis.<br />
CF—Combined figure. In this case, data are not available<br />
because one or more components are combined with<br />
other items.<br />
NOVEMBER 29, 2007 / APPAREL & FOOTWEAR INDUSTRY SURVEY<br />
35


