Financial Statement - Food Empire Holdings Limited
Financial Statement - Food Empire Holdings Limited
Financial Statement - Food Empire Holdings Limited

You also want an ePaper? Increase the reach of your titles
YUMPU automatically turns print PDFs into web optimized ePapers that Google loves.
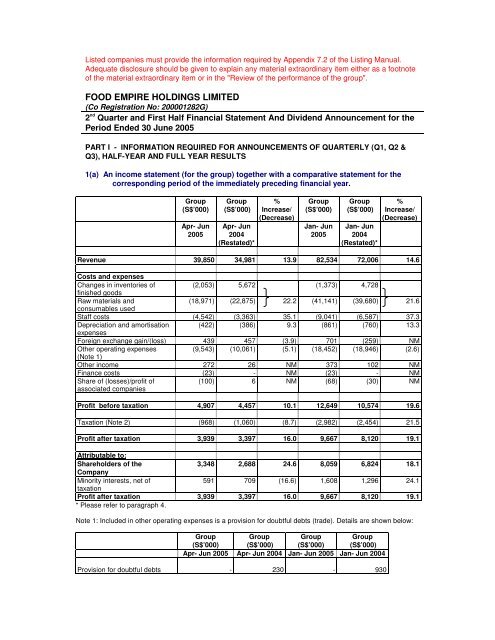
Listed companies must provide the information required by Appendix 7.2 of the Listing Manual.<br />
Adequate disclosure should be given to explain any material extraordinary item either as a footnote<br />
of the material extraordinary item or in the "Review of the performance of the group".<br />
FOOD EMPIRE HOLDINGS LIMITED<br />
(Co Registration No: 200001282G)<br />
2 nd Quarter and First Half <strong>Financial</strong> <strong>Statement</strong> And Dividend Announcement for the<br />
Period Ended 30 June 2005<br />
PART I - INFORMATION REQUIRED FOR ANNOUNCEMENTS OF QUARTERLY (Q1, Q2 &<br />
Q3), HALF-YEAR AND FULL YEAR RESULTS<br />
1(a) An income statement (for the group) together with a comparative statement for the<br />
corresponding period of the immediately preceding financial year.<br />
Group<br />
(S$’000)<br />
Apr- Jun<br />
2005<br />
Group<br />
(S$’000)<br />
Apr- Jun<br />
2004<br />
(Restated)*<br />
%<br />
Increase/<br />
(Decrease)<br />
Group<br />
(S$’000)<br />
Jan- Jun<br />
2005<br />
Group<br />
(S$’000)<br />
Jan- Jun<br />
2004<br />
(Restated)*<br />
%<br />
Increase/<br />
(Decrease)<br />
Revenue 39,850 34,981 13.9 82,534 72,006 14.6<br />
Costs and expenses<br />
Changes in inventories of (2,053) 5,672 (1,373) 4,728<br />
finished goods<br />
Raw materials and<br />
(18,971) (22,875) 22.2 (41,141) (39,680) 21.6<br />
consumables used<br />
Staff costs (4,542) (3,363) 35.1 (9,041) (6,587) 37.3<br />
Depreciation and amortisation (422) (386) 9.3 (861) (760) 13.3<br />
expenses<br />
Foreign exchange gain/(loss) 439 457 (3.9) 701 (259) NM<br />
Other operating expenses (9,543) (10,061) (5.1) (18,452) (18,946) (2.6)<br />
(Note 1)<br />
Other income 272 26 NM 373 102 NM<br />
Finance costs (23) - NM (23) - NM<br />
Share of (losses)/profit of<br />
associated companies<br />
(100) 6 NM (68) (30) NM<br />
Profit before taxation 4,907 4,457 10.1 12,649 10,574 19.6<br />
Taxation (Note 2) (968) (1,060) (8.7) (2,982) (2,454) 21.5<br />
Profit after taxation 3,939 3,397 16.0 9,667 8,120 19.1<br />
Attributable to:<br />
Shareholders of the<br />
3,348 2,688 24.6 8,059 6,824 18.1<br />
Company<br />
Minority interests, net of<br />
591 709 (16.6) 1,608 1,296 24.1<br />
taxation<br />
Profit after taxation 3,939 3,397 16.0 9,667 8,120 19.1<br />
* Please refer to paragraph 4.<br />
Note 1: Included in other operating expenses is a provision for doubtful debts (trade). Details are shown below:<br />
Group<br />
(S$’000)<br />
Group<br />
(S$’000)<br />
Group<br />
(S$’000)<br />
Group<br />
(S$’000)<br />
Apr- Jun 2005 Apr- Jun 2004 Jan- Jun 2005 Jan- Jun 2004<br />
Provision for doubtful debts - 230 - 930
Note 2: Included in taxation for half year ended 30 June 2005 is an underprovision of S$338,000 (2004:S$nil) for<br />
the prior year.<br />
NM: Not meaningful.<br />
1(b)(i) A balance sheet (for the issuer and group), together with a comparative<br />
statement as at the end of the immediately preceding financial year.<br />
Group Group Company Company<br />
30/06/2005<br />
(S$'000)<br />
31/12/2004<br />
(Restated)<br />
(S$'000)<br />
30/06/2005<br />
(S$'000)<br />
31/12/2004<br />
(Restated)<br />
(S$'000)<br />
Assets Less Liabilities<br />
Non-Current Assets<br />
Fixed assets 14,450 13,369 - -<br />
Investments in subsidiary companies - - 12,519 12,519<br />
Investments in associated companies 1,427 1,272 979 979<br />
Deferred tax assets 948 1,385 - -<br />
Intangible assets 7,738 - - -<br />
24,563 16,026 13,498 13,498<br />
Current Assets<br />
Cash and bank balances 13,194 15,680 634 83<br />
Trade receivables 30,094 27,967 - -<br />
Prepayments,other deposits and other<br />
4,392 4,996 711 1,147<br />
receivables<br />
Amounts due from subsidiary companies<br />
(non-trade)<br />
- - 21,655 16,168<br />
Amounts due from associated companies (trade) 64 138 - -<br />
Amounts due from associated companies<br />
(non-trade)<br />
464 890 - 439<br />
Inventories 34,680 31,906 - -<br />
82,888 81,577 23,000 17,837<br />
Current Liabilities<br />
Trade payables and accruals (13,970) (19,555) (406) -<br />
Other payables (821) (414) (9) (314)<br />
Amount due to a related party (trade) - (1) - -<br />
Provision for taxation (4,380) (3,877) (9) (9)<br />
(19,171) (23,847) (424) (323)<br />
Net Current Assets 63,717 57,730 22,576 17,514<br />
Non-Current Liability<br />
Deferred tax liabilities (262) (249) - -<br />
(262) (249) - -<br />
Net Assets 88,018 73,507 36,074 31,012<br />
Equity<br />
Share capital 18,877 17,457 18,877 17,457<br />
Reserves 65,153 51,636 17,197 13,555<br />
84,030 69,093 36,074 31,012<br />
Minority interests 3,988 4,414 - -<br />
88,018 73,507 36,074 31,012
1(b)(ii)<br />
Aggregate amount of group’s borrowings and debt securities.<br />
Amount repayable in one year or less, or on demand<br />
As at 30/06/2005 As at 31/12/2004<br />
Secured Unsecured Secured Unsecured<br />
<br />
0 0 0 0<br />
Amount repayable after one year<br />
As at 30/06/2005 As at 31/12/2004<br />
Secured Unsecured Secured Unsecured<br />
<br />
0 0 0 0<br />
Details of any collateral<br />
NIL<br />
1(c) A cash flow statement (for the group), together with a comparative statement for<br />
the corresponding period of the immediately preceding financial year.<br />
Cash flows from operating activities:<br />
3 mths<br />
ended<br />
3 mths<br />
ended<br />
6 mths<br />
ended<br />
6 mths<br />
ended<br />
30 June<br />
2005<br />
30 June<br />
2004<br />
30 June<br />
2005<br />
30 June<br />
2004<br />
(Restated)<br />
(Restated)<br />
(S$'000) (S$'000) (S$'000) (S$'000)<br />
Profit from ordinary activities before taxation and minority<br />
4,907 4,457 12,649 10,574<br />
interests<br />
Adjustments for:<br />
Amortisation of goodwill - 5 - 10<br />
Depreciation of fixed assets 422 381 861 750<br />
Exchange realignment 1,082 801 1,355 360<br />
Loss/ (gain) on disposal of fixed assets 25 - 16 (9)<br />
Interest expense 23 - 23 -<br />
Interest income (25) (5) (45) (6)<br />
Share of losses/(gains) of associated companies 99 (6) 67 30<br />
Share-based payment expenses 145 57 276 63<br />
Operating income before reinvestment in working capital 6,678 5,690 15,202 11,772<br />
Increase in receivables (2,123) (3,677) (1,008) (3,640)<br />
Increase in inventories (1,914) (6,513) (2,774) (4,884)<br />
Increase/(decrease) in payables 21 5,148 (5,454) 3,896<br />
Cash generated from / (used in) from operations 2,662 648 5,966 7,144<br />
Income taxes paid (1,289) (790) (2,062) (1,457)<br />
Net cash generated from / (used in) from operating activities 1,373 (142) 3,904 5,687<br />
Cash flows from investing activities:<br />
Interest received 25 5 45 6<br />
Purchase of fixed assets (896) (258) (1,679) (419)<br />
Proceeds from sale of fixed assets 3 - 3 9
3 mths<br />
ended<br />
3 mths<br />
ended<br />
6 mths<br />
ended<br />
6 mths<br />
ended<br />
30 June<br />
2005<br />
30 June<br />
2004<br />
30 June<br />
2005<br />
30 June<br />
2004<br />
(Restated)<br />
(Restated)<br />
(S$'000) (S$'000) (S$'000) (S$'000)<br />
Loan to an associated company - (141) - (267)<br />
Investment in an associated company (162) (257) (162) (257)<br />
Net cash used in investing activities (1,030) (651) (1,793) (928)<br />
Cash flows from financing activities<br />
Dividends paid to minority shareholders of subsidiary companies (105) (944) (859) (1,351)<br />
Dividends paid to shareholders of the Company (4,225) (3,467) (4,225) (3,467)<br />
Interest expense (23) - (23) -<br />
Proceeds from issuance of shares 345 448 510 806<br />
Net cash used in financing activities (4,008) (3,963) (4,597) (4,012)<br />
Net (decrease)/ increase in cash and cash equivalents (3,665) (4,756) (2,486) 747<br />
Cash and cash equivalents at beginning of the period 16,859 17,328 15,680 11,825<br />
Cash and cash equivalents at end of the period 13,194 12,572 13,194 12,572<br />
1(d)(i)<br />
or (ii)<br />
A statement (for the issuer and group) showing either (i) all changes in equity<br />
changes in equity other than those arising from capitalisation issues and<br />
distributions to shareholders, together with a comparative statement for the<br />
corresponding period of the immediately preceding financial year.<br />
Share<br />
Capital<br />
Share<br />
Premium<br />
Foreign<br />
Currency<br />
Translation<br />
Reserve<br />
Other<br />
Reserve<br />
Revenue<br />
Reserve<br />
Total<br />
Minority<br />
Interests<br />
Total<br />
Equity<br />
(S$'000) (S$'000) (S$'000) (S$'000) (S$'000) (S$'000) (S$'000) (S$'000)<br />
The Group<br />
Balance as at<br />
01/01/2004<br />
- As previously 17,200 6,086 (202) - 33,918 57,002 3,277 60,279<br />
reported<br />
- Changes in<br />
- - - 14 (14) - - -<br />
accounting policies<br />
FRS 102<br />
- As restated 17,200 6,086 (202) 14 33,904 57,002 3,277 60,279<br />
Net profit for the<br />
- - - - 4,136 4,136 587 4,723<br />
period<br />
Dividends paid to a - - - - - - (407) (407)<br />
minority shareholder<br />
of a subsidiary<br />
company<br />
Movements during - - (485) 6 - (479) (29) (508)<br />
the period<br />
Issuance of ordinary 105 253 - - - 358 - 358<br />
shares<br />
Balance as at 17,305 6,339 (687) 20 38,040 61,017 3,428 64,445<br />
31/03/2004<br />
Net profit for the<br />
- - - - 2,688 2,688 709 3,397<br />
period<br />
Dividends paid to a<br />
minority shareholder<br />
of a subsidiary<br />
company<br />
- - - - - - (944) (944)
Dividends paid to<br />
shareholders of the<br />
Company<br />
Movements during<br />
the period<br />
Issuance of ordinary<br />
shares<br />
Balance as at<br />
30/06/2004<br />
Share<br />
Capital<br />
Share<br />
Premium<br />
Foreign<br />
Currency<br />
Translation<br />
Reserve<br />
Other<br />
Reserve<br />
Revenue<br />
Reserve<br />
Total<br />
Minority<br />
Interests<br />
Total<br />
Equity<br />
(S$'000) (S$'000) (S$'000) (S$'000) (S$'000) (S$'000) (S$'000) (S$'000)<br />
- - - - (3,467) (3,467) - (3,467)<br />
- - 794 58 - 852 52 904<br />
132 316 - - - 448 - 448<br />
17,437 6,655 107 78 37,261 61,538 3,245 64,783<br />
Balance as at<br />
01/01/2005<br />
- As previously 17,457 6,703 (529) - 45,698 69,329 4,414 73,743<br />
reported<br />
- Changes in<br />
- - (1,016) 346 434 (236) - (236)<br />
accounting policies<br />
FRS 21 & 102<br />
- As restated 17,457 6,703 (1,545) 346 46,132 69,093 4,414 73,507<br />
Net profit for the<br />
- - - - 4,711 4,711 1,017 5,728<br />
period<br />
Dividends paid to a<br />
- - - - - - (754) (754)<br />
minority shareholder<br />
of a subsidiary<br />
company<br />
Movements during<br />
- - 293 131 - 424 17 441<br />
the period<br />
Issuance of ordinary 49 116 - - - 165 - 165<br />
shares<br />
Balance as at 17,506 6,819 (1,252) 477 50,843 74,393 4,694 79,087<br />
31/03/2005<br />
Net profit for the<br />
- - - - 3,348 3,348 591 3,939<br />
period<br />
Dividends paid to a<br />
- - - - - - (105) (105)<br />
minority shareholder<br />
of a subsidiary<br />
company<br />
Dividends paid to<br />
- - - - (4,225) (4,225) - (4,225)<br />
shareholders of the<br />
Company<br />
Movements during<br />
- - 1,387 145 - 1,532 - 1,532<br />
the period<br />
Acquisition of<br />
- - - - - - (1,192) (1,192)<br />
shares from minority<br />
shareholder of a<br />
subsidiary company<br />
Issuance of ordinary 1,371 7,611 - - - 8,982 - 8,982<br />
shares<br />
Balance as at<br />
30/06/2005<br />
18,877 14,430 135 622 49,966 84,030 3,988 88,018
Share<br />
Capital<br />
Share<br />
Premium<br />
Foreign<br />
Currency<br />
Translation<br />
Reserve<br />
Other<br />
Reserve<br />
Revenue<br />
Reserve<br />
Total<br />
(S$'000) (S$'000) (S$'000) (S$'000) (S$'000) (S$'000)<br />
The Company<br />
Balance as at<br />
01/01/2004<br />
- As previously 17,200 6,086 - - 8,433 31,719<br />
reported<br />
- Changes in<br />
- - - 14 (14) -<br />
accounting policies<br />
FRS 102<br />
- As restated 17,200 6,086 - 14 8,419 31,719<br />
Net (loss) for the<br />
- - - - (21) (21)<br />
period<br />
Movements during - - - 6 - 6<br />
the period<br />
Issuance of<br />
105 253 - - - 358<br />
ordinary shares<br />
Balance as at 17,305 6,339 - 20 8,398 32,062<br />
31/03/2004<br />
Net (loss) for the<br />
- - - - (47) (47)<br />
period<br />
Movements during - - - 58 - 58<br />
the period<br />
Issuance of<br />
132 316 - - - 448<br />
ordinary shares<br />
Dividends paid to<br />
- - - - (3,467) (3,467)<br />
shareholders of<br />
the Company<br />
Balance as at<br />
30/06/2004<br />
17,437 6,655 - 78 4,884 29,054<br />
Balance as at<br />
01/01/2005<br />
- As previously 17,457 6,703 - - 6,852 31,012<br />
reported<br />
- Changes in<br />
- - - 346 (346) -<br />
accounting policies<br />
FRS 102<br />
- As restated 17,457 6,703 - 346 6,506 31,012<br />
Net (loss) for the<br />
- - - - (279) (279)<br />
period<br />
Movements during - - - 131 - 131<br />
the period<br />
Issuance of<br />
49 116 - - - 165<br />
ordinary shares<br />
Balance as at 17,506 6,819 - 477 6,227 31,029<br />
31/03/2005<br />
Net profit for the<br />
- - - - 143 143<br />
period<br />
Movements during - - - 145 - 145<br />
the period<br />
Issuance of<br />
1,371 7,611 - - - 8,982<br />
ordinary shares<br />
Dividends paid to<br />
- - - - (4,225) (4,225)<br />
shareholders of<br />
the Company<br />
Balance as at<br />
30/06/2005<br />
18,877 14,430 - 622 2,145 36,074
1(d)(ii) Details of any changes in the company's share capital arising from rights issue,<br />
bonus issue, share buy-backs, exercise of share options or warrants, conversion of<br />
other issues of equity securities, issue of shares for cash or as consideration for<br />
acquisition or for any other purpose since the end of the previous period reported<br />
on. State also the number of shares that may be issued on conversion of all the<br />
outstanding convertibles as at the end of the current financial period reported on<br />
and as at the end of the corresponding period of the immediately preceding<br />
financial year.<br />
The issued and paid-up capital of the Company increased from S$17,505,500 as at 31<br />
March 2005 to S$18,877,250 as at 30 June 2005. The increase was due to 2,035,000 new<br />
ordinary shares of S$0.05 each alloted and issued pursuant to the exercise of options<br />
granted under the <strong>Food</strong> <strong>Empire</strong> Share Option Scheme (the “Option Scheme”). In addition,<br />
25,400,000 new ordinary shares of S$0.05 each alloted and issued pursuant to the Sales &<br />
Purchase agreement entered with Sudeep Nair and Bestgate Investments Ltd and<br />
completed on 30 June 2005.<br />
Balance as at No of options No of options No of options Balance as at Exercise Price Exercise Period<br />
01-Apr-05 granted during lapsed during the exercised during the 30-Jun-05 per share<br />
the period period<br />
period<br />
$<br />
2002 Options 8,450,000 - (105,000) (2,035,000) 6,310,000 0.17 14 March 2004 to 13 March 2012<br />
2002 Options 800,000 - - - 800,000 0.17 14 March 2004 to 13 March 2007<br />
2003 Options 500,000 - - - 500,000 0.27 04 June 2005 to 13 March 2012<br />
2004 Options 400,000 - - - 400,000 0.275 25 May 2006 to 24 May 2009<br />
2004 Options 12,525,000 - (800,000) 11,725,000 0.275 25 May 2006 to 24 May 2014<br />
22,675,000 - (905,000) (2,035,000) 19,735,000<br />
As at 30 June 2005, options to subscribe for a total of 19,735,000 ordinary shares were<br />
outstanding under the Option Scheme . As at 30 June 2004, there were unexercised<br />
options for 25,650,000 of unissued ordinary shares of the Company under the Option<br />
Scheme.<br />
2. Whether the figures have been audited or reviewed and in accordance with which<br />
auditing standard or practice.<br />
The figures are unaudited and were not reviewed by the auditors.<br />
3. Where the figures have been audited or reviewed, the auditors’ report (including any<br />
qualifications or emphasis of a matter).<br />
Not applicable.<br />
4. Whether the same accounting policies and methods of computation as in the issuer’s<br />
most recently audited annual financial statements have been applied.<br />
The Group has applied the same accounting policies and methods of computation in the<br />
financial statements for the current financial period compared with the audited financial<br />
statements as at 31 December 2004 except for the adoption of the following new <strong>Financial</strong><br />
Reporting Standards (“FRS”) that are mandatory for the financial years beginning on or after 1<br />
January 2005:<br />
FRS 21:<br />
FRS 102:<br />
The Effects of Changes in Foreign Exchange Rates<br />
Share-based payment<br />
The impact of the changes in accounting policies is as follows:
1. FRS 21<br />
The adoption of FRS 21 has impact on the following:-<br />
a) Net Profit for the Group for Half Year ended 30 June 2004 was decreased by S$221,000.<br />
b) There was no impact on the revenue reserve of the Group as at 1 January 2004 as the<br />
Management is of the opinion that it is impractical to determine the effects of the change<br />
in accounting policy prior to 1 January 2004. Hence, the change in accounting policy is<br />
applied as at 1 January 2004.<br />
There is no impact at the Company level as the changes affected a subsidiary of the Group.<br />
2. FRS 102<br />
By adopting FRS 102, the Group and Company adjusted downwards the opening revenue<br />
reserve as at 1 January 2004 by S$14,000.<br />
Net Profit for the Group and the Company for Half Year ended 30 June 2004 was reduced by<br />
S$64,000.<br />
3. Effects of FRS 21 and FRS102 on Earnings Per Share(EPS)<br />
The effect of FRS 21 and FRS 102 on the Group’s basic and diluted EPS for Second Quarter<br />
ended 30 June 2004 is as follows:<br />
Basic EPS<br />
Diluted EPS<br />
Decrease of 0.14 cents<br />
Decrease of 0.13 cents<br />
The effect of FRS 21 and FRS 102 on the Group’s basic and diluted EPS for First Half ended<br />
30 June 2004 is as follows:<br />
Basic EPS<br />
Diluted EPS<br />
Decrease of 0.08 cents<br />
Decrease of 0.06 cents<br />
Apart from the above, the various revisions in FRS, applicable from 1 January 2005, are<br />
currently being assessed to ensure there are no material impact on the Group’s results.<br />
5. If there are any changes in the accounting policies and methods of computation,<br />
including any required by an accounting standard, what has changed, as well as the<br />
reasons for, and the effect of, the change.<br />
Please refer to paragraph 4.<br />
6. Earnings per ordinary share of the group for the current financial period reported on<br />
and the corresponding period of the immediately preceding financial year, after<br />
deducting any provision for preference dividends.<br />
Group Group Group Group<br />
3 months<br />
ended<br />
30/06/2005<br />
3 months<br />
ended<br />
30/06/2004<br />
(Restated)<br />
6 months<br />
ended<br />
30/06/2005<br />
6 months<br />
ended<br />
30/06/2004<br />
(Restated)<br />
Earnings per share<br />
(i) Based on existing issued share capital<br />
0.95 0.77 2.30 1.97<br />
(cents)<br />
(ii) On a fully diluted basis (cents) 0.95 0.76 2.27 1.95
Weighted average number of shares table<br />
3 mths<br />
ended<br />
3 mths<br />
ended<br />
6 mths<br />
ended<br />
6 mths<br />
ended<br />
30/06/2005 30/06/2004 30/06/2005 30/06/2004<br />
Weighted average number of shares<br />
for calculation of basic EPS 351,358,554 347,649,451 350,799,212 345,973,517<br />
Weighted average number of shares<br />
for calculation of diluted EPS 354,064,391 351,638,891 355,506,046 350,251,330<br />
7. Net asset value (for the issuer and group) per ordinary share based on issued share<br />
capital of the issuer at the end of the:-<br />
(a) current financial period reported on; and<br />
(b) immediately preceding financial year.<br />
Group Group Company Company<br />
30/06/2005 31/12/2004 30/06/2005 31/12/2004<br />
(Restated)<br />
(Restated)<br />
Net asset value per ordinary share (cents) 22.26 19.79 9.55 8.88<br />
8. A review of the performance of the group, to the extent necessary for a reasonable<br />
understanding of the group’s business. It must include a discussion of the<br />
following:-<br />
(a) any significant factors that affected the turnover, costs, and earnings of the<br />
group for the current financial period reported on, including (where applicable)<br />
seasonal or cyclical factors; and<br />
(b) any material factors that affected the cash flow, working capital, assets or<br />
liabilities of the group during the current financial period reported on.<br />
In Q2 2005, the Group continued to deliver double-digit growth in Revenue and Net Profit<br />
Attributable to Shareholders. Improvement was led by business expansion in key markets of Russia<br />
and Eastern Europe & Central Asia. Growth was broad-based for both beverage and non-beverage<br />
products.<br />
Revenue<br />
Geographical Analysis<br />
2Q05 2Q04 Chg 1H05 1H04 Chg<br />
$’000 $’000 $’000 $’000<br />
Russia 24,521 21,129 +16.1% 53,992 43,356 +24.5%<br />
Eastern Europe & Central Asia 13,085 11,112 +17.8% 22,962 23,340 -1.6%<br />
Others 2,244 2,740 -18.1% 5,580 5,310 +5.1%<br />
Total 39,850 34,981 +13.9% 82,534 72,006 +14.6%<br />
Stronger sales in key market segments of Russia and Eastern Europe & Central Asia contributed to the<br />
increase in Group Revenue. Russia remains as the top contributor to Group Revenue at 61.5%,<br />
followed by Eastern Europe & Central Asia at 32.8%. Sales from Other Markets made up the balance.<br />
Revenue from Russia rose 16.1% or S$3.4 million to S$24.5 million, and Eastern Europe & Central<br />
Asia increased by 17.8% to S$13.1 million in Q2 2005. This growth was due to successful distribution<br />
network expansion and ongoing promotion of the Group’s strong product brand name.<br />
Sales from the Ukraine market improved owing to the strong MacCoffee brand name built up over the<br />
years. Revenue from other Commonwealth of Independent States had also grown significantly.<br />
Revenue from Other markets fell S$0.5 million to S$2.2 million in Q2 2005 due to lower sales from the<br />
Middle East and USA markets.
For the first six months of 2005, Group Revenue was lifted 14.6% due to strong demand of the Group’s<br />
flagship products such as MacCoffee 3-in-1 which continued to perform well in Russia and other<br />
markets.<br />
Product Analysis<br />
2Q05 2Q04 Chg 1H05 1H04 Chg<br />
$’000 $’000 $’000 $’000<br />
Beverages 36,046 31,868 +13.1% 76,190 65,738 +15.9%<br />
Non-Beverages 3,804 3,113 +22.2% 6,344 6,268 +1.2%<br />
Total 39,850 34,981 +13.9% 82,534 72,006 +14.6%<br />
The Beverage product segment contributed to 90.5% of the Group Revenue compared to 91.1% in the<br />
corresponding quarter of the previous year. Beverage sales rose 13.1% to S$36.0 million led by higher<br />
sales from coffee-based products. Revenue from Non-beverage products grew 22.2% to S$3.8 million<br />
in Q2 2005 lifted by higher demand for snack food and confectionery food products.<br />
Net Profit<br />
Profit Before Tax improved by 10.1% to S$4.9 million in the second quarter of 2005. The increase in<br />
profit was driven largely by higher sales while the costs of major raw materials had increased.<br />
Raw Materials and Consumables Used increased by 22.2% or S$3.8 million to S$21.0 million in Q2<br />
2005 due to rising prices of coffee powder, sugar and packaging materials which were significantly<br />
higher compared to Q2 2004.<br />
Staff costs increased S$1.2 million or 35.1% to S$4.5 million due mainly to business expansions and<br />
employee share option expensing that started in this financial year.<br />
Other operating expenses fell 5.1% to S$9.5 million despite higher business activities. This is<br />
attributable to lower advertising and promotional expenses in the second quarter of 2005, while<br />
overseas office expenditure increased.<br />
Net Profit attributable to Shareholders grew 24.6% from S$2.7 million in Q2 2004 to S$3.3 million.<br />
For the six-month period ended 30 June 2005, Group Profit attributable to Shareholders rose 18.1% to<br />
S$8.1 million due mainly to the increase in turnover despite the rising raw material costs.<br />
Balance Sheet & Cash Flow<br />
Fixed Assets increased by S$1.1 million to S$14.5 million compared to year end 2004 due mainly to the<br />
roll-out of factory in Vietnam.<br />
On 30 June 2005, the Group completed its acquisition of 13% in Future Enterprises (Russia) Pte Ltd<br />
and FER (HK) <strong>Limited</strong>, which resulted in intangible assets of S$7.7 million.<br />
Cash and bank balances fell S$2.5 million from S$15.7 million as at 31 December 2004 to S$13.2<br />
million as at 30 June 2005 partly due to payment of dividends of S$5.1 million to shareholders. The<br />
Group continued to maintain its debt-free status.<br />
9. Where a forecast, or a prospect statement, has been previously disclosed to<br />
shareholders, any variance between it and the actual results.<br />
Not applicable.
10. A commentary at the date of the announcement of the significant trends and competitive<br />
conditions of the industry in which the group operates and any known factors or events<br />
that may affect the group in the next reporting period and the next 12 months.<br />
The Group will continue to invest in brand building and distribution network expansion to improve its<br />
market share.<br />
For the rest of FY2005, market conditions are expected to remain competitive. Foreign currency<br />
fluctuations as well as rising raw material costs will continue to be significant factors that would affect<br />
the Group’s performance. Despite challenging business conditions ahead, the Group is cautiously<br />
optimistic of its business prospects.<br />
11. Dividend<br />
(a) Current <strong>Financial</strong> Period Reported On<br />
Any dividend declared for the current financial period reported on?<br />
None<br />
(b) Corresponding Period of the Immediately Preceding <strong>Financial</strong> Year<br />
Any dividend declared for the corresponding period of the immediately preceding financial<br />
year? None<br />
(c) Date payable<br />
Not applicable.<br />
(d) Books closure date<br />
Not applicable.<br />
12. If no dividend has been declared/recommended, a statement to that effect.<br />
Not applicable.<br />
PART II - ADDITIONAL INFORMATION REQUIRED FOR FULL YEAR ANNOUNCEMENT<br />
(This part is not applicable to Q1, Q2, Q3 or Half Year Results)<br />
13. Segmented revenue and results for business or geographical segments (of the group) in<br />
the form presented in the issuer’s most recently audited annual financial statements,<br />
with comparative information for the immediately preceding year.<br />
Not applicable<br />
14. In the review of performance, the factors leading to any material changes in<br />
contributions to turnover and earnings by the business or geographical segments.<br />
Not applicable.<br />
15. A breakdown of sales.<br />
Not applicable.
16. A breakdown of the total annual dividend (in dollar value) for the issuer’s latest<br />
full year and its previous full year.<br />
Total Annual Dividend (Refer to Para 16 of Appendix 7.2 for the required details)<br />
Latest Full Year (S$)<br />
FY2004<br />
Previous Full Year (S$)<br />
FY2003<br />
Ordinary - -<br />
Preference - -<br />
Total: - -<br />
BY ORDER OF THE BOARD<br />
Tan San-Ju<br />
Company Secretary<br />
11 August 2005