Financial Statement - Food Empire Holdings Limited
Financial Statement - Food Empire Holdings Limited
Financial Statement - Food Empire Holdings Limited

Create successful ePaper yourself
Turn your PDF publications into a flip-book with our unique Google optimized e-Paper software.
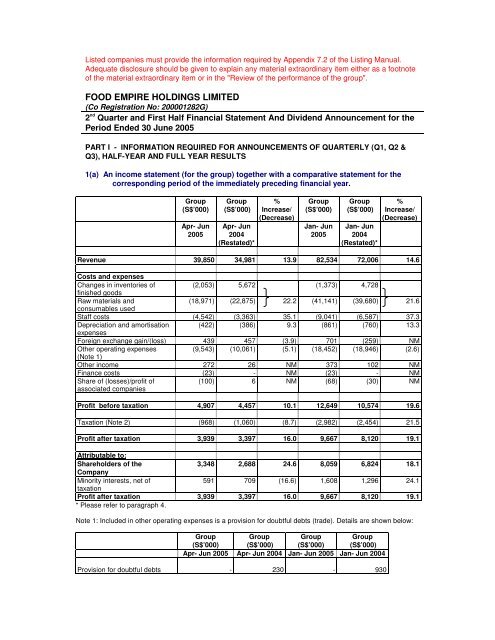
Listed companies must provide the information required by Appendix 7.2 of the Listing Manual.<br />
Adequate disclosure should be given to explain any material extraordinary item either as a footnote<br />
of the material extraordinary item or in the "Review of the performance of the group".<br />
FOOD EMPIRE HOLDINGS LIMITED<br />
(Co Registration No: 200001282G)<br />
2 nd Quarter and First Half <strong>Financial</strong> <strong>Statement</strong> And Dividend Announcement for the<br />
Period Ended 30 June 2005<br />
PART I - INFORMATION REQUIRED FOR ANNOUNCEMENTS OF QUARTERLY (Q1, Q2 &<br />
Q3), HALF-YEAR AND FULL YEAR RESULTS<br />
1(a) An income statement (for the group) together with a comparative statement for the<br />
corresponding period of the immediately preceding financial year.<br />
Group<br />
(S$’000)<br />
Apr- Jun<br />
2005<br />
Group<br />
(S$’000)<br />
Apr- Jun<br />
2004<br />
(Restated)*<br />
%<br />
Increase/<br />
(Decrease)<br />
Group<br />
(S$’000)<br />
Jan- Jun<br />
2005<br />
Group<br />
(S$’000)<br />
Jan- Jun<br />
2004<br />
(Restated)*<br />
%<br />
Increase/<br />
(Decrease)<br />
Revenue 39,850 34,981 13.9 82,534 72,006 14.6<br />
Costs and expenses<br />
Changes in inventories of (2,053) 5,672 (1,373) 4,728<br />
finished goods<br />
Raw materials and<br />
(18,971) (22,875) 22.2 (41,141) (39,680) 21.6<br />
consumables used<br />
Staff costs (4,542) (3,363) 35.1 (9,041) (6,587) 37.3<br />
Depreciation and amortisation (422) (386) 9.3 (861) (760) 13.3<br />
expenses<br />
Foreign exchange gain/(loss) 439 457 (3.9) 701 (259) NM<br />
Other operating expenses (9,543) (10,061) (5.1) (18,452) (18,946) (2.6)<br />
(Note 1)<br />
Other income 272 26 NM 373 102 NM<br />
Finance costs (23) - NM (23) - NM<br />
Share of (losses)/profit of<br />
associated companies<br />
(100) 6 NM (68) (30) NM<br />
Profit before taxation 4,907 4,457 10.1 12,649 10,574 19.6<br />
Taxation (Note 2) (968) (1,060) (8.7) (2,982) (2,454) 21.5<br />
Profit after taxation 3,939 3,397 16.0 9,667 8,120 19.1<br />
Attributable to:<br />
Shareholders of the<br />
3,348 2,688 24.6 8,059 6,824 18.1<br />
Company<br />
Minority interests, net of<br />
591 709 (16.6) 1,608 1,296 24.1<br />
taxation<br />
Profit after taxation 3,939 3,397 16.0 9,667 8,120 19.1<br />
* Please refer to paragraph 4.<br />
Note 1: Included in other operating expenses is a provision for doubtful debts (trade). Details are shown below:<br />
Group<br />
(S$’000)<br />
Group<br />
(S$’000)<br />
Group<br />
(S$’000)<br />
Group<br />
(S$’000)<br />
Apr- Jun 2005 Apr- Jun 2004 Jan- Jun 2005 Jan- Jun 2004<br />
Provision for doubtful debts - 230 - 930
Note 2: Included in taxation for half year ended 30 June 2005 is an underprovision of S$338,000 (2004:S$nil) for<br />
the prior year.<br />
NM: Not meaningful.<br />
1(b)(i) A balance sheet (for the issuer and group), together with a comparative<br />
statement as at the end of the immediately preceding financial year.<br />
Group Group Company Company<br />
30/06/2005<br />
(S$'000)<br />
31/12/2004<br />
(Restated)<br />
(S$'000)<br />
30/06/2005<br />
(S$'000)<br />
31/12/2004<br />
(Restated)<br />
(S$'000)<br />
Assets Less Liabilities<br />
Non-Current Assets<br />
Fixed assets 14,450 13,369 - -<br />
Investments in subsidiary companies - - 12,519 12,519<br />
Investments in associated companies 1,427 1,272 979 979<br />
Deferred tax assets 948 1,385 - -<br />
Intangible assets 7,738 - - -<br />
24,563 16,026 13,498 13,498<br />
Current Assets<br />
Cash and bank balances 13,194 15,680 634 83<br />
Trade receivables 30,094 27,967 - -<br />
Prepayments,other deposits and other<br />
4,392 4,996 711 1,147<br />
receivables<br />
Amounts due from subsidiary companies<br />
(non-trade)<br />
- - 21,655 16,168<br />
Amounts due from associated companies (trade) 64 138 - -<br />
Amounts due from associated companies<br />
(non-trade)<br />
464 890 - 439<br />
Inventories 34,680 31,906 - -<br />
82,888 81,577 23,000 17,837<br />
Current Liabilities<br />
Trade payables and accruals (13,970) (19,555) (406) -<br />
Other payables (821) (414) (9) (314)<br />
Amount due to a related party (trade) - (1) - -<br />
Provision for taxation (4,380) (3,877) (9) (9)<br />
(19,171) (23,847) (424) (323)<br />
Net Current Assets 63,717 57,730 22,576 17,514<br />
Non-Current Liability<br />
Deferred tax liabilities (262) (249) - -<br />
(262) (249) - -<br />
Net Assets 88,018 73,507 36,074 31,012<br />
Equity<br />
Share capital 18,877 17,457 18,877 17,457<br />
Reserves 65,153 51,636 17,197 13,555<br />
84,030 69,093 36,074 31,012<br />
Minority interests 3,988 4,414 - -<br />
88,018 73,507 36,074 31,012
1(b)(ii)<br />
Aggregate amount of group’s borrowings and debt securities.<br />
Amount repayable in one year or less, or on demand<br />
As at 30/06/2005 As at 31/12/2004<br />
Secured Unsecured Secured Unsecured<br />
<br />
0 0 0 0<br />
Amount repayable after one year<br />
As at 30/06/2005 As at 31/12/2004<br />
Secured Unsecured Secured Unsecured<br />
<br />
0 0 0 0<br />
Details of any collateral<br />
NIL<br />
1(c) A cash flow statement (for the group), together with a comparative statement for<br />
the corresponding period of the immediately preceding financial year.<br />
Cash flows from operating activities:<br />
3 mths<br />
ended<br />
3 mths<br />
ended<br />
6 mths<br />
ended<br />
6 mths<br />
ended<br />
30 June<br />
2005<br />
30 June<br />
2004<br />
30 June<br />
2005<br />
30 June<br />
2004<br />
(Restated)<br />
(Restated)<br />
(S$'000) (S$'000) (S$'000) (S$'000)<br />
Profit from ordinary activities before taxation and minority<br />
4,907 4,457 12,649 10,574<br />
interests<br />
Adjustments for:<br />
Amortisation of goodwill - 5 - 10<br />
Depreciation of fixed assets 422 381 861 750<br />
Exchange realignment 1,082 801 1,355 360<br />
Loss/ (gain) on disposal of fixed assets 25 - 16 (9)<br />
Interest expense 23 - 23 -<br />
Interest income (25) (5) (45) (6)<br />
Share of losses/(gains) of associated companies 99 (6) 67 30<br />
Share-based payment expenses 145 57 276 63<br />
Operating income before reinvestment in working capital 6,678 5,690 15,202 11,772<br />
Increase in receivables (2,123) (3,677) (1,008) (3,640)<br />
Increase in inventories (1,914) (6,513) (2,774) (4,884)<br />
Increase/(decrease) in payables 21 5,148 (5,454) 3,896<br />
Cash generated from / (used in) from operations 2,662 648 5,966 7,144<br />
Income taxes paid (1,289) (790) (2,062) (1,457)<br />
Net cash generated from / (used in) from operating activities 1,373 (142) 3,904 5,687<br />
Cash flows from investing activities:<br />
Interest received 25 5 45 6<br />
Purchase of fixed assets (896) (258) (1,679) (419)<br />
Proceeds from sale of fixed assets 3 - 3 9
3 mths<br />
ended<br />
3 mths<br />
ended<br />
6 mths<br />
ended<br />
6 mths<br />
ended<br />
30 June<br />
2005<br />
30 June<br />
2004<br />
30 June<br />
2005<br />
30 June<br />
2004<br />
(Restated)<br />
(Restated)<br />
(S$'000) (S$'000) (S$'000) (S$'000)<br />
Loan to an associated company - (141) - (267)<br />
Investment in an associated company (162) (257) (162) (257)<br />
Net cash used in investing activities (1,030) (651) (1,793) (928)<br />
Cash flows from financing activities<br />
Dividends paid to minority shareholders of subsidiary companies (105) (944) (859) (1,351)<br />
Dividends paid to shareholders of the Company (4,225) (3,467) (4,225) (3,467)<br />
Interest expense (23) - (23) -<br />
Proceeds from issuance of shares 345 448 510 806<br />
Net cash used in financing activities (4,008) (3,963) (4,597) (4,012)<br />
Net (decrease)/ increase in cash and cash equivalents (3,665) (4,756) (2,486) 747<br />
Cash and cash equivalents at beginning of the period 16,859 17,328 15,680 11,825<br />
Cash and cash equivalents at end of the period 13,194 12,572 13,194 12,572<br />
1(d)(i)<br />
or (ii)<br />
A statement (for the issuer and group) showing either (i) all changes in equity<br />
changes in equity other than those arising from capitalisation issues and<br />
distributions to shareholders, together with a comparative statement for the<br />
corresponding period of the immediately preceding financial year.<br />
Share<br />
Capital<br />
Share<br />
Premium<br />
Foreign<br />
Currency<br />
Translation<br />
Reserve<br />
Other<br />
Reserve<br />
Revenue<br />
Reserve<br />
Total<br />
Minority<br />
Interests<br />
Total<br />
Equity<br />
(S$'000) (S$'000) (S$'000) (S$'000) (S$'000) (S$'000) (S$'000) (S$'000)<br />
The Group<br />
Balance as at<br />
01/01/2004<br />
- As previously 17,200 6,086 (202) - 33,918 57,002 3,277 60,279<br />
reported<br />
- Changes in<br />
- - - 14 (14) - - -<br />
accounting policies<br />
FRS 102<br />
- As restated 17,200 6,086 (202) 14 33,904 57,002 3,277 60,279<br />
Net profit for the<br />
- - - - 4,136 4,136 587 4,723<br />
period<br />
Dividends paid to a - - - - - - (407) (407)<br />
minority shareholder<br />
of a subsidiary<br />
company<br />
Movements during - - (485) 6 - (479) (29) (508)<br />
the period<br />
Issuance of ordinary 105 253 - - - 358 - 358<br />
shares<br />
Balance as at 17,305 6,339 (687) 20 38,040 61,017 3,428 64,445<br />
31/03/2004<br />
Net profit for the<br />
- - - - 2,688 2,688 709 3,397<br />
period<br />
Dividends paid to a<br />
minority shareholder<br />
of a subsidiary<br />
company<br />
- - - - - - (944) (944)
Dividends paid to<br />
shareholders of the<br />
Company<br />
Movements during<br />
the period<br />
Issuance of ordinary<br />
shares<br />
Balance as at<br />
30/06/2004<br />
Share<br />
Capital<br />
Share<br />
Premium<br />
Foreign<br />
Currency<br />
Translation<br />
Reserve<br />
Other<br />
Reserve<br />
Revenue<br />
Reserve<br />
Total<br />
Minority<br />
Interests<br />
Total<br />
Equity<br />
(S$'000) (S$'000) (S$'000) (S$'000) (S$'000) (S$'000) (S$'000) (S$'000)<br />
- - - - (3,467) (3,467) - (3,467)<br />
- - 794 58 - 852 52 904<br />
132 316 - - - 448 - 448<br />
17,437 6,655 107 78 37,261 61,538 3,245 64,783<br />
Balance as at<br />
01/01/2005<br />
- As previously 17,457 6,703 (529) - 45,698 69,329 4,414 73,743<br />
reported<br />
- Changes in<br />
- - (1,016) 346 434 (236) - (236)<br />
accounting policies<br />
FRS 21 & 102<br />
- As restated 17,457 6,703 (1,545) 346 46,132 69,093 4,414 73,507<br />
Net profit for the<br />
- - - - 4,711 4,711 1,017 5,728<br />
period<br />
Dividends paid to a<br />
- - - - - - (754) (754)<br />
minority shareholder<br />
of a subsidiary<br />
company<br />
Movements during<br />
- - 293 131 - 424 17 441<br />
the period<br />
Issuance of ordinary 49 116 - - - 165 - 165<br />
shares<br />
Balance as at 17,506 6,819 (1,252) 477 50,843 74,393 4,694 79,087<br />
31/03/2005<br />
Net profit for the<br />
- - - - 3,348 3,348 591 3,939<br />
period<br />
Dividends paid to a<br />
- - - - - - (105) (105)<br />
minority shareholder<br />
of a subsidiary<br />
company<br />
Dividends paid to<br />
- - - - (4,225) (4,225) - (4,225)<br />
shareholders of the<br />
Company<br />
Movements during<br />
- - 1,387 145 - 1,532 - 1,532<br />
the period<br />
Acquisition of<br />
- - - - - - (1,192) (1,192)<br />
shares from minority<br />
shareholder of a<br />
subsidiary company<br />
Issuance of ordinary 1,371 7,611 - - - 8,982 - 8,982<br />
shares<br />
Balance as at<br />
30/06/2005<br />
18,877 14,430 135 622 49,966 84,030 3,988 88,018
Share<br />
Capital<br />
Share<br />
Premium<br />
Foreign<br />
Currency<br />
Translation<br />
Reserve<br />
Other<br />
Reserve<br />
Revenue<br />
Reserve<br />
Total<br />
(S$'000) (S$'000) (S$'000) (S$'000) (S$'000) (S$'000)<br />
The Company<br />
Balance as at<br />
01/01/2004<br />
- As previously 17,200 6,086 - - 8,433 31,719<br />
reported<br />
- Changes in<br />
- - - 14 (14) -<br />
accounting policies<br />
FRS 102<br />
- As restated 17,200 6,086 - 14 8,419 31,719<br />
Net (loss) for the<br />
- - - - (21) (21)<br />
period<br />
Movements during - - - 6 - 6<br />
the period<br />
Issuance of<br />
105 253 - - - 358<br />
ordinary shares<br />
Balance as at 17,305 6,339 - 20 8,398 32,062<br />
31/03/2004<br />
Net (loss) for the<br />
- - - - (47) (47)<br />
period<br />
Movements during - - - 58 - 58<br />
the period<br />
Issuance of<br />
132 316 - - - 448<br />
ordinary shares<br />
Dividends paid to<br />
- - - - (3,467) (3,467)<br />
shareholders of<br />
the Company<br />
Balance as at<br />
30/06/2004<br />
17,437 6,655 - 78 4,884 29,054<br />
Balance as at<br />
01/01/2005<br />
- As previously 17,457 6,703 - - 6,852 31,012<br />
reported<br />
- Changes in<br />
- - - 346 (346) -<br />
accounting policies<br />
FRS 102<br />
- As restated 17,457 6,703 - 346 6,506 31,012<br />
Net (loss) for the<br />
- - - - (279) (279)<br />
period<br />
Movements during - - - 131 - 131<br />
the period<br />
Issuance of<br />
49 116 - - - 165<br />
ordinary shares<br />
Balance as at 17,506 6,819 - 477 6,227 31,029<br />
31/03/2005<br />
Net profit for the<br />
- - - - 143 143<br />
period<br />
Movements during - - - 145 - 145<br />
the period<br />
Issuance of<br />
1,371 7,611 - - - 8,982<br />
ordinary shares<br />
Dividends paid to<br />
- - - - (4,225) (4,225)<br />
shareholders of<br />
the Company<br />
Balance as at<br />
30/06/2005<br />
18,877 14,430 - 622 2,145 36,074
1(d)(ii) Details of any changes in the company's share capital arising from rights issue,<br />
bonus issue, share buy-backs, exercise of share options or warrants, conversion of<br />
other issues of equity securities, issue of shares for cash or as consideration for<br />
acquisition or for any other purpose since the end of the previous period reported<br />
on. State also the number of shares that may be issued on conversion of all the<br />
outstanding convertibles as at the end of the current financial period reported on<br />
and as at the end of the corresponding period of the immediately preceding<br />
financial year.<br />
The issued and paid-up capital of the Company increased from S$17,505,500 as at 31<br />
March 2005 to S$18,877,250 as at 30 June 2005. The increase was due to 2,035,000 new<br />
ordinary shares of S$0.05 each alloted and issued pursuant to the exercise of options<br />
granted under the <strong>Food</strong> <strong>Empire</strong> Share Option Scheme (the “Option Scheme”). In addition,<br />
25,400,000 new ordinary shares of S$0.05 each alloted and issued pursuant to the Sales &<br />
Purchase agreement entered with Sudeep Nair and Bestgate Investments Ltd and<br />
completed on 30 June 2005.<br />
Balance as at No of options No of options No of options Balance as at Exercise Price Exercise Period<br />
01-Apr-05 granted during lapsed during the exercised during the 30-Jun-05 per share<br />
the period period<br />
period<br />
$<br />
2002 Options 8,450,000 - (105,000) (2,035,000) 6,310,000 0.17 14 March 2004 to 13 March 2012<br />
2002 Options 800,000 - - - 800,000 0.17 14 March 2004 to 13 March 2007<br />
2003 Options 500,000 - - - 500,000 0.27 04 June 2005 to 13 March 2012<br />
2004 Options 400,000 - - - 400,000 0.275 25 May 2006 to 24 May 2009<br />
2004 Options 12,525,000 - (800,000) 11,725,000 0.275 25 May 2006 to 24 May 2014<br />
22,675,000 - (905,000) (2,035,000) 19,735,000<br />
As at 30 June 2005, options to subscribe for a total of 19,735,000 ordinary shares were<br />
outstanding under the Option Scheme . As at 30 June 2004, there were unexercised<br />
options for 25,650,000 of unissued ordinary shares of the Company under the Option<br />
Scheme.<br />
2. Whether the figures have been audited or reviewed and in accordance with which<br />
auditing standard or practice.<br />
The figures are unaudited and were not reviewed by the auditors.<br />
3. Where the figures have been audited or reviewed, the auditors’ report (including any<br />
qualifications or emphasis of a matter).<br />
Not applicable.<br />
4. Whether the same accounting policies and methods of computation as in the issuer’s<br />
most recently audited annual financial statements have been applied.<br />
The Group has applied the same accounting policies and methods of computation in the<br />
financial statements for the current financial period compared with the audited financial<br />
statements as at 31 December 2004 except for the adoption of the following new <strong>Financial</strong><br />
Reporting Standards (“FRS”) that are mandatory for the financial years beginning on or after 1<br />
January 2005:<br />
FRS 21:<br />
FRS 102:<br />
The Effects of Changes in Foreign Exchange Rates<br />
Share-based payment<br />
The impact of the changes in accounting policies is as follows:
1. FRS 21<br />
The adoption of FRS 21 has impact on the following:-<br />
a) Net Profit for the Group for Half Year ended 30 June 2004 was decreased by S$221,000.<br />
b) There was no impact on the revenue reserve of the Group as at 1 January 2004 as the<br />
Management is of the opinion that it is impractical to determine the effects of the change<br />
in accounting policy prior to 1 January 2004. Hence, the change in accounting policy is<br />
applied as at 1 January 2004.<br />
There is no impact at the Company level as the changes affected a subsidiary of the Group.<br />
2. FRS 102<br />
By adopting FRS 102, the Group and Company adjusted downwards the opening revenue<br />
reserve as at 1 January 2004 by S$14,000.<br />
Net Profit for the Group and the Company for Half Year ended 30 June 2004 was reduced by<br />
S$64,000.<br />
3. Effects of FRS 21 and FRS102 on Earnings Per Share(EPS)<br />
The effect of FRS 21 and FRS 102 on the Group’s basic and diluted EPS for Second Quarter<br />
ended 30 June 2004 is as follows:<br />
Basic EPS<br />
Diluted EPS<br />
Decrease of 0.14 cents<br />
Decrease of 0.13 cents<br />
The effect of FRS 21 and FRS 102 on the Group’s basic and diluted EPS for First Half ended<br />
30 June 2004 is as follows:<br />
Basic EPS<br />
Diluted EPS<br />
Decrease of 0.08 cents<br />
Decrease of 0.06 cents<br />
Apart from the above, the various revisions in FRS, applicable from 1 January 2005, are<br />
currently being assessed to ensure there are no material impact on the Group’s results.<br />
5. If there are any changes in the accounting policies and methods of computation,<br />
including any required by an accounting standard, what has changed, as well as the<br />
reasons for, and the effect of, the change.<br />
Please refer to paragraph 4.<br />
6. Earnings per ordinary share of the group for the current financial period reported on<br />
and the corresponding period of the immediately preceding financial year, after<br />
deducting any provision for preference dividends.<br />
Group Group Group Group<br />
3 months<br />
ended<br />
30/06/2005<br />
3 months<br />
ended<br />
30/06/2004<br />
(Restated)<br />
6 months<br />
ended<br />
30/06/2005<br />
6 months<br />
ended<br />
30/06/2004<br />
(Restated)<br />
Earnings per share<br />
(i) Based on existing issued share capital<br />
0.95 0.77 2.30 1.97<br />
(cents)<br />
(ii) On a fully diluted basis (cents) 0.95 0.76 2.27 1.95
Weighted average number of shares table<br />
3 mths<br />
ended<br />
3 mths<br />
ended<br />
6 mths<br />
ended<br />
6 mths<br />
ended<br />
30/06/2005 30/06/2004 30/06/2005 30/06/2004<br />
Weighted average number of shares<br />
for calculation of basic EPS 351,358,554 347,649,451 350,799,212 345,973,517<br />
Weighted average number of shares<br />
for calculation of diluted EPS 354,064,391 351,638,891 355,506,046 350,251,330<br />
7. Net asset value (for the issuer and group) per ordinary share based on issued share<br />
capital of the issuer at the end of the:-<br />
(a) current financial period reported on; and<br />
(b) immediately preceding financial year.<br />
Group Group Company Company<br />
30/06/2005 31/12/2004 30/06/2005 31/12/2004<br />
(Restated)<br />
(Restated)<br />
Net asset value per ordinary share (cents) 22.26 19.79 9.55 8.88<br />
8. A review of the performance of the group, to the extent necessary for a reasonable<br />
understanding of the group’s business. It must include a discussion of the<br />
following:-<br />
(a) any significant factors that affected the turnover, costs, and earnings of the<br />
group for the current financial period reported on, including (where applicable)<br />
seasonal or cyclical factors; and<br />
(b) any material factors that affected the cash flow, working capital, assets or<br />
liabilities of the group during the current financial period reported on.<br />
In Q2 2005, the Group continued to deliver double-digit growth in Revenue and Net Profit<br />
Attributable to Shareholders. Improvement was led by business expansion in key markets of Russia<br />
and Eastern Europe & Central Asia. Growth was broad-based for both beverage and non-beverage<br />
products.<br />
Revenue<br />
Geographical Analysis<br />
2Q05 2Q04 Chg 1H05 1H04 Chg<br />
$’000 $’000 $’000 $’000<br />
Russia 24,521 21,129 +16.1% 53,992 43,356 +24.5%<br />
Eastern Europe & Central Asia 13,085 11,112 +17.8% 22,962 23,340 -1.6%<br />
Others 2,244 2,740 -18.1% 5,580 5,310 +5.1%<br />
Total 39,850 34,981 +13.9% 82,534 72,006 +14.6%<br />
Stronger sales in key market segments of Russia and Eastern Europe & Central Asia contributed to the<br />
increase in Group Revenue. Russia remains as the top contributor to Group Revenue at 61.5%,<br />
followed by Eastern Europe & Central Asia at 32.8%. Sales from Other Markets made up the balance.<br />
Revenue from Russia rose 16.1% or S$3.4 million to S$24.5 million, and Eastern Europe & Central<br />
Asia increased by 17.8% to S$13.1 million in Q2 2005. This growth was due to successful distribution<br />
network expansion and ongoing promotion of the Group’s strong product brand name.<br />
Sales from the Ukraine market improved owing to the strong MacCoffee brand name built up over the<br />
years. Revenue from other Commonwealth of Independent States had also grown significantly.<br />
Revenue from Other markets fell S$0.5 million to S$2.2 million in Q2 2005 due to lower sales from the<br />
Middle East and USA markets.
For the first six months of 2005, Group Revenue was lifted 14.6% due to strong demand of the Group’s<br />
flagship products such as MacCoffee 3-in-1 which continued to perform well in Russia and other<br />
markets.<br />
Product Analysis<br />
2Q05 2Q04 Chg 1H05 1H04 Chg<br />
$’000 $’000 $’000 $’000<br />
Beverages 36,046 31,868 +13.1% 76,190 65,738 +15.9%<br />
Non-Beverages 3,804 3,113 +22.2% 6,344 6,268 +1.2%<br />
Total 39,850 34,981 +13.9% 82,534 72,006 +14.6%<br />
The Beverage product segment contributed to 90.5% of the Group Revenue compared to 91.1% in the<br />
corresponding quarter of the previous year. Beverage sales rose 13.1% to S$36.0 million led by higher<br />
sales from coffee-based products. Revenue from Non-beverage products grew 22.2% to S$3.8 million<br />
in Q2 2005 lifted by higher demand for snack food and confectionery food products.<br />
Net Profit<br />
Profit Before Tax improved by 10.1% to S$4.9 million in the second quarter of 2005. The increase in<br />
profit was driven largely by higher sales while the costs of major raw materials had increased.<br />
Raw Materials and Consumables Used increased by 22.2% or S$3.8 million to S$21.0 million in Q2<br />
2005 due to rising prices of coffee powder, sugar and packaging materials which were significantly<br />
higher compared to Q2 2004.<br />
Staff costs increased S$1.2 million or 35.1% to S$4.5 million due mainly to business expansions and<br />
employee share option expensing that started in this financial year.<br />
Other operating expenses fell 5.1% to S$9.5 million despite higher business activities. This is<br />
attributable to lower advertising and promotional expenses in the second quarter of 2005, while<br />
overseas office expenditure increased.<br />
Net Profit attributable to Shareholders grew 24.6% from S$2.7 million in Q2 2004 to S$3.3 million.<br />
For the six-month period ended 30 June 2005, Group Profit attributable to Shareholders rose 18.1% to<br />
S$8.1 million due mainly to the increase in turnover despite the rising raw material costs.<br />
Balance Sheet & Cash Flow<br />
Fixed Assets increased by S$1.1 million to S$14.5 million compared to year end 2004 due mainly to the<br />
roll-out of factory in Vietnam.<br />
On 30 June 2005, the Group completed its acquisition of 13% in Future Enterprises (Russia) Pte Ltd<br />
and FER (HK) <strong>Limited</strong>, which resulted in intangible assets of S$7.7 million.<br />
Cash and bank balances fell S$2.5 million from S$15.7 million as at 31 December 2004 to S$13.2<br />
million as at 30 June 2005 partly due to payment of dividends of S$5.1 million to shareholders. The<br />
Group continued to maintain its debt-free status.<br />
9. Where a forecast, or a prospect statement, has been previously disclosed to<br />
shareholders, any variance between it and the actual results.<br />
Not applicable.
10. A commentary at the date of the announcement of the significant trends and competitive<br />
conditions of the industry in which the group operates and any known factors or events<br />
that may affect the group in the next reporting period and the next 12 months.<br />
The Group will continue to invest in brand building and distribution network expansion to improve its<br />
market share.<br />
For the rest of FY2005, market conditions are expected to remain competitive. Foreign currency<br />
fluctuations as well as rising raw material costs will continue to be significant factors that would affect<br />
the Group’s performance. Despite challenging business conditions ahead, the Group is cautiously<br />
optimistic of its business prospects.<br />
11. Dividend<br />
(a) Current <strong>Financial</strong> Period Reported On<br />
Any dividend declared for the current financial period reported on?<br />
None<br />
(b) Corresponding Period of the Immediately Preceding <strong>Financial</strong> Year<br />
Any dividend declared for the corresponding period of the immediately preceding financial<br />
year? None<br />
(c) Date payable<br />
Not applicable.<br />
(d) Books closure date<br />
Not applicable.<br />
12. If no dividend has been declared/recommended, a statement to that effect.<br />
Not applicable.<br />
PART II - ADDITIONAL INFORMATION REQUIRED FOR FULL YEAR ANNOUNCEMENT<br />
(This part is not applicable to Q1, Q2, Q3 or Half Year Results)<br />
13. Segmented revenue and results for business or geographical segments (of the group) in<br />
the form presented in the issuer’s most recently audited annual financial statements,<br />
with comparative information for the immediately preceding year.<br />
Not applicable<br />
14. In the review of performance, the factors leading to any material changes in<br />
contributions to turnover and earnings by the business or geographical segments.<br />
Not applicable.<br />
15. A breakdown of sales.<br />
Not applicable.
16. A breakdown of the total annual dividend (in dollar value) for the issuer’s latest<br />
full year and its previous full year.<br />
Total Annual Dividend (Refer to Para 16 of Appendix 7.2 for the required details)<br />
Latest Full Year (S$)<br />
FY2004<br />
Previous Full Year (S$)<br />
FY2003<br />
Ordinary - -<br />
Preference - -<br />
Total: - -<br />
BY ORDER OF THE BOARD<br />
Tan San-Ju<br />
Company Secretary<br />
11 August 2005