Polynomial functions
Polynomial functions
Polynomial functions

You also want an ePaper? Increase the reach of your titles
YUMPU automatically turns print PDFs into web optimized ePapers that Google loves.
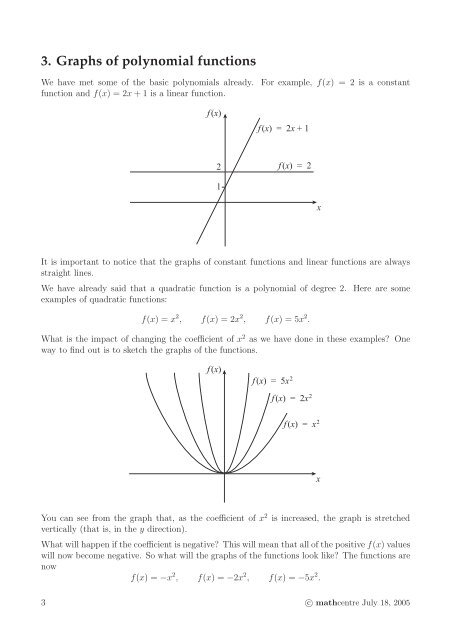
3. Graphs of polynomial <strong>functions</strong><br />
We have met some of the basic polynomials already. For example, f(x) = 2 is a constant<br />
function and f(x) = 2x + 1 is a linear function.<br />
f (x)<br />
f (x) = 2x + 1<br />
2 f (x) = 2<br />
1<br />
x<br />
It is important to notice that the graphs of constant <strong>functions</strong> and linear <strong>functions</strong> are always<br />
straight lines.<br />
We have already said that a quadratic function is a polynomial of degree 2. Here are some<br />
examples of quadratic <strong>functions</strong>:<br />
f(x) = x 2 , f(x) = 2x 2 , f(x) = 5x 2 .<br />
What is the impact of changing the coefficient of x 2 as we have done in these examples? One<br />
way to find out is to sketch the graphs of the <strong>functions</strong>.<br />
f (x)<br />
f (x) = 5x 2<br />
f (x) = 2x 2<br />
f (x) = x 2<br />
x<br />
You can see from the graph that, as the coefficient of x 2 is increased, the graph is stretched<br />
vertically (that is, in the y direction).<br />
What will happen if the coefficient is negative? This will mean that all of the positive f(x) values<br />
will now become negative. So what will the graphs of the <strong>functions</strong> look like? The <strong>functions</strong> are<br />
now<br />
f(x) = −x 2 , f(x) = −2x 2 , f(x) = −5x 2 .<br />
3 c○ mathcentre July 18, 2005