Polynomial functions
Polynomial functions
Polynomial functions

Create successful ePaper yourself
Turn your PDF publications into a flip-book with our unique Google optimized e-Paper software.
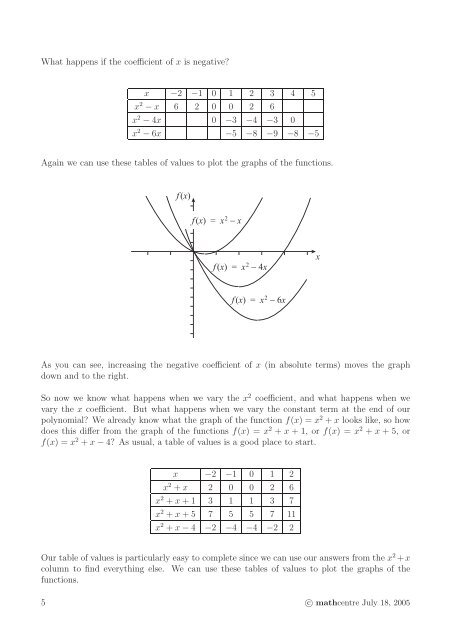
What happens if the coefficient of x is negative?<br />
x −2 −1 0 1 2 3 4 5<br />
x 2 − x 6 2 0 0 2 6<br />
x 2 − 4x 0 −3 −4 −3 0<br />
x 2 − 6x −5 −8 −9 −8 −5<br />
Again we can use these tables of values to plot the graphs of the <strong>functions</strong>.<br />
f (x)<br />
f (x) = x 2 − x<br />
f (x) = x 2 − 4x<br />
x<br />
f (x) = x 2 − 6x<br />
As you can see, increasing the negative coefficient of x (in absolute terms) moves the graph<br />
down and to the right.<br />
So now we know what happens when we vary the x 2 coefficient, and what happens when we<br />
vary the x coefficient. But what happens when we vary the constant term at the end of our<br />
polynomial? We already know what the graph of the function f(x) = x 2 + x looks like, so how<br />
does this differ from the graph of the <strong>functions</strong> f(x) = x 2 + x + 1, or f(x) = x 2 + x + 5, or<br />
f(x) = x 2 + x − 4? As usual, a table of values is a good place to start.<br />
x −2 −1 0 1 2<br />
x 2 + x 2 0 0 2 6<br />
x 2 + x + 1 3 1 1 3 7<br />
x 2 + x + 5 7 5 5 7 11<br />
x 2 + x − 4 −2 −4 −4 −2 2<br />
Our table of values is particularly easy to complete since we can use our answers from the x 2 +x<br />
column to find everything else. We can use these tables of values to plot the graphs of the<br />
<strong>functions</strong>.<br />
5 c○ mathcentre July 18, 2005