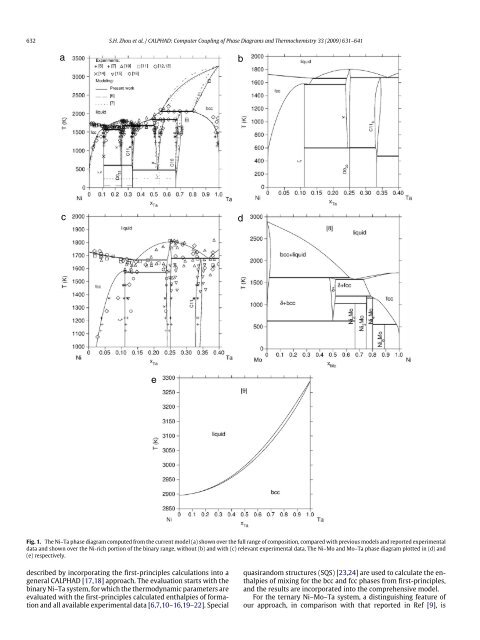
632 S.H. Zhou et al. / CALPHAD: <strong>Computer</strong> <strong>Coupling</strong> <strong>of</strong> <strong>Phase</strong> <strong>Diagrams</strong> <strong>and</strong> <strong>Thermochemistry</strong> 33 (2009) 631–641 a b c d e Fig. 1. The Ni–Ta phase diagram computed from the current model (a) shown over the full range <strong>of</strong> composition, compared with previous models <strong>and</strong> reported experimental data <strong>and</strong> shown over the Ni-rich portion <strong>of</strong> the binary range, without (b) <strong>and</strong> with (c) relevant experimental data. The Ni–Mo <strong>and</strong> Mo–Ta phase diagram plotted in (d) <strong>and</strong> (e) respectively. described by incorporating the first-principles calculations into a general CALPHAD [17,18] approach. The evaluation starts with the binary Ni–Ta system, for which the thermodynamic parameters are evaluated with the first-principles calculated enthalpies <strong>of</strong> formation <strong>and</strong> all available experimental data [6,7,10–16,19–22]. Special quasir<strong>and</strong>om structures (SQS) [23,24] are used to calculate the enthalpies <strong>of</strong> mixing for the bcc <strong>and</strong> fcc phases from first-principles, <strong>and</strong> the results are incorporated into the comprehensive model. For the ternary Ni–Mo–Ta system, a distinguishing feature <strong>of</strong> our approach, in comparison with that reported in Ref [9], is
S.H. Zhou et al. / CALPHAD: <strong>Computer</strong> <strong>Coupling</strong> <strong>of</strong> <strong>Phase</strong> <strong>Diagrams</strong> <strong>and</strong> <strong>Thermochemistry</strong> 33 (2009) 631–641 633 Table 1 A listing <strong>of</strong> phases modeled in the current treatment. Formula unit Sym. Lattice Struk. Des. Prototype Ref. <strong>Phase</strong>s extending from the pure component states: Ni, Ta, Mo – – – Liquid – Ni – cub A1 fcc – Ta – cub A2 bcc – Mo – cub A2 bcc – <strong>Phase</strong>s extending from the Ni–Ta binary system: NiTa 2 – tet C16 Al 2 Cu [33] NiTa µ trig D8 5 Fe 7 W 6 [33] Ni 2 Ta – tet C11 b MoSi 2 [25,26] Ni 3 Ta κ mono – Pt 3 Ta [25,26] – tet D0 22 Al 3 Ti [25,26] Ni 8 Ta ζ tet – Ni 8 Nb [14] <strong>Phase</strong>s extending from the Ni–Mo binary system: NiMo δ orth – NiMo [25] Ni 2 Mo – tet – Pt 2 Mo [34] Ni 3 Mo – tet D0 a Cu 3 Ti [25] Ni 4 Mo – tet D1 a Ni 4 Mo [25] Ni 8 Mo ζ tet – Ni 8 Nb [14] Fig. 2. The enthalpy <strong>of</strong> formation <strong>of</strong> the Ni–Ta system, as computed using the present model, shown with first-principles calculations <strong>and</strong> reported experimental data. Modeling Present work Cui <strong>and</strong> Jin [6] Pan <strong>and</strong> Jin [7] Experiment Sudavtsova [19] Schaeffers et al. [20] Fig. 3. The enthalpy <strong>of</strong> mixing in liquid at 1873 K, as computed using the present model. Reported experimental data <strong>and</strong> prior modeling are also shown. that we allow for Mo–Ta substitution. For example, the stable D0 a -Ni 3 Mo <strong>and</strong> metastable D0 a -Ni 3 Ta phases (Cu 3 Ti structure [25,26]) are treated as a single solution phase denoted by D0 a -Ni 3 (Mo, Ta). Similarly, the metastable κ-Ni 3 Mo <strong>and</strong> stable κ-Ni 3 Ta phases (Pt 3 Ta structure [25,26]) are described as κ-Ni 3 (Mo, Ta), <strong>and</strong> the stable Ni 8 Ta <strong>and</strong> Ni 8 Mo phases (Ni 8 Nb structure [14]) are described as ζ -Ni 8 (Mo, Ta). The ternary parameters for the individual phases are evaluated using all available experimental information [9,27–29], <strong>and</strong> the resulting model for phase equilibria in this ternary system are presented in the forms <strong>of</strong> liquidus projections <strong>and</strong> isothermal sections <strong>of</strong> the phase diagram. 2. Thermodynamic models The phases considered in the present model are listed in Table 1, indicating the symbol to be used in this paper <strong>and</strong> the prototype structure. The thermodynamic properties <strong>of</strong> pure Ni, Mo, <strong>and</strong> Ta in the various relevant structures are computed using the parameters from the SGTE database [30], as listed in Table 2. In addition to the compounds in the Ni–Mo system described in Ref. [8], the fcc, bcc <strong>and</strong> liquid phases are modeled as simple ternary substitutional solutions, the C16-NiTa 2 , µ-NiTa, C11 b -Ni 2 Ta, κ- Ni 3 (Mo, Ta), D0 a -Ni 3 (Mo, Ta) <strong>and</strong> ζ -Ni 8 (Mo, Ta) intermetallic phases are described with a sublattice formalism [31], while the D0 22 -Ni 3 Ta phase is treated as stoicheometric compound in the ternary Ni–Mo–Ta system. The thermodynamic models are defined in Table 3, where the total Gibbs free energy for any phase, Φ, is generally given by the sum <strong>of</strong> three contributions, G Φ m = ref G Φ m + id G Φ m + xs G Φ m , (1) where the subscript m denote that all terms are molar quantities <strong>of</strong> formular unit. The first term in Eq. (1) is given by the sum <strong>of</strong> occupancy-weighted sublattice end-member contributions. The second <strong>and</strong> third terms are the ideal <strong>and</strong> excess parts <strong>of</strong> the Gibbs free energy <strong>of</strong> mixing, respectively. In Table 3, a Redlich–Kister polynomial [32] is used to describe the composition <strong>and</strong> temperature dependence <strong>of</strong> the excess Gibbs free energy associated with mixing. The specific treatment <strong>of</strong> each phase is discussed briefly here. The liquid, fcc <strong>and</strong> bcc phases are described with a single lattice, using the model given in Table 3, where 0 G Φ i is the molar Gibbs free energy <strong>of</strong> the pure element i with the structure Φ (Φ = liquid, fcc or bcc), as listed in Table 2, <strong>and</strong> x i is the mole fraction <strong>of</strong> the indicated component i. j L Φ i,k is the binary interaction parameter, <strong>and</strong> L Φ Mo,Ni,Ta is a composition dependent ternary interaction parameter, expressed as L Φ = Mo,Ni,Ta x Mo 0 L Φ + Mo,Ni,Ta x Ni 1 L Φ + Mo,Ni,Ta x Ta 2 L Φ Mo,Ni,Ta , where the parameters 0 L Φ Mo,Ni,Ta , 1 L Φ Mo,Ni,Ta <strong>and</strong> 2 L Φ Mo,Ni,Ta may be temperature dependent <strong>and</strong> are evaluated with experimental data. The µ-NiTa phase has been reported [33] to have a rhombohedral structure (Fe 7 W 6 prototype) with a primitive unit cell <strong>of</strong> 13 atoms, distributed in five sublattices as (Ni, Ta) 12 1 (Ta)15 2 (Ta)16 2 (Ni, Ta) 14 2 (Ni, Ta)12 6 . (The subscript is the number <strong>of</strong> sites in that sublattice, <strong>and</strong> the superscript is the coordination number.) The analysis by Andersson et al. [35], later showed that fcc <strong>and</strong> bcc elements prefer sublattices with a coordination numbers <strong>of</strong> 12 while bcc elements prefer sublattices with coordination numbers <strong>of</strong> 14 <strong>and</strong> 15. This led to the use <strong>of</strong> a four-sublattice model by Ansara et al. [36] <strong>and</strong> was supported by the investigation <strong>of</strong> Joubert <strong>and</strong> Dupin [37], where the atom distribution was confirmed to be (Ni, Ta) 1 (Ta) 4 (Ni, Ta) 2 (Ni, Ta) 6 , which we adopt here. The corresponding Gibbs free energy terms are given in Table 3, where y I , y III , <strong>and</strong> y IV are the site occupancy fractions in the first, third <strong>and</strong> fourth sublattices, respectively. k L µ is the kth interaction parameter, expressed as k a µ + k b µ T . 0 G µ i:Ta:j:k represents the Gibbs free energy <strong>of</strong> the end-members (i) 1 (Ta) 4 (j) 2 (k) 6 with the Gibbs free energy <strong>of</strong> formation, G µ i:Ta:j:k , being expressed as aµ + i:Ta:j:k bµ i:Ta:j:k T . Considering the composition range <strong>of</strong> µ-NiTa phase being around 0.5, the