

Computer Coupling of Phase Diagrams and Thermochemistry
Computer Coupling of Phase Diagrams and Thermochemistry
Computer Coupling of Phase Diagrams and Thermochemistry

You also want an ePaper? Increase the reach of your titles
YUMPU automatically turns print PDFs into web optimized ePapers that Google loves.
638 S.H. Zhou et al. / CALPHAD: <strong>Computer</strong> <strong>Coupling</strong> <strong>of</strong> <strong>Phase</strong> <strong>Diagrams</strong> <strong>and</strong> <strong>Thermochemistry</strong> 33 (2009) 631–641<br />
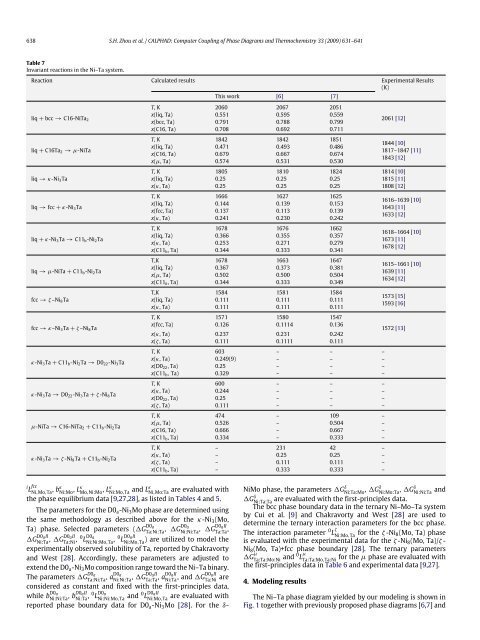
Table 7<br />
Invariant reactions in the Ni–Ta system.<br />
Reaction Calculated results Experimental Results<br />
(K)<br />
This work [6] [7]<br />
liq + bcc → C16-NiTa 2<br />
x(liq, Ta) 0.551 0.595 0.559<br />
x(bcc, Ta) 0.791 0.788 0.799<br />
T, K 2060 2067 2051<br />
x(C16, Ta) 0.708 0.692 0.711<br />
liq + C16Ta 2 → µ-NiTa<br />
liq → κ-Ni 3 Ta<br />
liq → fcc + κ-Ni 3 Ta<br />
liq + κ-Ni 3 Ta → C11 b -Ni 2 Ta<br />
liq → µ-NiTa + C11 b -Ni 2 Ta<br />
fcc → ζ –Ni 8 Ta<br />
fcc → κ–Ni 3 Ta + ζ –Ni 8 Ta<br />
κ-Ni 3 Ta + C11 b -Ni 2 Ta → D0 22 -Ni 3 Ta<br />
κ-Ni 3 Ta → D0 22 -Ni 3 Ta + ζ -Ni 8 Ta<br />
µ-NiTa → C16-NiTa 2 + C11 b -Ni 2 Ta<br />
κ-Ni 3 Ta → ζ -Ni 8 Ta + C11 b -Ni 2 Ta<br />
T, K 1842 1842 1851<br />
x(liq, Ta) 0.471 0.493 0.486<br />
x(C16, Ta) 0.679 0.667 0.674<br />
x(µ, Ta) 0.574 0.531 0.530<br />
2061 [12]<br />
1844 [10]<br />
1817–1847 [11]<br />
1843 [12]<br />
T, K 1805 1810 1824 1814 [10]<br />
x(liq, Ta) 0.25 0.25 0.25<br />
1815 [11]<br />
x(κ, Ta) 0.25 0.25 0.25<br />
1808 [12]<br />
T, K 1666 1627 1625<br />
x(liq, Ta) 0.144 0.139 0.153<br />
x(fcc, Ta) 0.137 0.113 0.139<br />
x(κ, Ta) 0.241 0.230 0.242<br />
T, K 1678 1676 1662<br />
x(liq, Ta) 0.366 0.355 0.357<br />
x(κ, Ta) 0.253 0.271 0.279<br />
x(C11 b , Ta) 0.344 0.333 0.341<br />
T,K 1678 1663 1647<br />
x(liq, Ta) 0.367 0.373 0.381<br />
x(µ, Ta) 0.502 0.500 0.504<br />
x(C11 b , Ta) 0.344 0.333 0.349<br />
T,K 1584 1581 1584<br />
x(liq, Ta) 0.111 0.111 0.111<br />
x(κ, Ta) 0.111 0.111 0.111<br />
T, K 1571 1580 1547<br />
x(fcc, Ta) 0.126 0.1114 0.136<br />
x(κ, Ta) 0.237 0.231 0.242<br />
x(ζ , Ta) 0.111 0.1111 0.111<br />
T, K 603 – – –<br />
x(κ, Ta) 0.249(9) – – –<br />
x(D0 22 , Ta) 0.25 – – –<br />
x(C11 b , Ta) 0.329 – – –<br />
T, K 600 – – –<br />
x(κ, Ta) 0.244 – – –<br />
x(D0 22 , Ta) 0.25 – – –<br />
x(ζ , Ta) 0.111 – – –<br />
T, K 474 – 109 –<br />
x(µ, Ta) 0.526 – 0.504 –<br />
x(C16, Ta) 0.666 – 0.667 –<br />
x(C11 b , Ta) 0.334 – 0.333 –<br />
T, K – 231 42 –<br />
x(κ, Ta) – 0.25 0.25 –<br />
x(ζ , Ta) – 0.111 0.111 –<br />
x(C11 b , Ta) – 0.333 0.333 –<br />
1616–1639 [10]<br />
1643 [11]<br />
1633 [12]<br />
1618–1664 [10]<br />
1673 [11]<br />
1678 [12]<br />
1615–1661 [10]<br />
1639 [11]<br />
1634 [12]<br />
1573 [15]<br />
1593 [16]<br />
1572 [13]<br />
i L fcc<br />
Ni,Mo,Ta , bκ Ni:Mo , Lκ Mo,Ni:Mo , Lκ Ni:Mo,Ta <strong>and</strong> Lκ Ni,Mo:Ta<br />
are evaluated with<br />
the phase equilibrium data [9,27,28], as listed in Tables 4 <strong>and</strong> 5.<br />
The parameters for the D0 a -Ni 3 Mo phase are determined using<br />
the same methodology as described above for the κ-Ni 3 (Mo,<br />
Ta) phase. Selected parameters (G D0 a<br />
Ta:Ni:Ta , GD0 a<br />
Ni:Ni:Ta , GD0 aII<br />
Ta:Ta ,<br />
G D0 aII<br />
Ni:Ta , GD0 aII<br />
Ta:Ni , 0 L D0 a<br />
Ni:Ni:Mo,Ta , 0 L D0 aII<br />
Ni:Mo,Ta<br />
) are utilized to model the<br />
experimentally observed solubility <strong>of</strong> Ta, reported by Chakravorty<br />
<strong>and</strong> West [28]. Accordingly, these parameters are adjusted to<br />
extend the D0 a -Ni 3 Mo composition range toward the Ni–Ta binary.<br />
The parameters G D0 a<br />
Ta:Ni:Ta , aD0 a<br />
Ni:Ni:Ta , GD0 aII<br />
Ta:Ta , aD0 aII<br />
Ni:Ta , <strong>and</strong> GD0 aII<br />
Ta:Ni are<br />
considered as constant <strong>and</strong> fixed with the first-principles data,<br />
while b D0 a<br />
Ni:Ni:Ta , bD0 aII<br />
Ni:Ta , 0 L D0 a<br />
Ni:Ni:Mo,Ta <strong>and</strong> 0 L D0 aII<br />
Ni:Mo,Ta<br />
are evaluated with<br />
reported phase boundary data for D0 a -Ni 3 Mo [28]. For the δ-<br />
NiMo phase, the parameters G δ Ni:Ta:Mo , Gδ Ni:Mo:Ta , Gδ Ni:Ni:Ta <strong>and</strong><br />
G δ Ni:Ta:Ta<br />
are evaluated with the first-principles data.<br />
The bcc phase boundary data in the ternary Ni–Mo–Ta system<br />
by Cui et al. [9] <strong>and</strong> Chakravorty <strong>and</strong> West [28] are used to<br />
determine the ternary interaction parameters for the bcc phase.<br />
The interaction parameter 0 L ζ Ni:Mo,Ta for the ζ -Ni 8(Mo, Ta) phase<br />
is evaluated with the experimental data for the ζ -Ni 8 (Mo, Ta)/ζ -<br />
Ni 8 (Mo, Ta)+fcc phase boundary [28]. The ternary parameters<br />
G µ Ta:Ta:Mo:Ni <strong>and</strong> 0 L µ Ta:Ta:Mo,Ta:Ni<br />
for the µ phase are evaluated with<br />
the first-principles data in Table 6 <strong>and</strong> experimental data [9,27].<br />
4. Modeling results<br />
The Ni–Ta phase diagram yielded by our modeling is shown in<br />
Fig. 1 together with previously proposed phase diagrams [6,7] <strong>and</strong>


