The Smart Beta 2.0 Approach - EDHEC-Risk
The Smart Beta 2.0 Approach - EDHEC-Risk
The Smart Beta 2.0 Approach - EDHEC-Risk

You also want an ePaper? Increase the reach of your titles
YUMPU automatically turns print PDFs into web optimized ePapers that Google loves.
18<br />
An ERI Scientific <strong>Beta</strong> Publication — <strong>Smart</strong> <strong>Beta</strong> <strong>2.0</strong> — April 2013<br />
Copyright © 2013 ERI Scientific <strong>Beta</strong>. All rights reserved. Please refer to the disclaimer at the end of this document.<br />
1. <strong>The</strong> <strong>Risk</strong>s of <strong>Smart</strong> <strong>Beta</strong> Strategies<br />
could outperform in the back-tests proposed simply because the methodological choices, and<br />
notably the appreciation of the economic size of the firms, led to the avoidance of large-cap stocks<br />
of small economic size 15 , such as the Internet stocks. Reasoning in that way in 2003, publication<br />
date of the first articles justifying fundamental indexation (Wood and Evans, 2003), was probably<br />
easier than in 1999! In the same way, constructing a value bias through the design of economic<br />
size measurement parameters will enable good historical performances to be shown over the long<br />
term, since it has been shown that value stocks, because they are exposed to particular risks (see<br />
e.g. Petkova and Zhang, 2005), outperform growth stocks, which are more strongly represented in<br />
cap-weighted indices. Naturally, this empirical evidence gives no indication of the out-of-sample<br />
robustness of the fundamental strategy 16 . In order to assess the out-of-sample robustness of a<br />
fundamentals-based strategy, we look at the role that the burst of the internet bubble had on<br />
fundamentals-based portfolio construction approaches.<br />
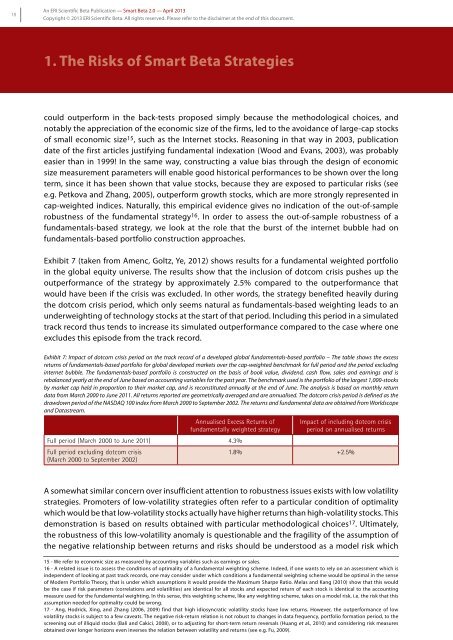
Exhibit 7 (taken from Amenc, Goltz, Ye, 2012) shows results for a fundamental weighted portfolio<br />
in the global equity universe. <strong>The</strong> results show that the inclusion of dotcom crisis pushes up the<br />
outperformance of the strategy by approximately 2.5% compared to the outperformance that<br />
would have been if the crisis was excluded. In other words, the strategy benefited heavily during<br />
the dotcom crisis period, which only seems natural as fundamentals-based weighting leads to an<br />
underweighting of technology stocks at the start of that period. Including this period in a simulated<br />
track record thus tends to increase its simulated outperformance compared to the case where one<br />
excludes this episode from the track record.<br />
Exhibit 7: Impact of dotcom crisis period on the track record of a developed global fundamentals-based portfolio – <strong>The</strong> table shows the excess<br />
returns of fundamentals-based portfolio for global developed markets over the cap-weighted benchmark for full period and the period excluding<br />
internet bubble. <strong>The</strong> fundamentals-based portfolio is constructed on the basis of book value, dividend, cash flow, sales and earnings and is<br />
rebalanced yearly at the end of June based on accounting variables for the past year. <strong>The</strong> benchmark used is the portfolio of the largest 1,000-stocks<br />
by market cap held in proportion to their market cap, and is reconstituted annually at the end of June. <strong>The</strong> analysis is based on monthly return<br />
data from March 2000 to June 2011. All returns reported are geometrically averaged and are annualised. <strong>The</strong> dotcom crisis period is defined as the<br />
drawdown period of the NASDAQ 100 index from March 2000 to September 2002. <strong>The</strong> returns and fundamental data are obtained from Worldscope<br />
and Datastream.<br />
Annualised Excess Returns of<br />
fundamentally weighted strategy<br />
Full period (March 2000 to June 2011) 4.3%<br />
Full period excluding dotcom crisis<br />
(March 2000 to September 2002)<br />
Impact of including dotcom crisis<br />
period on annualised returns<br />
1.8% +2.5%<br />
A somewhat similar concern over insufficient attention to robustness issues exists with low volatility<br />
strategies. Promoters of low-volatility strategies often refer to a particular condition of optimality<br />
which would be that low-volatility stocks actually have higher returns than high-volatility stocks. This<br />
demonstration is based on results obtained with particular methodological choices 17 . Ultimately,<br />
the robustness of this low-volatility anomaly is questionable and the fragility of the assumption of<br />
the negative relationship between returns and risks should be understood as a model risk which<br />
15 - We refer to economic size as measured by accounting variables such as earnings or sales.<br />
16 - A related issue is to assess the conditions of optimality of a fundamental weighting scheme. Indeed, if one wants to rely on an assessment which is<br />
independent of looking at past track records, one may consider under which conditions a fundamental weighting scheme would be optimal in the sense<br />
of Modern Portfolio <strong>The</strong>ory, that is under which assumptions it would provide the Maximum Sharpe Ratio. Melas and Kang (2010) show that this would<br />
be the case if risk parameters (correlations and volatilities) are identical for all stocks and expected return of each stock is identical to the accounting<br />
measure used for the fundamental weighting. In this sense, this weighting scheme, like any weighting scheme, takes on a model risk, i.e. the risk that this<br />
assumption needed for optimality could be wrong.<br />
17 - Ang, Hodrick, Xing, and Zhang (2006, 2009) find that high idiosyncratic volatility stocks have low returns. However, the outperformance of low<br />
volatility stocks is subject to a few caveats. <strong>The</strong> negative risk-return relation is not robust to changes in data frequency, portfolio formation period, to the<br />
screening out of illiquid stocks (Bali and Cakici, 2008), or to adjusting for short-term return reversals (Huang et al., 2010) and considering risk measures<br />
obtained over longer horizons even inverses the relation between volatility and returns (see e.g. Fu, 2009).