The Smart Beta 2.0 Approach - EDHEC-Risk
The Smart Beta 2.0 Approach - EDHEC-Risk
The Smart Beta 2.0 Approach - EDHEC-Risk

Create successful ePaper yourself
Turn your PDF publications into a flip-book with our unique Google optimized e-Paper software.
30<br />
An ERI Scientific <strong>Beta</strong> Publication — <strong>Smart</strong> <strong>Beta</strong> <strong>2.0</strong> — April 2013<br />
Copyright © 2013 ERI Scientific <strong>Beta</strong>. All rights reserved. Please refer to the disclaimer at the end of this document.<br />
2. Controlling the <strong>Risk</strong>s of <strong>Smart</strong> <strong>Beta</strong> Investing:<br />
<strong>The</strong> <strong>Smart</strong> <strong>Beta</strong> <strong>2.0</strong> <strong>Approach</strong><br />
risk budget with respect to cap-weighted indices should be proportional on the one hand to<br />
the knowledge that the stakeholders have of the <strong>Smart</strong> <strong>Beta</strong> concept, and on the other, to the<br />
confidence that the CIO has in his <strong>Smart</strong> <strong>Beta</strong> choices.<br />
In this context, controlling the tracking error and the choice of stocks in the indices is ultimately<br />
an essential tool for managing the systematic risks of these new indices. In an article published in<br />
the Spring 2012 issue of the Journal of Portfolio Management (Amenc, Goltz, Lodh and Martellini,<br />
2012), we were able to show that using a suitably designed relative risk control approach, it is<br />
possible to obtain a reliable control of both the average tracking error and the extreme tracking<br />
error of <strong>Smart</strong> <strong>Beta</strong> strategies. This approach involves an alignment of the risks of the <strong>Smart</strong> <strong>Beta</strong><br />
benchmark with those of the cap-weighted index. In addition to achieving a very effective control<br />
of the tracking error, such an approach maintains overall significant potential for outperformance<br />
of the <strong>Smart</strong> <strong>Beta</strong> investment.<br />
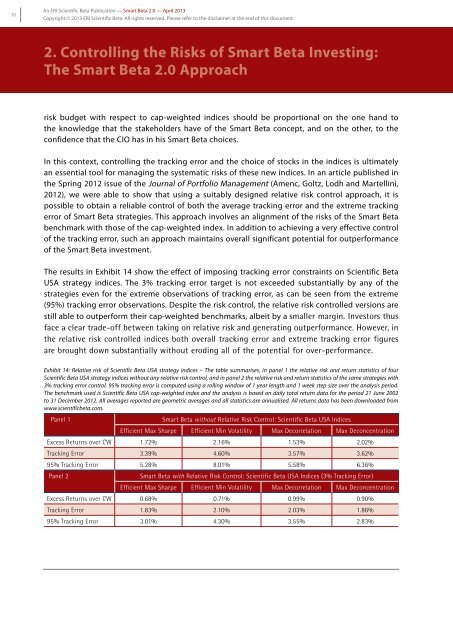
<strong>The</strong> results in Exhibit 14 show the effect of imposing tracking error constraints on Scientific <strong>Beta</strong><br />
USA strategy indices. <strong>The</strong> 3% tracking error target is not exceeded substantially by any of the<br />
strategies even for the extreme observations of tracking error, as can be seen from the extreme<br />
(95%) tracking error observations. Despite the risk control, the relative risk controlled versions are<br />
still able to outperform their cap-weighted benchmarks, albeit by a smaller margin. Investors thus<br />
face a clear trade-off between taking on relative risk and generating outperformance. However, in<br />
the relative risk controlled indices both overall tracking error and extreme tracking error figures<br />
are brought down substantially without eroding all of the potential for over-performance.<br />
Exhibit 14: Relative risk of Scientific <strong>Beta</strong> USA strategy indices – <strong>The</strong> table summarises, in panel 1 the relative risk and return statistics of four<br />
Scientific <strong>Beta</strong> USA strategy indices without any relative risk control, and in panel 2 the relative risk and return statistics of the same strategies with<br />
3% tracking error control. 95% tracking error is computed using a rolling window of 1 year length and 1 week step size over the analysis period.<br />
<strong>The</strong> benchmark used is Scientific <strong>Beta</strong> USA cap-weighted index and the analysis is based on daily total return data for the period 21 June 2002<br />
to 31 December 2012. All averages reported are geometric averages and all statistics are annualised. All returns data has been downloaded from<br />
www.scientificbeta.com.<br />
Panel 1<br />
<strong>Smart</strong> <strong>Beta</strong> without Relative <strong>Risk</strong> Control: Scientific <strong>Beta</strong> USA Indices<br />
Efficient Max Sharpe Efficient Min Volatility Max Decorrelation Max Deconcentration<br />
Excess Returns over CW 1.72% 2.16% 1.53% <strong>2.0</strong>2%<br />
Tracking Error 3.39% 4.60% 3.57% 3.62%<br />
95% Tracking Error 5.28% 8.01% 5.58% 6.36%<br />
Panel 2<br />
<strong>Smart</strong> <strong>Beta</strong> with Relative <strong>Risk</strong> Control: Scientific <strong>Beta</strong> USA Indices (3% Tracking Error)<br />
Efficient Max Sharpe Efficient Min Volatility Max Decorrelation Max Deconcentration<br />
Excess Returns over CW 0.68% 0.71% 0.99% 0.90%<br />
Tracking Error 1.83% 2.10% <strong>2.0</strong>3% 1.86%<br />
95% Tracking Error 3.01% 4.30% 3.55% 2.83%