The Smart Beta 2.0 Approach - EDHEC-Risk
The Smart Beta 2.0 Approach - EDHEC-Risk
The Smart Beta 2.0 Approach - EDHEC-Risk

Create successful ePaper yourself
Turn your PDF publications into a flip-book with our unique Google optimized e-Paper software.
22<br />
An ERI Scientific <strong>Beta</strong> Publication — <strong>Smart</strong> <strong>Beta</strong> <strong>2.0</strong> — April 2013<br />
Copyright © 2013 ERI Scientific <strong>Beta</strong>. All rights reserved. Please refer to the disclaimer at the end of this document.<br />
2. Controlling the <strong>Risk</strong>s of <strong>Smart</strong> <strong>Beta</strong> Investing:<br />
<strong>The</strong> <strong>Smart</strong> <strong>Beta</strong> <strong>2.0</strong> <strong>Approach</strong><br />
<strong>The</strong> second generation of <strong>Smart</strong> <strong>Beta</strong> clearly addresses the problem of measuring and controlling<br />
the risks of these new forms of indices. Even though the majority of <strong>Smart</strong> <strong>Beta</strong> indices have a<br />
strong probability of outperforming cap-weighted indices over the long term because of the high<br />
level of concentration of the latter, it should be noted that through their exposure to sources of<br />
risk that are different from those of cap-weighted indices, these new benchmarks can sometimes<br />
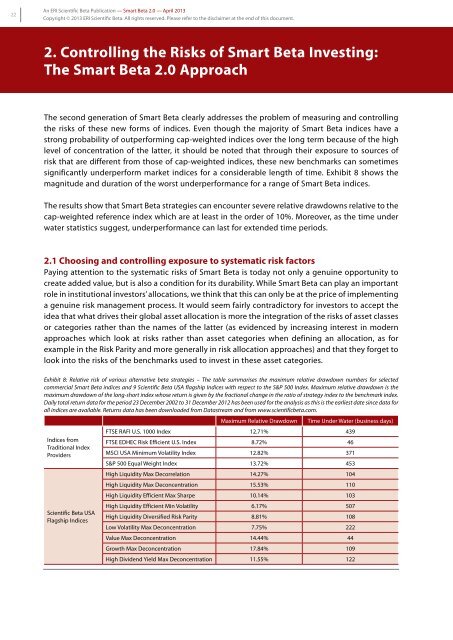
significantly underperform market indices for a considerable length of time. Exhibit 8 shows the<br />
magnitude and duration of the worst underperformance for a range of <strong>Smart</strong> <strong>Beta</strong> indices.<br />
<strong>The</strong> results show that <strong>Smart</strong> <strong>Beta</strong> strategies can encounter severe relative drawdowns relative to the<br />
cap-weighted reference index which are at least in the order of 10%. Moreover, as the time under<br />
water statistics suggest, underperformance can last for extended time periods.<br />
2.1 Choosing and controlling exposure to systematic risk factors<br />
Paying attention to the systematic risks of <strong>Smart</strong> <strong>Beta</strong> is today not only a genuine opportunity to<br />
create added value, but is also a condition for its durability. While <strong>Smart</strong> <strong>Beta</strong> can play an important<br />
role in institutional investors’ allocations, we think that this can only be at the price of implementing<br />
a genuine risk management process. It would seem fairly contradictory for investors to accept the<br />
idea that what drives their global asset allocation is more the integration of the risks of asset classes<br />
or categories rather than the names of the latter (as evidenced by increasing interest in modern<br />
approaches which look at risks rather than asset categories when defining an allocation, as for<br />
example in the <strong>Risk</strong> Parity and more generally in risk allocation approaches) and that they forget to<br />
look into the risks of the benchmarks used to invest in these asset categories.<br />
Exhibit 8: Relative risk of various alternative beta strategies – <strong>The</strong> table summarises the maximum relative drawdown numbers for selected<br />
commercial <strong>Smart</strong> <strong>Beta</strong> indices and 9 Scientific <strong>Beta</strong> USA flagship Indices with respect to the S&P 500 Index. Maximum relative drawdown is the<br />
maximum drawdown of the long-short index whose return is given by the fractional change in the ratio of strategy index to the benchmark index.<br />
Daily total return data for the period 23 December 2002 to 31 December 2012 has been used for the analysis as this is the earliest date since data for<br />
all indices are available. Returns data has been downloaded from Datastream and from www.scientificbeta.com.<br />
Indices from<br />
Traditional Index<br />
Providers<br />
Scientific <strong>Beta</strong> USA<br />
Flagship Indices<br />
Maximum Relative Drawdown Time Under Water (business days)<br />
FTSE RAFI U.S. 1000 Index 12.71% 439<br />
FTSE <strong>EDHEC</strong> <strong>Risk</strong> Efficient U.S. Index 8.72% 46<br />
MSCI USA Minimum Volatility Index 12.82% 371<br />
S&P 500 Equal Weight Index 13.72% 453<br />
High Liquidity Max Decorrelation 14.27% 104<br />
High Liquidity Max Deconcentration 15.53% 110<br />
High Liquidity Efficient Max Sharpe 10.14% 103<br />
High Liquidity Efficient Min Volatility 6.17% 507<br />
High Liquidity Diversified <strong>Risk</strong> Parity 8.81% 108<br />
Low Volatility Max Deconcentration 7.75% 222<br />
Value Max Deconcentration 14.44% 44<br />
Growth Max Deconcentration 17.84% 109<br />
High Dividend Yield Max Deconcentration 11.55% 122