The Smart Beta 2.0 Approach - EDHEC-Risk
The Smart Beta 2.0 Approach - EDHEC-Risk
The Smart Beta 2.0 Approach - EDHEC-Risk
You also want an ePaper? Increase the reach of your titles
YUMPU automatically turns print PDFs into web optimized ePapers that Google loves.
38<br />
An ERI Scientific <strong>Beta</strong> Publication — <strong>Smart</strong> <strong>Beta</strong> <strong>2.0</strong> — April 2013<br />
Copyright © 2013 ERI Scientific <strong>Beta</strong>. All rights reserved. Please refer to the disclaimer at the end of this document.<br />
Appendix: Overview of <strong>Smart</strong> <strong>Beta</strong> Equity Portfolios<br />
(this is sometimes called the 1/N rule). For example, an equal-weighted version of the<br />
S&P 500 would use the same 500 constituents as the cap-weighted version of the index<br />
but it attributes an equal weight of 0.2% to each constituent. <strong>The</strong>se equal-weighted<br />
benchmarks are attractive because they avoid the concentration and trend-following of capweighted<br />
indices and typically lead to higher Sharpe ratios compared to their cap-weighted<br />
counterparts (DeMiguel, Garlappi and Uppal, 2009, Platen and Rendek, 2010). However,<br />
for investors to adopt an equal weighting scheme is an extreme stance since it implies that they<br />
would accept to give up on any form of fundamental or statistical analysis to gather useful insights<br />
about the stocks’ characteristics. In fact, the equal-weighted portfolio would have the highest<br />
possible Sharpe ratio if and only if pairwise correlations, volatilities and expected returns were<br />
identical for all stocks.<br />
Equal-weighting is a simple way of “de-concentrating” a portfolio and allows us to benefit from<br />
systematic rebalancing back to fixed weights. Depending on the universe and on whether<br />
additional implementation rules are used, the rebalancing feature of equal-weighting can be<br />
associated with relatively high turnover and liquidity problems. Maximum Deconcentration<br />
can be perceived as a generalisation of a simple equal weighting scheme, the aim being to<br />
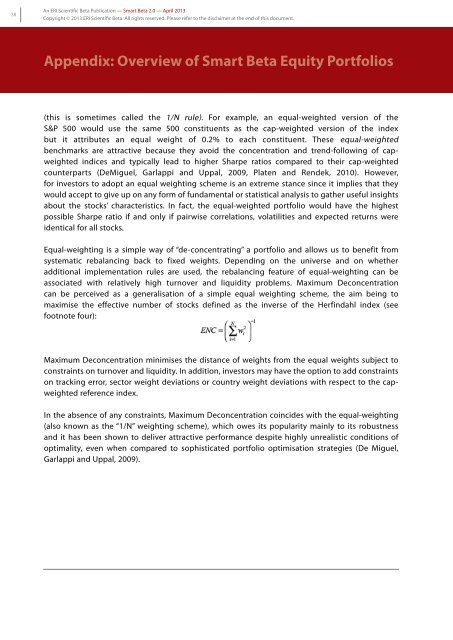
maximise the effective number of stocks defined as the inverse of the Herfindahl index (see<br />
footnote four):<br />
Maximum Deconcentration minimises the distance of weights from the equal weights subject to<br />
constraints on turnover and liquidity. In addition, investors may have the option to add constraints<br />
on tracking error, sector weight deviations or country weight deviations with respect to the capweighted<br />
reference index.<br />
In the absence of any constraints, Maximum Deconcentration coincides with the equal-weighting<br />
(also known as the “1/N” weighting scheme), which owes its popularity mainly to its robustness<br />
and it has been shown to deliver attractive performance despite highly unrealistic conditions of<br />
optimality, even when compared to sophisticated portfolio optimisation strategies (De Miguel,<br />
Garlappi and Uppal, 2009).


