- Page 1 and 2:
AFRICA WATER ATLAS i
- Page 3 and 4:
Table of Contents Foreword ........
- Page 5 and 6:
Foreword The Millennium Declaration
- Page 7 and 8:
Preface Since Africa’s water reso
- Page 9 and 10:
Statement from H.E. Jean Ping Chair
- Page 11 and 12:
93 per cent of its total surface wa
- Page 13 and 14:
We never know the worth of water ti
- Page 15 and 16:
Figure i: Annual water balance is a
- Page 17 and 18:
Eugene Apindi Ochieng Eugene Apindi
- Page 19 and 20:
Several of Africa’s transboundary
- Page 21 and 22:
Figure v-b: By 2009, several additi
- Page 23 and 24:
Figure vii: Katse Dam site Figure v
- Page 25 and 26:
In Africa, the world’s second-dri
- Page 27 and 28:
Key Facts Renewable water resources
- Page 29 and 30:
Figure 1.1: Total renewable water r
- Page 31 and 32:
Mukundi Mutasa Key Facts Africa’s
- Page 33 and 34:
International Rivers Dams There is
- Page 35 and 36:
Estuaries Estuaries are special typ
- Page 37 and 38:
Key Facts Africa’s climate is cha
- Page 39 and 40:
Africa’s Biomes Key Facts Arid la
- Page 41 and 42:
Figure 1.10: Selected demographic i
- Page 43 and 44:
overconsumption of water resources.
- Page 45 and 46:
Table 1.8 Examples of ecosystem ser
- Page 47 and 48:
FAO. (2009). AQUASTAT database. Foo
- Page 49 and 50:
Water systems occur at many scales
- Page 51 and 52:
Figure 2.1: Africa’s major transb
- Page 53 and 54:
The Congo River runs 4 670 km in a
- Page 55 and 56:
potential but fell into disrepair o
- Page 57 and 58:
In most years, the Shabelle’s dis
- Page 59 and 60:
Lake Chad is among the largest fres
- Page 61 and 62:
irrigation that draws water from th
- Page 63 and 64:
5151
- Page 65 and 66:
Figure 2.4.10: Damming of the Logon
- Page 67 and 68:
Lake Turkana is the largest desert
- Page 69 and 70:
Figure 2.5.4: The Gibe III dam was
- Page 71 and 72:
The streamflow of the Limpopo is va
- Page 73 and 74:
The Niger River sustains an island
- Page 75 and 76:
Figure 2.7.4: Dams in the Upper Nig
- Page 77 and 78:
a small pond for a few years during
- Page 79 and 80:
and services, including a productiv
- Page 81 and 82:
Sosialistick Ungdom/Flickr.com syst
- Page 83 and 84:
7171
- Page 85 and 86:
Figure 2.8.1 Nile Basin population
- Page 87 and 88:
Dams, Irrigation and Water Agreemen
- Page 89 and 90:
Figure 2.8.8: Tekezê Dam site, bef
- Page 91 and 92:
B A 2006, IR n.d., UN News Centre 2
- Page 93 and 94:
Figure 2.8.12: Wet season and dry s
- Page 95 and 96:
CPWF Basin Focal Project/Flickr.com
- Page 97 and 98:
Case Study: Coastal Erosion and the
- Page 99 and 100:
Much of the basin’s population is
- Page 101 and 102:
There are no major dams on the Okav
- Page 103 and 104:
While only three per cent of the ba
- Page 105 and 106:
The river’s transboundary nature
- Page 107 and 108:
in the delta area. In both cases, p
- Page 109 and 110:
Figure 2.12.8: Years of drought and
- Page 111 and 112:
The Volta Basin lies across parts o
- Page 113 and 114:
Over 40 million people make their h
- Page 115 and 116:
Ryan Hoover/International Rivers Ca
- Page 117 and 118:
seasonal flooding following the dam
- Page 119 and 120:
affected by recurrent drought. Afri
- Page 121 and 122:
Nubian Sandstone Aquifer The Nubian
- Page 123 and 124:
Figure 2.16.4: Nubian Sandstone Aqu
- Page 125 and 126:
Gordontour/Flickr.com The Great Man
- Page 127 and 128:
Figure 2.17.1: North-Western Sahara
- Page 129 and 130:
Figure 2.19.1: Southeast Kalahari K
- Page 131 and 132:
Figure 2.21.1: Map of Tano Groundwa
- Page 133 and 134:
Kiwango, Y. and Wolanski, E. (2008)
- Page 135 and 136:
Improving the Quantity, Quality and
- Page 137 and 138:
CHALLENGE 1 PROVIDE SAFE DRINKING W
- Page 139 and 140:
US Marine Corps./Flickr.com challen
- Page 141 and 142:
CHALLENGE 2 ENSURE ACCESS TO ADEQUA
- Page 143 and 144:
Kuritita/Flickr.com chronic under-f
- Page 145 and 146:
CHALLENGE 3 FOSTER COOPERATION IN T
- Page 147 and 148:
Catherine Murray/Flickr.com there i
- Page 149 and 150:
CHALLENGE 4 PROVIDE WATER FOR FOOD
- Page 151 and 152:
Figure 3.4.3 Proportion of arable l
- Page 153 and 154:
• Invest in simple and inexpensiv
- Page 155 and 156:
CHALLENGE 5 DEVELOP HYDROPOWER TO E
- Page 157 and 158:
destroyed by war in countries such
- Page 159 and 160:
Table 3.5.1: Overview of proposed h
- Page 161 and 162:
Box 3.5.2. Regional power pools and
- Page 163 and 164:
CHALLENGE 6 MEET GROWING WATER DEMA
- Page 165 and 166:
Mike Blyth/Flickr.com are charged f
- Page 167 and 168:
CHALLENGE 7 PREVENT LAND DEGRADATIO
- Page 169 and 170:
Figure 3.7.2: Dry and wet seasons i
- Page 171 and 172:
Box 3.7.1: Environmental reserves i
- Page 173 and 174:
CHALLENGE 8 MANAGE WATER UNDER GLOB
- Page 175 and 176:
Box 3.8.2: Late-twentieth-century w
- Page 177 and 178:
Figure 3.8.2: Number of people kill
- Page 179 and 180:
ILRI/Flickr.com • Population grow
- Page 181 and 182: CHALLENGE 9 ENHANCE CAPACITY TO ADD
- Page 183 and 184: policy and strategy reforms and set
- Page 185 and 186: 6. Meet Growing Water Demand AfDB.
- Page 187 and 188: Tracking Progress Towards Environme
- Page 189 and 190: Access to Improved Drinking Water G
- Page 191 and 192: Pierre Holtz/UNICEF In Africa, half
- Page 193 and 194: Rural-Urban Disparities Access to I
- Page 195 and 196: Percentage of urban population usin
- Page 197 and 198: Worldwide, women shoulder the large
- Page 199 and 200: CAPE VERDE Praia GAMBIA GUINEA- BIS
- Page 201 and 202: Industrial Water Pollution Algeria
- Page 203 and 204: Vulnerability of the Nile Delta to
- Page 205 and 206: Water Scarcity and Virtual Water Li
- Page 207 and 208: Curt Carnemark / World Bank wastewa
- Page 209 and 210: Erik Hersman/Flickr.com Water-Relat
- Page 211 and 212: Unsustainable Exploitation of Aquif
- Page 213 and 214: CAPE VERDE Praia GAMBIA GUINEA- BIS
- Page 215 and 216: D Proffer/Flickr.com Degradation of
- Page 217 and 218: Climate-change Impacts on Water Ava
- Page 219 and 220: Carsten/Flickr.com Water Stress and
- Page 221 and 222: Rural Water and Sanitation Infrastr
- Page 223 and 224: Matt Rudge/Flickr.com Endemic Droug
- Page 225 and 226: _Julien Harneisr/Flickr.com Water P
- Page 227 and 228: Civil Unrest and Water Access Two d
- Page 229 and 230: Drought Since 1960, Uganda has expe
- Page 231: WESTERN SAHARA Rabat MOROCCO ALGERI
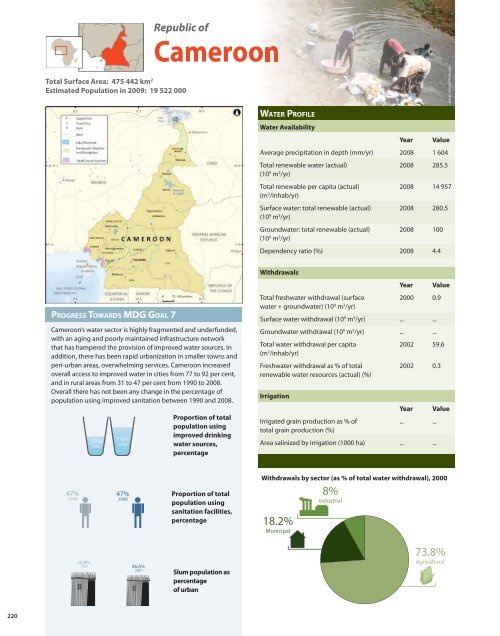
- Page 235 and 236: HDPTCAR Civil Unrest Affecting Wate
- Page 237 and 238: Afcone/Flickr.com Drought and Food
- Page 239 and 240: Julien Harneis/Flickr.com Populatio
- Page 241 and 242: Julien Harneis/Flickr.com Displacem
- Page 243 and 244: Flickr.com Water Access Despite hav
- Page 245 and 246: Urban Water Access and Pollution Wi
- Page 247 and 248: Maria Cartas/Flickr.com Water Pollu
- Page 249 and 250: WESTERN SAHARA Rabat MOROCCO ALGERI
- Page 251 and 252: Sand Mining Benin’s 125-km coastl
- Page 253 and 254: Climate Variability and Water Scarc
- Page 255 and 256: Richard Leeming/Flickr.com Unsustai
- Page 257 and 258: Threats to Aquaculture Production f
- Page 259 and 260: Wetland Degradation An estimated 20
- Page 261 and 262: lepetitNicolas/Flickr.com Degradati
- Page 263 and 264: Taking Advantage of Hydropower Pote
- Page 265 and 266: Contaminated Water Supplies in Biss
- Page 267 and 268: Slums and Access to Sanitation Faci
- Page 269 and 270: Bob Rayner/Flickr.com Drought, Dese
- Page 271 and 272: Phytoplankton blooms (Source: NASA
- Page 273 and 274: Foxc Photography/Flickr.com Access
- Page 275 and 276: Degradation of Hadejia-Nguru Wetlan
- Page 277 and 278: About Skorasaurus /Flickr.com Publi
- Page 279 and 280: Hydroelectric Power Potential Sierr
- Page 281 and 282: Travelling Pooh/Flickr.com Threats
- Page 283 and 284:
CAPE VERDE Praia GAMBIA GUINEA- BIS
- Page 285 and 286:
Under-developed Irrigation Potentia
- Page 287 and 288:
Michael Gorey/Flickr.com Water Avai
- Page 289 and 290:
John Pannell/Flicrk.com Water Scarc
- Page 291 and 292:
Paul Shaffner/Flicrk.com Water-rela
- Page 293 and 294:
Urban and Rural Water and Sanitatio
- Page 295 and 296:
Rui Ornelas/Flickr.com Water Scarci
- Page 297 and 298:
World Bank Water Supply Shortage Po
- Page 299 and 300:
Oxfam International/Flickr.com Resp
- Page 301 and 302:
Sustainable Sanitation/Flickr.com L
- Page 303 and 304:
Altered Flood Regime in the Kafue R
- Page 305 and 306:
Water-related Diseases Sokwanele/Fl
- Page 307 and 308:
CAPE VERDE Praia GAMBIA GUINEA- BIS
- Page 309 and 310:
Water Contamination from Volcanic E
- Page 311 and 312:
Drought in Southern Madagascar Desp
- Page 313 and 314:
Mootoosamy Olivier Daren/Flickr.com
- Page 315 and 316:
Water Availability and Storage The
- Page 317 and 318:
Central African Republic IDMC. (201
- Page 319 and 320:
UN-Water. (2008). National Investme
- Page 321 and 322:
Glossary Agro-pastoral Anthropogeni
- Page 323 and 324:
Acknowledgement Production and Edit
- Page 325 and 326:
H Hadejia-Nguru Wetland, Nigeria 26


