Planning for Climate Change - UN-Habitat
Planning for Climate Change - UN-Habitat
Planning for Climate Change - UN-Habitat

You also want an ePaper? Increase the reach of your titles
YUMPU automatically turns print PDFs into web optimized ePapers that Google loves.
Introduction<br />
the next 20 years. Paired with an increase in wealth, this population increase will have<br />
major impacts on emissions through urban expansion and redevelopment, increases in<br />
individual car ownership, changes in settlement patterns and pressures on municipal<br />
infrastructure. Global growth in GHG emissions will likely occur primarily in the building<br />
and transport sectors in low and middle income countries. Better urban planning and<br />
growth management today will help limit and mitigate future emissions, as well as<br />
increasing the resilience of urban areas to the impacts of climate change.<br />
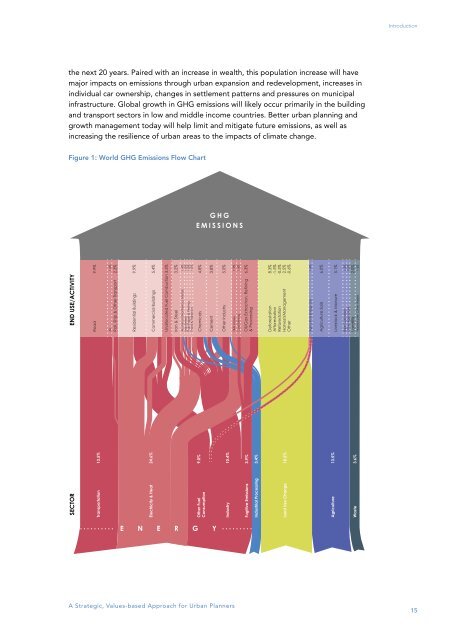
Figure 1: World GHG Emissions Flow Chart<br />
GHG<br />
EMISSIONS<br />
SECTOR END USE/ACTIVITY<br />
Transportation 13.5%<br />
Road 9.9%<br />
Air 1.6%<br />
Rail, Ship & Other Transport 2.3%<br />
Residential Buildings 9.9%<br />
Electricity & Heat 24.6%<br />
Commercial Buildings 5.4%<br />
Unallocated Fuel Combustion 3.5%<br />
Iron & Steel 3.2%<br />
Aluminum/NonFerrous Metals 1.4%<br />
Machinery 1.0%<br />
Pulp Paper & Printing 1.0%<br />
Food & Tobacco 1.0%<br />
Other Fuel 9.0%<br />
Consumption<br />
Chemicals 4.8%<br />
Cement 3.8%<br />
Industry 10.4%<br />
Other Industry 5.0%<br />
T&D Losses 1.9%<br />
Coal Mining 1.4%<br />
Fugitive Emissions 3.9%<br />
Industrial Processing 3.4%<br />
Oil/Gax Extraction, Refining 6.3%<br />
& Processing<br />
Land Use <strong>Change</strong> 18.2%<br />
De<strong>for</strong>estation 8.3%<br />
Af<strong>for</strong>estation -1.5%<br />
Re<strong>for</strong>estation -0.5%<br />
Harvest/Management 2.5%<br />
Other -0.6%<br />
Agriculture Energy Use 1.4%<br />
Agriculture Soils 6.0%<br />
Agriculture 13.5%<br />
Livestock & Manure 5.1%<br />
Ripe Cultivation 1.5%<br />
Other Agriculture 0.5%<br />
Landfills Waste 3.6%<br />
2.0%<br />
Wastewater, 1.6%<br />
Other Waste E N E R G Y<br />
A Strategic, Values-based Approach <strong>for</strong> Urban Planners<br />
15