

EMPLOYMENT IN THE MARKET ECONOMY IN ... - Eurostat - Europa
EMPLOYMENT IN THE MARKET ECONOMY IN ... - Eurostat - Europa
EMPLOYMENT IN THE MARKET ECONOMY IN ... - Eurostat - Europa

You also want an ePaper? Increase the reach of your titles
YUMPU automatically turns print PDFs into web optimized ePapers that Google loves.
Chapter 3 — Labour costs and value-added<br />
The SBS data on labour costs and the LCS<br />
The SBS data on labour costs relate to the cost of personnel employed<br />
in businesses. As such, they include non-wage labour costs — social<br />
contributions paid by employers in particular — as well as wages and<br />
salaries. They are on a similar basis to the data collected as part of the<br />
periodic Labour Cost Survey (LCS), conducted by national statistical<br />
institutes for <strong>Eurostat</strong> every four years, which provide details of the<br />
main components which make up overall labour costs (basic wages,<br />
overtime and other bonuses, non-wage labour costs and so on).<br />
Unlike the LCS, however, the SBS uses the enterprise as the statistical<br />
unit of classification rather than the local unit. This difference in the basis<br />
of classification may mean that the LCS may assign the local units of<br />
an enterprise to a different sector of activity than the enterprise itself, if<br />
their main activity differs from that of the enterprise. While data from<br />
both surveys are disaggregated to the NACE 2-digit level and relate to<br />
the same NACE Rev.1 sectors of activity, the use of local units instead<br />
of enterprises to perform this disaggregation may, therefore, produce<br />
different results. In addition, unlike the SBS, the LCS does not include<br />
enterprises with under 10 people employed, or more precisely, Member<br />
States are not required to cover these in the data collection.<br />
The coverage of employees may also differ in that management staff<br />
and sales representatives, for example, are excluded from the LCS but<br />
may be included in the SBS. It is possible as well that the average number<br />
of employees counted as being in work over the year may vary between<br />
the two sources, especially as regards temporary workers. The<br />
LCS, moreover, includes the cost of training (other than those for apprentices)<br />
and direct subsidies, which are not included in the SBS<br />
data, but both of which tend to be small.<br />
A comparison of average annual labour costs per employee as reported<br />
by the two surveys for 2000 is shown in Table 25.<br />
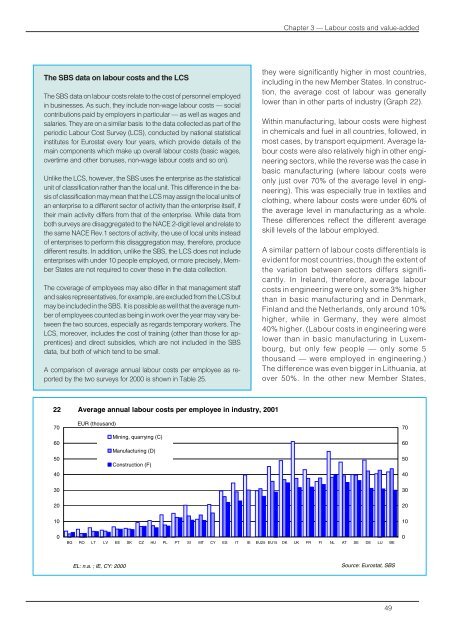
they were significantly higher in most countries,<br />
including in the new Member States. In construction,<br />
the average cost of labour was generally<br />
lower than in other parts of industry (Graph 22).<br />
Within manufacturing, labour costs were highest<br />
in chemicals and fuel in all countries, followed, in<br />
most cases, by transport equipment. Average labour<br />
costs were also relatively high in other engineering<br />
sectors, while the reverse was the case in<br />
basic manufacturing (where labour costs were<br />
only just over 70% of the average level in engineering).<br />
This was especially true in textiles and<br />
clothing, where labour costs were under 60% of<br />
the average level in manufacturing as a whole.<br />
These differences reflect the different average<br />
skill levels of the labour employed.<br />
A similar pattern of labour costs differentials is<br />
evident for most countries, though the extent of<br />
the variation between sectors differs significantly.<br />
In Ireland, therefore, average labour<br />
costs in engineering were only some 3% higher<br />
than in basic manufacturing and in Denmark,<br />
Finland and the Netherlands, only around 10%<br />
higher, while in Germany, they were almost<br />
40% higher. (Labour costs in engineering were<br />
lower than in basic manufacturing in Luxembourg,<br />
but only few people — only some 5<br />
thousand — were employed in engineering.)<br />
The difference was even bigger in Lithuania, at<br />
over 50%. In the other new Member States,<br />
22 Average annual labour costs per employee in industry, 2001<br />
70<br />
60<br />
50<br />
40<br />
EUR (thousand)<br />
Mining, quarrying (C)<br />
Manufacturing (D)<br />
Construction (F)<br />
70<br />
60<br />
50<br />
40<br />
30<br />
30<br />
20<br />
20<br />
10<br />
10<br />
0<br />
BG RO LT LV EE SK CZ HU PL PT SI MT CY ES IT IE EU25 EU15 DK UK FR FI NL AT SE DE LU BE<br />
0<br />
EL: n.a. ; IE, CY: 2000<br />
Source: <strong>Eurostat</strong>, SBS<br />
49


![226. [Augsburg], 27. Oktober 1562 An Joachim Camerarius d. Ã ...](https://img.yumpu.com/27559109/1/184x260/226-augsburg-27-oktober-1562-an-joachim-camerarius-d-a-.jpg?quality=85)