

EMPLOYMENT IN THE MARKET ECONOMY IN ... - Eurostat - Europa
EMPLOYMENT IN THE MARKET ECONOMY IN ... - Eurostat - Europa
EMPLOYMENT IN THE MARKET ECONOMY IN ... - Eurostat - Europa

Create successful ePaper yourself
Turn your PDF publications into a flip-book with our unique Google optimized e-Paper software.
Employment in the market economy in the European Union — an analysis based on the Structural Business Statistics<br />
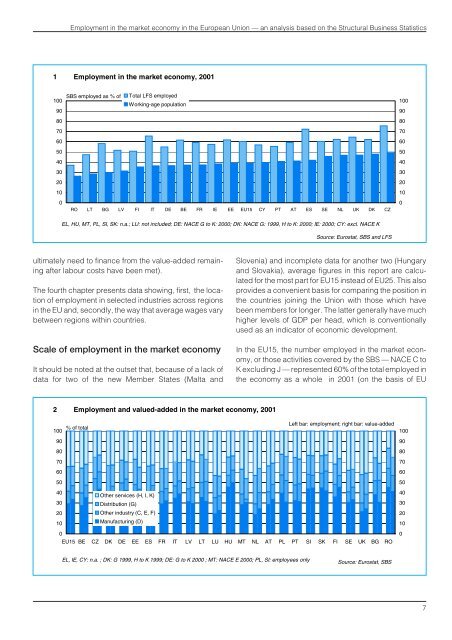
1 Employment in the market economy, 2001<br />
100<br />
90<br />
80<br />
70<br />
60<br />
50<br />
40<br />
30<br />
20<br />
10<br />
0<br />
SBS employed as % of Total LFS employed<br />
Working-age population<br />
RO LT BG LV FI IT DE BE FR IE EE EU15 CY PT AT ES SE NL UK DK CZ<br />
100<br />
90<br />
80<br />
70<br />
60<br />
50<br />
40<br />
30<br />
20<br />
10<br />
0<br />
EL, HU, MT, PL, SI, SK: n.a.; LU: not included; DE: NACE G to K: 2000; DK: NACE G: 1999, H to K: 2000; IE: 2000; CY: excl. NACE K<br />
Source: <strong>Eurostat</strong>, SBS and LFS<br />
ultimately need to finance from the value-added remaining<br />
after labour costs have been met).<br />
The fourth chapter presents data showing, first, the location<br />
of employment in selected industries across regions<br />
in the EU and, secondly, the way that average wages vary<br />
between regions within countries.<br />
Scale of employment in the market economy<br />
It should be noted at the outset that, because of a lack of<br />
data for two of the new Member States (Malta and<br />
Slovenia) and incomplete data for another two (Hungary<br />
and Slovakia), average figures in this report are calculated<br />
for the most part for EU15 instead of EU25. This also<br />
provides a convenient basis for comparing the position in<br />
the countries joining the Union with those which have<br />
been members for longer. The latter generally have much<br />
higher levels of GDP per head, which is conventionally<br />
used as an indicator of economic development.<br />
In the EU15, the number employed in the market economy,<br />
or those activities covered by the SBS — NACE C to<br />
K excluding J — represented 60% of the total employed in<br />
the economy as a whole in 2001 (on the basis of EU<br />
2 Employment and valued-added in the market economy, 2001<br />
Left bar: employment; right bar: value-added<br />
% of total<br />
100<br />
90<br />
80<br />
70<br />
60<br />
50<br />
40<br />
Other services (H, I, K)<br />
30<br />
Distribution (G)<br />
20<br />
Other industry (C, E, F)<br />
10<br />
Manufacturing (D)<br />
0<br />
EU15 BE CZ DK DE EE ES FR IT LV LT LU HU MT NL AT PL PT SI SK FI SE UK BG RO<br />
100<br />
90<br />
80<br />
70<br />
60<br />
50<br />
40<br />
30<br />
20<br />
10<br />
0<br />
EL, IE, CY: n.a. ; DK: G 1999, H to K 1999; DE: G to K 2000 ; MT: NACE E 2000; PL, SI: employees only<br />
Source: <strong>Eurostat</strong>, SBS<br />
7


![226. [Augsburg], 27. Oktober 1562 An Joachim Camerarius d. Ã ...](https://img.yumpu.com/27559109/1/184x260/226-augsburg-27-oktober-1562-an-joachim-camerarius-d-a-.jpg?quality=85)