EFA Goal 1: Early childhood care and education; Asia ... - Unicef
EFA Goal 1: Early childhood care and education; Asia ... - Unicef
EFA Goal 1: Early childhood care and education; Asia ... - Unicef

You also want an ePaper? Increase the reach of your titles
YUMPU automatically turns print PDFs into web optimized ePapers that Google loves.
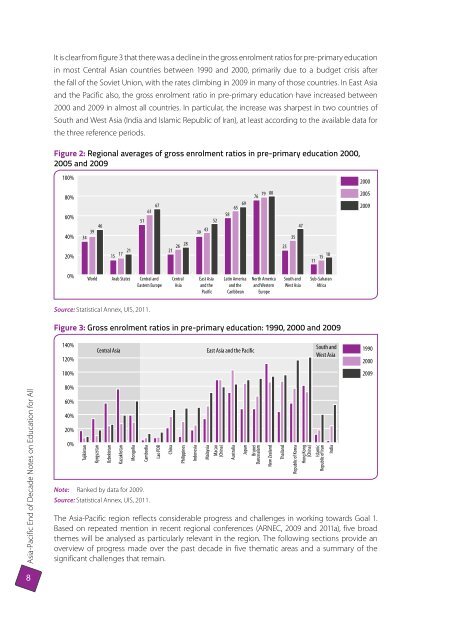
It is clear from figure 3 that there was a decline in the gross enrolment ratios for pre-primary <strong>education</strong><br />
in most Central <strong>Asia</strong>n countries between 1990 <strong>and</strong> 2000, primarily due to a budget crisis after<br />
the fall of the Soviet Union, with the rates climbing in 2009 in many of those countries. In East <strong>Asia</strong><br />
<strong>and</strong> the Pacific also, the gross enrolment ratio in pre-primary <strong>education</strong> have increased between<br />
2000 <strong>and</strong> 2009 in almost all countries. In particular, the increase was sharpest in two countries of<br />
South <strong>and</strong> West <strong>Asia</strong> (India <strong>and</strong> Islamic Republic of Iran), at least according to the available data for<br />
the three reference periods.<br />
Figure 2: Regional averages of gross enrolment ratios in pre-primary <strong>education</strong> 2000,<br />
2005 <strong>and</strong> 2009<br />
100%<br />
2000<br />
80%<br />
60%<br />
40%<br />
20%<br />
34<br />
39<br />
46<br />
15 17 21 51<br />
61<br />
67<br />
21 26 28 39 43 52<br />
58<br />
65 69 76 79 80<br />
25<br />
35<br />
47<br />
11<br />
15<br />
18<br />
2005<br />
2009<br />
0%<br />
World<br />
Arab States<br />
Central <strong>and</strong><br />
Eastern Europe<br />
Central<br />
<strong>Asia</strong><br />
East <strong>Asia</strong><br />
<strong>and</strong> the<br />
Pacific<br />
Latin America<br />
<strong>and</strong> the<br />
Caribbean<br />
North America<br />
<strong>and</strong> Western<br />
Europe<br />
South <strong>and</strong><br />
West <strong>Asia</strong><br />
Sub-Saharan<br />
Africa<br />
Source: Statistical Annex, UIS, 2011.<br />
Figure 3: Gross enrolment ratios in pre-primary <strong>education</strong>: 1990, 2000 <strong>and</strong> 2009<br />
140%<br />
120%<br />
Central <strong>Asia</strong><br />
East <strong>Asia</strong> <strong>and</strong> the Pacific<br />
South <strong>and</strong><br />
West <strong>Asia</strong><br />
1990<br />
2000<br />
100%<br />
2009<br />
<strong>Asia</strong>-Pacific End of Decade Notes on Education for All<br />
80%<br />
60%<br />
40%<br />
20%<br />
0%<br />
Tajikistan<br />
Kyrgyzstan<br />
Uzbekistan<br />
Kazakhstan<br />
Mongolia<br />
Note: Ranked by data for 2009.<br />
Cambodia<br />
Source: Statistical Annex, UIS, 2011.<br />
Lao PDR<br />
China<br />
Philippines<br />
Indonesia<br />
Malaysia<br />
Macao<br />
(China)<br />
The <strong>Asia</strong>-Pacific region reflects considerable progress <strong>and</strong> challenges in working towards <strong>Goal</strong> 1.<br />
Based on repeated mention in recent regional conferences (ARNEC, 2009 <strong>and</strong> 2011a), five broad<br />
themes will be analysed as particularly relevant in the region. The following sections provide an<br />
overview of progress made over the past decade in five thematic areas <strong>and</strong> a summary of the<br />
significant challenges that remain.<br />
Australia<br />
Japan<br />
Brunei<br />
Darussalam<br />
New Zeal<strong>and</strong><br />
Thail<strong>and</strong><br />
Republic of Korea<br />
Hong Kong<br />
(China)<br />
Islamic<br />
Republic of Iran<br />
India<br />
8