New Style Guide Universal - ELSINCO
New Style Guide Universal - ELSINCO
New Style Guide Universal - ELSINCO

Create successful ePaper yourself
Turn your PDF publications into a flip-book with our unique Google optimized e-Paper software.
Evaluate the Quality of the Modulation from<br />
the CDMA Base Station<br />
cdmaOne and CDMA2000 1xRTT Demodulator (Option 43)<br />
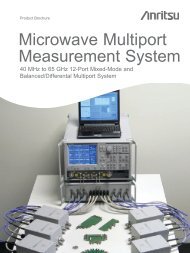
Demodulator measurements are used to measure the code domain power in both graphical and tabular forms.<br />
The following sets of measurements help the technician evaluate the quality of the modulation from the CDMA base station.<br />
CDMA Code Domain Power measurement<br />
display<br />
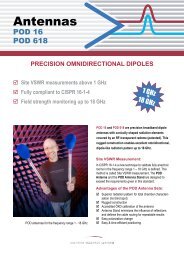
cdmaOne and CDMA2000 1xRTT Over The Air (Option 33)<br />
Over The Air Measurement provides a cost effective way to identify base station performance problems before they<br />
become catastrophic without taking the base station off the air. Traditionally, technicians had to bring down the sector or site<br />
to test the base station performance. Now technicians can sit in a vehicle and make these measurements. For accurate<br />
measurements over the air, a GPS antenna should be used to provide a timing reference.<br />
CDMA Over the Air measurement display<br />
CDP<br />
The Code Domain Power measurement displays the power of the various<br />
demodulated codes (display is automatically bit reversed if Walsh Codes are set<br />
to 128). Rho, Frequency Error, Average Noise Floor and Tau are numerical<br />
values that are calculated and displayed. A zoom view of 16, 32 or 64 codes<br />
is also seen. Markers can be turned on to display the code power and code type.<br />
CDP Table<br />
This measurement displays all the active codes in a color coded tabular<br />
format.<br />
Pilot Scan<br />
The strongest nine received PNs are displayed as bar graphs, and the PN<br />
numbers are displayed at the bottom of the bar graphs. For each PN, a table<br />
displays PN number, Ec/Io, and Tau. Also shown are Pilot Power, Channel<br />
Power, and Pilot Dominance.<br />
MultiPath<br />
The strongest six paths are displayed. For each path, a table below the bar<br />
graph displays Ec/Io and Tau. Also shown are Channel Power and Multipath<br />
Power.<br />
13