Changes in zooxanthellae density, morphology, and mitotic index in ...
Changes in zooxanthellae density, morphology, and mitotic index in ...
Changes in zooxanthellae density, morphology, and mitotic index in ...

Create successful ePaper yourself
Turn your PDF publications into a flip-book with our unique Google optimized e-Paper software.
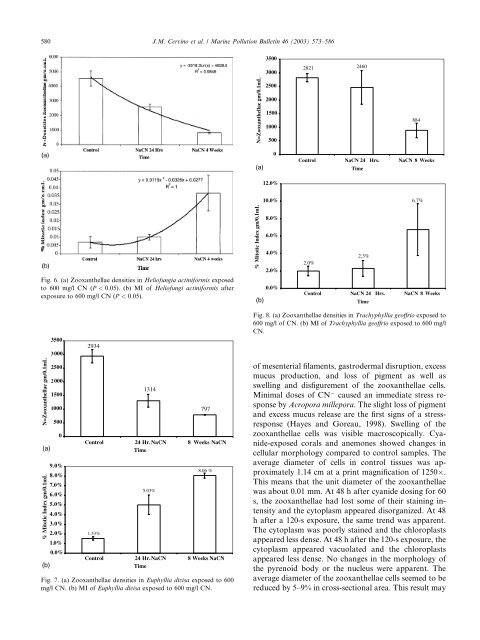
580 J.M. Cerv<strong>in</strong>o et al. / Mar<strong>in</strong>e Pollution Bullet<strong>in</strong> 46 (2003) 573–586<br />
Fig. 6. (a) Zooxanthellae densities <strong>in</strong> Heliofungia act<strong>in</strong>iformis exposed<br />
to 600 mg/l CN (P < 0:05). (b) MI of Heliofungi act<strong>in</strong>iformis after<br />
exposure to 600 mg/l CN (P < 0:05).<br />
% Mitotic Index gm/0.1mL N=Zooxanthellae gm/0.1mL<br />
(a)<br />
(b)<br />
3500<br />
3000<br />
2500<br />
2000<br />
1500<br />
1000<br />
500<br />
0<br />
12.0%<br />
10.0%<br />
8.0%<br />
6.0%<br />
4.0%<br />
2.0%<br />
0.0%<br />
2821 2460<br />
884<br />
Control NaCN 24 Hrs. NaCN 8 Weeks<br />
Time<br />
6.7%<br />
2.3%<br />
2.0%<br />
Control NaCN 24 Hrs. NaCN 8 Weeks<br />
Time<br />
% Mitotic Index gm/0.1mL N=Zooxanthellae gm/0.1mL<br />
(a)<br />
(b)<br />
3500<br />
3000<br />
2500<br />
2000<br />
1500<br />
1000<br />
500<br />
0<br />
9.0%<br />
8.0%<br />
7.0%<br />
6.0%<br />
5.0%<br />
4.0%<br />
3.0%<br />
2.0%<br />
1.0%<br />
0.0%<br />
2934<br />
1.53%<br />
1314<br />
5.03%<br />
797<br />
Control 24 Hr. NaCN 8 Weeks NaCN<br />
Time<br />
8.06 %<br />
Control 24 Hr. NaCN 8 Weeks NaCN<br />
Time<br />
Fig. 7. (a) Zooxanthellae densities <strong>in</strong> Euphyllia divisa exposed to 600<br />
mg/l CN. (b) MI of Euphyllia divisa exposed to 600 mg/l CN.<br />
Fig. 8. (a) Zooxanthellae densities <strong>in</strong> Trachyphyllia geoffrio exposed to<br />
600 mg/l of CN. (b) MI of Trachyphyllia geoffrio exposed to 600 mg/l<br />
CN.<br />
of mesenterial filaments, gastrodermal disruption, excess<br />
mucus production, <strong>and</strong> loss of pigment as well as<br />
swell<strong>in</strong>g <strong>and</strong> disfigurement of the <strong>zooxanthellae</strong> cells.<br />
M<strong>in</strong>imal doses of CN caused an immediate stress response<br />
by Acropora millepora. The slight loss of pigment<br />
<strong>and</strong> excess mucus release are the first signs of a stressresponse<br />
(Hayes <strong>and</strong> Goreau, 1998). Swell<strong>in</strong>g of the<br />
<strong>zooxanthellae</strong> cells was visible macroscopically. Cyanide-exposed<br />
corals <strong>and</strong> anemones showed changes <strong>in</strong><br />
cellular <strong>morphology</strong> compared to control samples. The<br />
average diameter of cells <strong>in</strong> control tissues was approximately<br />
1.14 cm at a pr<strong>in</strong>t magnification of 1250.<br />
This means that the unit diameter of the <strong>zooxanthellae</strong><br />
was about 0.01 mm. At 48 h after cyanide dos<strong>in</strong>g for 60<br />
s, the <strong>zooxanthellae</strong> had lost some of their sta<strong>in</strong><strong>in</strong>g <strong>in</strong>tensity<br />
<strong>and</strong> the cytoplasm appeared disorganized. At 48<br />
h after a 120-s exposure, the same trend was apparent.<br />
The cytoplasm was poorly sta<strong>in</strong>ed <strong>and</strong> the chloroplasts<br />
appeared less dense. At 48 h after the 120-s exposure, the<br />
cytoplasm appeared vacuolated <strong>and</strong> the chloroplasts<br />
appeared less dense. No changes <strong>in</strong> the <strong>morphology</strong> of<br />
the pyrenoid body or the nucleus were apparent. The<br />
average diameter of the <strong>zooxanthellae</strong> cells seemed to be<br />
reduced by 5–9% <strong>in</strong> cross-sectional area. This result may