2011 Annual Report - Carolina Farm Credit
2011 Annual Report - Carolina Farm Credit
2011 Annual Report - Carolina Farm Credit

You also want an ePaper? Increase the reach of your titles
YUMPU automatically turns print PDFs into web optimized ePapers that Google loves.
<strong>Carolina</strong> <strong>Farm</strong> <strong>Credit</strong>, ACA<br />
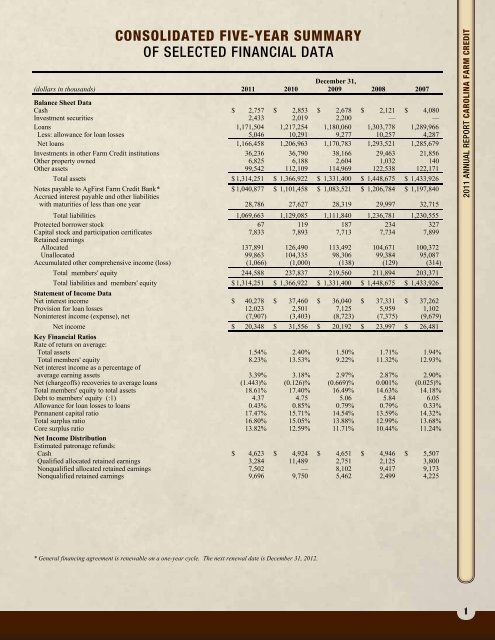
Consolidated Five - Year five-year Summary summary of Selected<br />
of selected Financial financial Data data<br />
December 31,<br />
(dollars in thousands) <strong>2011</strong> 2010 2009 2008 2007<br />
Balance Sheet Data<br />
Cash $ 2,757 $ 2,853 $ 2,678 $ 2,121 $ 4,080<br />
Investment securities 2,433 2,019 2,200 ——<br />
Loans 1,171,504 1,217,254 1,180,060 1,303,778 1,289,966<br />
Less: allowance for loan losses 5,046 10,291 9,277 10,257 4,287<br />
Net loans 1,166,458 1,206,963 1,170,783 1,293,521 1,285,679<br />
Investments in other <strong>Farm</strong> <strong>Credit</strong> institutions 36,236 36,790 38,166 29,463 21,856<br />
Other property owned 6,825 6,188 2,604 1,032 140<br />
Other assets 99,542 112,109 114,969 122,538 122,171<br />
Total assets $ 1,314,251 $ 1,366,922 $ 1,331,400 $ 1,448,675 $ 1,433,926<br />
Notes payable to AgFirst <strong>Farm</strong> <strong>Credit</strong> Bank* $ 1,040,877 $ 1,101,458 $ 1,083,521 $ 1,206,784 $ 1,197,840<br />
Accrued interest payable and other liabilities<br />
with maturities of less than one year 28,786 27,627 28,319 29,997 32,715<br />
Total liabilities 1,069,663 1,129,085 1,111,840 1,236,781 1,230,555<br />
Protected borrower stock 6 119 187 234 327<br />
Capital stock and participation certificates 7,833 7,893 7,713 7,734 7,899<br />
Retained earnings<br />
Allocated 137,891 126,490 113,492 104,671 100,372<br />
Unallocated 99,863 104,335 98,306 99,384 95,087<br />
Accumulated other comprehensive income (loss) (1,066) (1,000) (138) (129) (314)<br />
Total members' equity 244,588 237,837 219,560 211,894 203,371<br />
Total liabilities and members' equity $ 1,314,251 $ 1,366,922 $ 1,331,400 $ 1,448,675 $ 1,433,926<br />
Statement of Income Data<br />
Net interest income $ 40,278 $ 37,460 $ 36,040 $ 37,331 $ 37,262<br />
Provision for loan losses 12,023 2,501 7,125 5,959 1,102<br />
Noninterest income (expense), net (7,907) (3,403) (8,723) (7,375) (9,679)<br />
Net income $ 20,348 $ 31,556 $ 20,192 $ 23,997 $ 26,481<br />
Key Financial Ratios<br />
Rate of return on average:<br />
Total assets 1.54% 2.40% 1.50% 1.71% 1.94%<br />
Total members' equity 8.23% 13.53% 9.22% 11.32% 12.93%<br />
Net interest income as a percentage of<br />
average earning assets 3.39% 3.18% 2.97% 2.87% 2.90%<br />
Net (chargeoffs) recoveries to average loans (1.443)% (0.126)% (0.669)% 0.001% (0.025)%<br />
Total members' equity to total assets 18.61% 17.40% 16.49% 14.63% 14.18%<br />
Debt to members' equity (:1) 4.37 4.75 5.06 5.84 6.05<br />
Allowance for loan losses to loans 0.43% 0.85% 0.79% 0.79% 0.33%<br />
Permanent capital ratio 17.47% 15.71% 14.54% 13.59% 14.32%<br />
Total surplus ratio 16.80% 15.05% 13.88% 12.99% 13.68%<br />
Core surplus ratio 13.82% 12.59% 11.71% 10.44% 11.24%<br />
Net Income Distribution<br />
Estimated patronage refunds:<br />
Cash $ 4,623 $ 4,924 $ 4,651 $ 4,946 $ 5,507<br />
Qualified allocated retained earnings 3,284 11,489 2,751 2,125 3,800<br />
Nonqualified allocated retained earnings 7,502 —8,102 9,417 9,173<br />
Nonqualified retained earnings 9,696 9,750 5,462 2,499 4,225<br />
<strong>2011</strong> <strong>Annual</strong> <strong>Report</strong> <strong>Carolina</strong> <strong>Farm</strong> <strong>Credit</strong><br />
* General financing agreement is renewable on a one-year cycle. The next renewal date is December 31, 2012.<br />
3<br />
<strong>2011</strong> <strong>Annual</strong> <strong>Report</strong><br />
1