2011 Annual Report - Carolina Farm Credit
2011 Annual Report - Carolina Farm Credit
2011 Annual Report - Carolina Farm Credit
You also want an ePaper? Increase the reach of your titles
YUMPU automatically turns print PDFs into web optimized ePapers that Google loves.
<strong>Carolina</strong> <strong>Farm</strong> <strong>Credit</strong>, ACA<br />
Total capital stock and participation certificates were $7,900 on<br />
December 31, <strong>2011</strong>, compared to $8,012 on December 31, 2010<br />
and $7,900 on December 31, 2009.<br />
FCA sets minimum regulatory capital requirements for System<br />
banks and associations. Capital adequacy is evaluated using a<br />
number of regulatory ratios. According to the FCA regulations,<br />
each institution’s permanent capital ratio is calculated by<br />
dividing permanent capital by a risk-adjusted asset base. Risk<br />
adjusted assets mean the total dollar amount of the institution’s<br />
assets adjusted by an appropriate credit conversion factor as<br />
defined by regulation. For all periods represented, the<br />
Association exceeded minimum regulatory standards for all the<br />
ratios.<br />
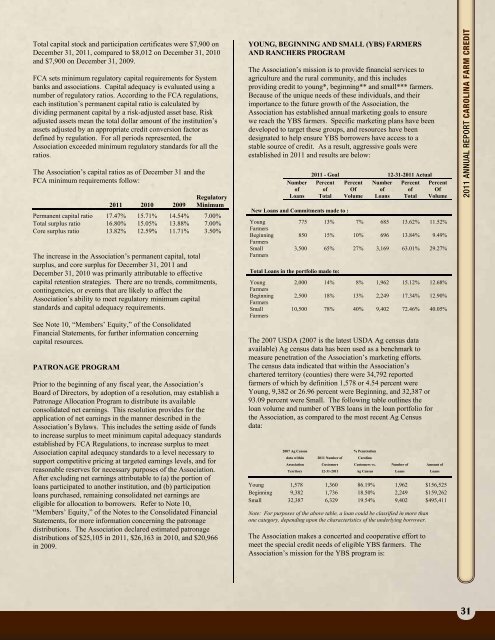
The Association’s capital ratios as of December 31 and the<br />
FCA minimum requirements follow:<br />
Regulatory<br />
<strong>2011</strong> 2010 2009 Minimum<br />
Permanent capital ratio 17.47% 15.71% 14.54% 7.00%<br />
Total surplus ratio 16.80% 15.05% 13.88% 7.00%<br />
Core surplus ratio 13.82% 12.59% 11.71% 3.50%<br />
The increase in the Association’s permanent capital, total<br />
surplus, and core surplus for December 31, <strong>2011</strong> and<br />
December 31, 2010 was primarily attributable to effective<br />
capital retention strategies. There are no trends, commitments,<br />
contingencies, or events that are likely to affect the<br />
Association’s ability to meet regulatory minimum capital<br />
standards and capital adequacy requirements.<br />
See Note 10, “Members’ Equity,” of the Consolidated<br />
Financial Statements, for further information concerning<br />
capital resources.<br />
PATRONAGE PROGRAM<br />
Prior to the beginning of any fiscal year, the Association’s<br />
Board of Directors, by adoption of a resolution, may establish a<br />
Patronage Allocation Program to distribute its available<br />
consolidated net earnings. This resolution provides for the<br />
application of net earnings in the manner described in the<br />
Association’s Bylaws. This includes the setting aside of funds<br />
to increase surplus to meet minimum capital adequacy standards<br />
established by FCA Regulations, to increase surplus to meet<br />
Association capital adequacy standards to a level necessary to<br />
support competitive pricing at targeted earnings levels, and for<br />
reasonable reserves for necessary purposes of the Association.<br />
After excluding net earnings attributable to (a) the portion of<br />
loans participated to another institution, and (b) participation<br />
loans purchased, remaining consolidated net earnings are<br />
eligible for allocation to borrowers. Refer to Note 10,<br />
“Members’ Equity,” of the Notes to the Consolidated Financial<br />
Statements, for more information concerning the patronage<br />
distributions. The Association declared estimated patronage<br />
distributions of $25,105 in <strong>2011</strong>, $26,163 in 2010, and $20,966<br />
in 2009.<br />
YOUNG, BEGINNING AND SMALL (YBS) FARMERS<br />
AND RANCHERS PROGRAM<br />
The Association’s mission is to provide financial services to<br />
agriculture and the rural community, and this includes<br />
providing credit to young*, beginning** and small*** farmers.<br />
Because of the unique needs of these individuals, and their<br />
importance to the future growth of the Association, the<br />
Association has established annual marketing goals to ensure<br />
we reach the YBS farmers. Specific marketing plans have been<br />
developed to target these groups, and resources have been<br />
designated to help ensure YBS borrowers have access to a<br />
stable source of credit. As a result, aggressive goals were<br />
established in <strong>2011</strong> and results are below:<br />
Number<br />
of<br />
Loans<br />
New Loans and Commitments made to :<br />
Young<br />
<strong>Farm</strong>ers<br />
Beginning<br />
<strong>Farm</strong>ers<br />
Small<br />
<strong>Farm</strong>ers<br />
The 2007 USDA (2007 is the latest USDA Ag census data<br />
available) Ag census data has been used as a benchmark to<br />
measure penetration of the Association’s marketing efforts.<br />
The census data indicated that within the Association’s<br />
chartered territory (counties) there were 34,792 reported<br />
farmers of which by definition 1,578 or 4.54 percent were<br />
Young, 9,382 or 26.96 percent were Beginning, and 32,387 or<br />
93.09 percent were Small. The following table outlines the<br />
loan volume and number of YBS loans in the loan portfolio for<br />
the Association, as compared to the most recent Ag Census<br />
data:<br />
2007 Ag Census<br />
data within<br />
Association<br />
Territory<br />
<strong>2011</strong> - Goal 12-31-<strong>2011</strong> Actual<br />
Percent Percent Number Percent Percent<br />
of Of of of Of<br />
Total Volume Loans Total Volume<br />
775 13% 7% 685 13.62% 11.52%<br />
850 15% 10% 696 13.84% 9.49%<br />
3,500 65% 27% 3,169 63.01% 29.27%<br />
Total Loans in the portfolio made to:<br />
Young<br />
<strong>Farm</strong>ers<br />
Beginning<br />
<strong>Farm</strong>ers<br />
Small<br />
<strong>Farm</strong>ers<br />
2,000 14% 8% 1,962 15.12% 12.68%<br />
2,500 18% 13% 2,249 17.34% 12.90%<br />
10,500 78% 40% 9,402 72.46% 40.05%<br />
<strong>2011</strong> Number of<br />
Customers<br />
12-31-<strong>2011</strong><br />
% Penetration<br />
<strong>Carolina</strong><br />
Customers vs.<br />
Ag Census<br />
Number of<br />
Loans<br />
Amount of<br />
Loans<br />
Young 1,578 1,360 86.19% 1,962 $156,525<br />
Beginning 9,382 1,736 18.50% 2,249 $159,262<br />
Small 32,387 6,329 19.54% 9,402 $495,411<br />
Note: For purposes of the above table, a loan could be classified in more than<br />
one category, depending upon the characteristics of the underlying borrower.<br />
The Association makes a concerted and cooperative effort to<br />
meet the special credit needs of eligible YBS farmers. The<br />
Association’s mission for the YBS program is:<br />
<strong>2011</strong> <strong>Annual</strong> <strong>Report</strong> <strong>Carolina</strong> <strong>Farm</strong> <strong>Credit</strong><br />
13<br />
<strong>2011</strong> <strong>Annual</strong> <strong>Report</strong><br />
31


