2011 Annual Report - Carolina Farm Credit
2011 Annual Report - Carolina Farm Credit
2011 Annual Report - Carolina Farm Credit

Create successful ePaper yourself
Turn your PDF publications into a flip-book with our unique Google optimized e-Paper software.
<strong>Carolina</strong> <strong>Farm</strong> <strong>Credit</strong>, ACA<br />
Level 1<br />
Level 1 inputs to the valuation methodology are unadjusted quoted<br />
prices for identical assets or liabilities in active markets. The<br />
Association’s Level 1 assets at December 31, <strong>2011</strong> consist of<br />
assets held in trust funds related to deferred compensation and<br />
supplemental retirement plans. The trust funds include<br />
investments in securities that are actively traded and have quoted<br />
net asset value prices that are directly observable in the<br />
marketplace.<br />
Level 2<br />
Level 2 inputs to the valuation methodology include quoted prices<br />
for similar assets and liabilities in active markets; quoted prices in<br />
markets that are not active; and inputs that are observable, or can<br />
be corroborated, for substantially the full term of the asset or<br />
liability. The Association has no Level 2 assets and liabilities<br />
measured at fair value on a recurring basis at December 31, <strong>2011</strong>.<br />
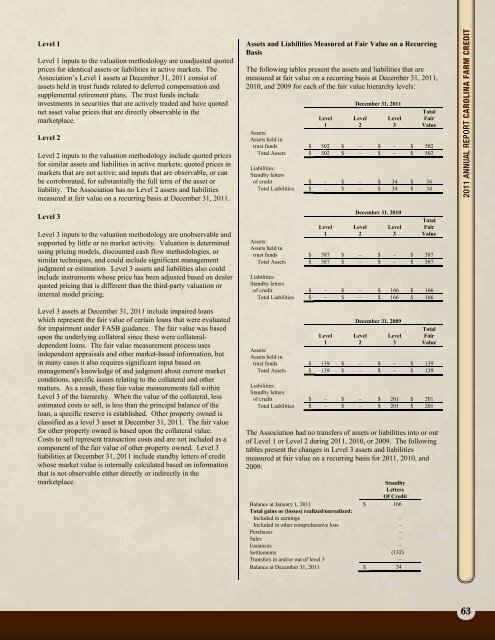
Assets and Liabilities Measured at Fair Value on a Recurring<br />
Basis<br />
The following tables present the assets and liabilities that are<br />
measured at fair value on a recurring basis at December 31, <strong>2011</strong>,<br />
2010, and 2009 for each of the fair value hierarchy levels:<br />
December 31, <strong>2011</strong><br />
Total<br />
Level Level Level Fair<br />
1 2 3 Value<br />
Assets:<br />
Assets held in<br />
trust funds $ 502 $ – $ – $ 502<br />
Total Assets $ 502 $ – $ – $ 502<br />
Liabilities:<br />
Standby letters<br />
of credit $ – $ – $ 34 $ 34<br />
Total Liabilities $ – $ – $ 34 $ 34<br />
<strong>2011</strong> <strong>Annual</strong> <strong>Report</strong> <strong>Carolina</strong> <strong>Farm</strong> <strong>Credit</strong><br />
Level 3<br />
Level 3 inputs to the valuation methodology are unobservable and<br />
supported by little or no market activity. Valuation is determined<br />
using pricing models, discounted cash flow methodologies, or<br />
similar techniques, and could include significant management<br />
judgment or estimation. Level 3 assets and liabilities also could<br />
include instruments whose price has been adjusted based on dealer<br />
quoted pricing that is different than the third-party valuation or<br />
internal model pricing.<br />
Level 3 assets at December 31, <strong>2011</strong> include impaired loans<br />
which represent the fair value of certain loans that were evaluated<br />
for impairment under FASB guidance. The fair value was based<br />
upon the underlying collateral since these were collateraldependent<br />
loans. The fair value measurement process uses<br />
independent appraisals and other market-based information, but<br />
in many cases it also requires significant input based on<br />
management's knowledge of and judgment about current market<br />
conditions, specific issues relating to the collateral and other<br />
matters. As a result, these fair value measurements fall within<br />
Level 3 of the hierarchy. When the value of the collateral, less<br />
estimated costs to sell, is less than the principal balance of the<br />
loan, a specific reserve is established. Other property owned is<br />
classified as a level 3 asset at December 31, <strong>2011</strong>. The fair value<br />
for other property owned is based upon the collateral value.<br />
Costs to sell represent transaction costs and are not included as a<br />
component of the fair value of other property owned. Level 3<br />
liabilities at December 31, <strong>2011</strong> include standby letters of credit<br />
whose market value is internally calculated based on information<br />
that is not observable either directly or indirectly in the<br />
marketplace.<br />
December 31, 2010<br />
Total<br />
Level Level Level Fair<br />
1 2 3 Value<br />
Assets:<br />
Assets held in<br />
trust funds $ 387 $ – $ – $ 387<br />
Total Assets $ 387 $ – $ – $ 387<br />
Liabilities:<br />
Standby letters<br />
of credit $ – $ – $ 166 $ 166<br />
Total Liabilities $ – $ – $ 166 $ 166<br />
December 31, 2009<br />
Total<br />
Level Level Level Fair<br />
1 2 3 Value<br />
Assets:<br />
Assets held in<br />
trust funds $ 139 $ – $ – $ 139<br />
Total Assets $ 139 $ – $ – $ 139<br />
Liabilities:<br />
Standby letters<br />
of credit $ – $ – $ 201 $ 201<br />
Total Liabilities $ – $ – $ 201 $ 201<br />
The Association had no transfers of assets or liabilities into or out<br />
of Level 1 or Level 2 during <strong>2011</strong>, 2010, or 2009. The following<br />
tables present the changes in Level 3 assets and liabilities<br />
measured at fair value on a recurring basis for <strong>2011</strong>, 2010, and<br />
2009:<br />
Standby<br />
Letters<br />
Of <strong>Credit</strong><br />
Balance at January 1, <strong>2011</strong> $ 166<br />
Total gains or (losses) realized/unrealized:<br />
Included in earnings –<br />
Included in other comprehensive loss –<br />
Purchases –<br />
Sales –<br />
Issuances –<br />
Settlements (132)<br />
Transfers in and/or out of level 3 –<br />
Balance at December 31, <strong>2011</strong> $ 34<br />
45<br />
<strong>2011</strong> <strong>Annual</strong> <strong>Report</strong><br />
63