Transactions from the Xth International Orthoptics Congress 2004
Transactions from the Xth International Orthoptics Congress 2004
Transactions from the Xth International Orthoptics Congress 2004

Create successful ePaper yourself
Turn your PDF publications into a flip-book with our unique Google optimized e-Paper software.
Results<br />
The distance and near stereoacuities produced similar correlations with PD when analysed<br />
separately. Space limitations forbid a full report of each group’s data here (data <strong>from</strong> <strong>the</strong><br />
distance group have been reported elsewhere; ref. 3). Instead, we concentrate on a combined<br />
analysis, in which each participant’s results were normalised to <strong>the</strong>ir group means, yielding<br />
relative measures as <strong>the</strong> data for Pearson product moment correlations. Using relative<br />
measures eliminated <strong>the</strong> variation in PD measurements arising <strong>from</strong> using distance and near<br />
settings on <strong>the</strong> PD meter. It also eliminated differences in group means for <strong>the</strong> distance and<br />
near stereoacuities. The group means prior to normalisation were: distance PD 60.3mm (SD<br />
3.8mm); near PD 56.5mm (2.7mm), distance stereoacuity 5.3″ (2.4″), near stereoacuity 34″<br />
(14″). We interpret <strong>the</strong> latter difference as caused by differences in <strong>the</strong> details of <strong>the</strong> two<br />
Howard-Dolman displays ra<strong>the</strong>r than a genuine difference in near and distance stereoacuities.<br />
For example, apparatus factors related to <strong>the</strong> ratchet mechanism meant that <strong>the</strong> rods had to be<br />
separated by about 7.7º in <strong>the</strong> near case, as against only 0.8º for <strong>the</strong> distance settings. This<br />
wider separation is likely to have made <strong>the</strong> near task harder.<br />
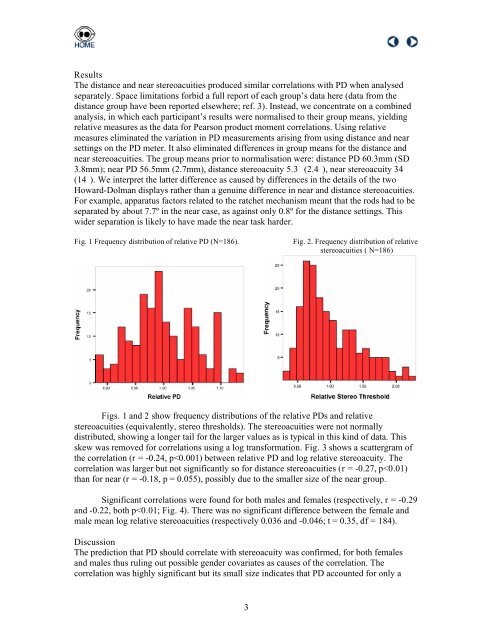
Fig. 1 Frequency distribution of relative PD (N=186).<br />
Fig. 2. Frequency distribution of relative<br />
stereoacuities ( N=186)<br />
Figs. 1 and 2 show frequency distributions of <strong>the</strong> relative PDs and relative<br />
stereoacuities (equivalently, stereo thresholds). The stereoacuities were not normally<br />
distributed, showing a longer tail for <strong>the</strong> larger values as is typical in this kind of data. This<br />
skew was removed for correlations using a log transformation. Fig. 3 shows a scattergram of<br />
<strong>the</strong> correlation (r = -0.24, p