Crop Coefficients For Use In Irrigation Scheduling - NRCS Irrigation ...
Crop Coefficients For Use In Irrigation Scheduling - NRCS Irrigation ...
Crop Coefficients For Use In Irrigation Scheduling - NRCS Irrigation ...

You also want an ePaper? Increase the reach of your titles
YUMPU automatically turns print PDFs into web optimized ePapers that Google loves.
Water Conservation<br />
Order No. 577.100-5<br />
Revised October 2001<br />
Agdex 561<br />
CROP COEFFICIENTS FOR USE IN<br />
IRRIGATION SCHEDULING<br />
<strong>Crop</strong> water use information can be used to schedule irrigation systems. <strong>Crop</strong> water use is directly related to<br />
evapotranspiration (ET). The ET information must be adjusted to correspond to the crop and climate. This<br />
factsheet provides information on selecting the crop coefficient that should be used.<br />
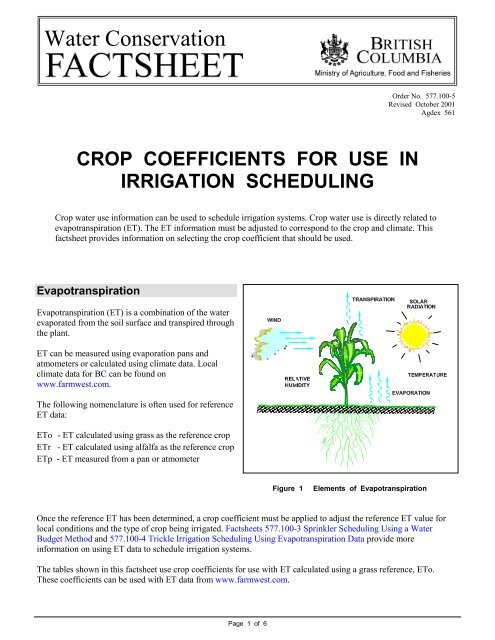
Evapotranspiration<br />
Evapotranspiration (ET) is a combination of the water<br />
evaporated from the soil surface and transpired through<br />
the plant.<br />
ET can be measured using evaporation pans and<br />
atmometers or calculated using climate data. Local<br />
climate data for BC can be found on<br />
www.farmwest.com.<br />
The following nomenclature is often used for reference<br />
ET data:<br />
ETo - ET calculated using grass as the reference crop<br />
ETr - ET calculated using alfalfa as the reference crop<br />
ETp - ET measured from a pan or atmometer<br />
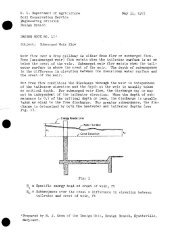
Figure 1<br />
Elements of Evapotranspiration<br />
Once the reference ET has been determined, a crop coefficient must be applied to adjust the reference ET value for<br />
local conditions and the type of crop being irrigated. Factsheets 577.100-3 Sprinkler <strong>Scheduling</strong> Using a Water<br />
Budget Method and 577.100-4 Trickle <strong>Irrigation</strong> <strong>Scheduling</strong> Using Evapotranspiration Data provide more<br />
information on using ET data to schedule irrigation systems.<br />
The tables shown in this factsheet use crop coefficients for use with ET calculated using a grass reference, ETo.<br />
These coefficients can be used with ET data from www.farmwest.com.<br />
Page 1 of 6
<strong>Crop</strong> Water <strong>Use</strong><br />
<strong>Crop</strong> water use is directly related to ET. The crop’s water use can be determined by multiplying the reference ETo by<br />
a crop coefficient (Kc). The crop coefficient adjusts the calculated reference ETo to obtain the crop<br />
evapotranspiration ETc. Different crops will have a different crop coefficient and resulting water use.<br />
ETc = ETo x Kc (Equation 1)<br />
Where ETo<br />
Kc<br />
ETc<br />
= calculated reference ET for grass (mm)<br />
available from www.farmwest.com<br />
= crop coefficient<br />
= crop evapotranspiration or crop water use (mm)<br />
<strong>Crop</strong> <strong>Coefficients</strong><br />
The reference ET is a measurement of the water use for that reference crop. <strong>In</strong> the case of ETo grass is used as the<br />
reference. However other crops may not use the same amount of water as grass due to changes in rooting depth, crop<br />
growth stages and plant physiology. The crop coefficient (Kc) takes into account the crop type and crop development<br />
to adjust the ETo for that specific crop. There may be several crop coefficients used for a single crop throughout an<br />
irrigation season depending on the crop’s stage of development.<br />
<strong>Crop</strong> coefficients may also vary depending on how the evapotranspiration data has been calculated or obtained.<br />
Reference ET<br />
Reference ET is calculated using climatic data obtained from a weather station.<br />
ETo is calculated to simulate a grass reference crop. Alfalfa may also be used as a<br />
reference crop in some areas and may be referred to as ETr. As a result there are different<br />
types of crop coefficients that may be used in the literature. <strong>Crop</strong> coefficients developed<br />
using grass as the reference crops will be larger than those using alfalfa, because ET from<br />
alfalfa is greater. The reference ETo obtained from www.farmwest.com is calculated for<br />
a grass reference crop.<br />
If using crop coefficients or reference ET values from other sources make sure the Kc<br />
value and ET have been developed for use with the same reference crop.<br />
Figure 2 Weather Station<br />
from Davis <strong>In</strong>struments<br />
Pan Evaporation<br />
Atmometers and evaporation pans also provide ET data.<br />
If the ET data used is obtained from a pan or atmometer<br />
a pan crop coefficient will have to be applied to convert<br />
the pan evaporation ETp to a crop water use ETc.<br />
Figure 3<br />
Evaporation Pan and Atmometer<br />
Page 2 of 6
Converting <strong>Crop</strong> <strong>Coefficients</strong><br />
<strong>Crop</strong> coefficients based on an alfalfa reference or pan reference can be converted for use with a grass reference by<br />
using the factors shown in Table 1.<br />
The factors shown are for semi arid, moderately windy conditions. <strong>For</strong> humid, calm conditions the values will be 10%<br />
less and for arid windy conditions the values will be 10% more. <strong>For</strong> most British Columbia summer conditions the<br />
factors in the table can be used.<br />
Table 1<br />
Guide to Converting <strong>Crop</strong> <strong>Coefficients</strong><br />
Based on Reference ET <strong>Use</strong>d<br />
<strong>Crop</strong> Coefficient Conversion<br />
Multiply by:<br />
Kc - grass (ETo) to Kc alfalfa (ETr) 0.83<br />
Kc - grass (ETo) to Kc - pan (ETp) 0.80<br />
Kc - pan (ETp) to Kc – alfalfa (ETr) 1.04<br />
EXAMPLE The Kc value for raspberries in mid<br />
season is 1.2 if using a reference ETo for grass. See<br />
Table 3.<br />
To convert this Kc value for use with an alfalfa<br />
reference ETr multiply the value by 0.83. The crop<br />
coefficient for use with an alfalfa reference ETo is:<br />
Kc (ETr) = 1.2 x 0.83 = 1.0<br />
<strong>Crop</strong> Water <strong>Use</strong> and Stages of Growth<br />
<strong>Crop</strong> growth periods can be divided into four<br />
distinct growth stages; initial, crop development,<br />
mid season and late season. See Figure 4. The<br />
length of each of these stages depends on the<br />
climate, latitude, elevation and planting date.<br />
Local observations are best for determining the<br />
growth stage of the crop and which Kc values to<br />
use.<br />
<strong>For</strong> annual crops, during the crop’s germination<br />
and establishment, most of the ET occurs as<br />
evaporation from the soil surface. As the foliage<br />
develops evaporation from the soil surface<br />
decreases and transpiration increases. <strong>For</strong><br />
perennial crops a similar pattern may occur as<br />
the plant starts to leaf out, grow new shoots and<br />
develop fruit. The percentage of canopy cover<br />
will determine the rate of evapotranspiration<br />
(ET). Maximum ET occurs when the canopy<br />
cover is about 60-70% for tree crops and 70-<br />
Figure 4 <strong>Crop</strong> <strong>Coefficients</strong> and <strong>Crop</strong> Development Stages<br />
80% for field and row crops. The maximum canopy cover often coincides with the time of year that sun radiation and<br />
air temperature are at their greatest. The maximum ET therefore occurs during mid season.<br />
During the crop development stage there are no set Kc values. If irrigating during this period choose a Kc value that is<br />
between Kc ini and Kc mid . A similar approach should be taken for the time period between Kc mid and Kc end . However<br />
this time period may be much shorter and a jump directly from Kc mid to Kc end could be taken.<br />
Table 2 provides a description of the various plant growth stages. These stages can be used to select an appropriate<br />
crop coefficient from the following Tables.<br />
Page 3 of 6
Table 2<br />
<strong>Crop</strong> Stage of Development<br />
<strong>In</strong>itial<br />
Stage <strong>In</strong>dicators <strong>Crop</strong> Coefficient<br />
<strong>Crop</strong><br />
development<br />
Mid season<br />
Late Season<br />
Planting date (or the start of new leaves for perennials) to 10% ground<br />
cover.<br />
10% ground cover to effective full cover, about 60-70% coverage for<br />
tree crops and 70-80% for field and row crops.<br />
Effective full cover to maturity, indicated by yellowing of leave, leaf<br />
drop, browning of fruit.<br />
This stage is long for perennials but relatively short for vegetables crops<br />
that are harvested for their fresh fruit.<br />
Maturity to harvest: the Kc value could be high if the crop is irrigated<br />
frequently until fresh harvest or low if the crop is allowed to dry out in<br />
the field before harvest.<br />
Kc ini<br />
Kc ini - Kc mid<br />
Kc mid<br />
Kc mid - Kc end<br />
Select a <strong>Crop</strong> Coefficient<br />
The crop coefficients in Tables 3 and 4 can be used as a general guideline for British Columbia. The crop coefficients<br />
are to be used for a grass reference ETo. The crops should be of average height, well watered and well managed.<br />
Vegetable and Berry <strong>Crop</strong>s<br />
Table 3 provides crop coefficients for various<br />
vegetable and berry crops for different stages of the<br />
growing season.<br />
<strong>Crop</strong> coefficients for many vegetables may not be<br />
available. It is possible to estimate the crop coefficient<br />
at the peak time of year for some crops using the ratio<br />
of bed width to canopy cover. Comparing crop<br />
coefficients of other crops that are similar in nature<br />
may also be useful.<br />
Kc = Wp/Wb (Equation 2)<br />
Where Kc = crop coefficient<br />
Wp = width of plant canopy<br />
Wb = bed spacing<br />
Figure 5<br />
Vegetable Canopy Measurement<br />
Page 4 of 6
Table 3<br />
<strong>Crop</strong> <strong>Coefficients</strong> for <strong>For</strong>age, Vegetables and Berries<br />
<strong>Crop</strong> Kc ini Kc mid Kc end<br />
alfalfa 0.4 1.2 1.15<br />
asparagus 0.3 0.95 0.3<br />
beans, green 0.5 1.05 0.9<br />
beets 0.5 1.05 0.95<br />
blueberries 0.4 1.0 0.75<br />
broccoli 0.7 1.05 0.95<br />
cabbage 0.7 1.05 0.95<br />
cabbage -local 0.7 1.05 0.95<br />
carrots 0.7 1.05 0.95<br />
cauliflower 0.7 1.05 0.95<br />
cranberries 0.4 0.9 0.50<br />
celery 0.7 1.05 0.95<br />
cereal 0.3 1.15 0.25<br />
corn 0.3 1.15 0.4<br />
cucumber 0.6 1 0.75<br />
green onions 0.7 1.05 0.95<br />
lettuce 0.7 1 0.95<br />
<strong>Crop</strong> Kc ini Kc mid Kc end<br />
onions 0.7 1.05 0.95<br />
pasture (grass) 0.4 1.0 0.85<br />
peas 0.5 1.15 1.1<br />
potato 0.5 1.15 0.75<br />
pumpkin 0.5 1 0.8<br />
radish 0.7 0.9 0.85<br />
raspberries 0.4 1.2 0.75<br />
small vegetables 0.70 1.05 0.95<br />
spinach 0.7 1.05 0.95<br />
strawberries 0.4 1.05 0.7<br />
squash 0.5 0.95 0.75<br />
sweet corn 0.3 1.15 0.4<br />
sweet peppers 0.7 1.05 0.85<br />
tomato 0.7 1.05 0.8<br />
tubers 0.5 1.05 0.95<br />
watermelon 0.4 1 0.75<br />
Alfalfa and Other <strong>For</strong>age <strong>Crop</strong>s<br />
Many forage or hay crops are harvested several times<br />
during the growing season. These crops will<br />
therefore have a new growth stage cycle for each cut.<br />
<strong>In</strong>stead of one Kc curve for the entire season as in<br />
Figure 4, these crops would have a series of curves to<br />
make up the entire growing season. See Figure 6.<br />
Immediately after a cutting the crop coefficient<br />
would revert to Kc ini , 0.3 and the Kc end would end at<br />
the next harvest date.<br />
The growth stages for the second and third cuts may<br />
be shorter than the first cut or the fourth cut. This is<br />
because the heat units that are available during the<br />
warmer summer months would speed up the growth.<br />
Growth during the early spring and fall would be shorter.<br />
The crop coefficient for forage crops are shown in Table 3.<br />
Figure 6 – Growth cycle for forage crops with more<br />
than one cut<br />
Page 5 of 6
Apples and Grapes<br />
<strong>Crop</strong> coefficients for tree fruits and grapes have been segregated into months as shown in Table 4. The absence of a<br />
cover crop will lower the crop coefficients shown. The cover crop draws water from the soil storage reservoir and<br />
therefore increases water use. If there is no cover crop or grass between the tree or plant rows the crop coefficients<br />
will be about 10% lower in May, September and October and 20% lower in June, July and August.<br />
Table 4<br />
<strong>Crop</strong> <strong>Coefficients</strong> for Tree Fruit and Grapes<br />
<strong>Crop</strong> May June July Aug Sept. Oct.<br />
Apples Cherries and Pears with cover crops*<br />
Lower Mainland / Vancouver Isl. 0.7 0.9 1.00 1.00 0.95 0.75<br />
Okanagan / Thompson 0.85 1.15 1.25 1.25 1.2 .95<br />
Kootenays 0.8 1.10 1.20 1.20 1.15 0.7<br />
Apricots, Peaches and other Stone Fruit with cover crops*<br />
Lower mainland / Vancouver Isl. 0.9 1.0 1.0 1.0 0.95 0.8<br />
Okanagan / Thompson 0.80 1.10 1.20 1.20 1.15 0.9<br />
Kootenays 0.70 1.00 1.05 1.10 1.00 0.8<br />
Grapes<br />
Lower mainland / Vancouver Isl. 0.55 0.65 0.65 0.65 0.65 0.50<br />
Okanagan / Thompson 0.50 0.70 0.80 0.85 0.80 0.70<br />
Kootenays 0.45 0.70 0.85 0.90 0.80 0.70<br />
* No Cover crop – reduce values by 10% 20% 20% 20% 10% 10%<br />
Soil moisture monitoring devices can be used to adjust crop coefficients to match local conditions. See Factsheet<br />
577.100-2 <strong>Irrigation</strong> <strong>Scheduling</strong> with Tensiometers for additional information.<br />
FOR FURTHER INFORMATION CONTACT<br />
RESOURCE MANAGEMENT BRANCH<br />
Ted Van der Gulik, Senior Engineer Janine Nyvall, Water Management Engineer Ministry of Agriculture, Food and Fisheries<br />
Phone: (604) 556-3112 Phone: (604) 556-3113 1767 Angus Campbell Road<br />
Email: Ted.vanderGulik@gems8.gov.bc.ca Janine.Nyvall@gems5.gov.bc.ca Abbotsford, BC CANADA V3G 2M3<br />
Page 6 of 6