child care in cook county - Illinois Action for Children
child care in cook county - Illinois Action for Children
child care in cook county - Illinois Action for Children

You also want an ePaper? Increase the reach of your titles
YUMPU automatically turns print PDFs into web optimized ePapers that Google loves.
center-based <strong>in</strong>fant <strong>care</strong> can<br />
cost a typical Chicago family<br />
nearly one-quarter of their <strong>in</strong>come<br />
23%<br />
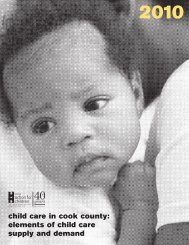
<strong>child</strong> <strong>care</strong> <strong>in</strong> <strong>cook</strong> <strong>county</strong>:<br />
elements of <strong>child</strong> <strong>care</strong><br />
supply + demand<br />
2007<br />
an ill<strong>in</strong>ois action <strong>for</strong> <strong>child</strong>ren research report<br />
funded <strong>in</strong> part by the mac arthur foundation and the ill<strong>in</strong>ois department of human services
4753 N. Broadway, Suite 1200<br />
Chicago IL 60640<br />
(312) 823-1100<br />
www.act<strong>for</strong><strong>child</strong>ren.org<br />
© 2006 Ill<strong>in</strong>ois <strong>Action</strong> <strong>for</strong> <strong>Children</strong>
2006 report on <strong>child</strong> <strong>care</strong> <strong>in</strong> <strong>cook</strong> <strong>county</strong>:<br />
elements of <strong>child</strong> <strong>care</strong> supply and demand<br />
FY 2006 (July 1, 2005–June 30, 2006)<br />
An Ill<strong>in</strong>ois <strong>Action</strong> <strong>for</strong> <strong>Children</strong> Research Report<br />
funded <strong>in</strong> part by The MacArthur Foundation and<br />
the Ill<strong>in</strong>ois Department of Human Services
Contents<br />
Executive Summary . . . . . . . . . . . . . . . . . . . . . . . . . . . . . . . . . . . . . . . . . . . . . . . . . . . . . . . . . . . . . . . . . . . . . . . . . . . . . . . 1<br />
Introduction: Families and Child Care <strong>in</strong> Cook County . . . . . . . . . . . . . . . . . . . . . . . . . . . . . . . . . . . . . . . . . . . . . . . . . 3<br />
Section I. Family Dilemma: Child Care Af<strong>for</strong>dability . . . . . . . . . . . . . . . . . . . . . . . . . . . . . . . . . . . . . . . . . . . . . . . . . . . 6<br />
A. The Cost of Child Care . . . . . . . . . . . . . . . . . . . . . . . . . . . . . . . . . . . . . . . . . . . . . . . . . . . . . . . . . . . . . . . . . . . . . . . 6<br />
B. Trends <strong>in</strong> Child Care Rates . . . . . . . . . . . . . . . . . . . . . . . . . . . . . . . . . . . . . . . . . . . . . . . . . . . . . . . . . . . . . . . . . . . 7<br />
C. What Percent of Income is Reasonable to Spend on Child Care? . . . . . . . . . . . . . . . . . . . . . . . . . . . . . . . . . . . . 8<br />
D. Help<strong>in</strong>g Parents Meet the Cost of Child Care . . . . . . . . . . . . . . . . . . . . . . . . . . . . . . . . . . . . . . . . . . . . . . . . . . . . 8<br />
E. Child Care Af<strong>for</strong>dability with Assistance . . . . . . . . . . . . . . . . . . . . . . . . . . . . . . . . . . . . . . . . . . . . . . . . . . . . . . . . . 9<br />
F. The Use of Ill<strong>in</strong>ois Child Care Assistance . . . . . . . . . . . . . . . . . . . . . . . . . . . . . . . . . . . . . . . . . . . . . . . . . . . . . . . 12<br />
Section II. Family Dilemma: Access to Available Child Care Slots . . . . . . . . . . . . . . . . . . . . . . . . . . . . . . . . . . . . . . 14<br />
A. Child Care Providers and Slots <strong>in</strong> Cook County . . . . . . . . . . . . . . . . . . . . . . . . . . . . . . . . . . . . . . . . . . . . . 14<br />
B. Providers and Slots by Region . . . . . . . . . . . . . . . . . . . . . . . . . . . . . . . . . . . . . . . . . . . . . . . . . . . . . . . . . . . . . . . . 15<br />
C. Center Slots by Child Age . . . . . . . . . . . . . . . . . . . . . . . . . . . . . . . . . . . . . . . . . . . . . . . . . . . . . . . . . . . . . . . . . . . 19<br />
D. Referrals Given to Parents <strong>in</strong> 2006 by Child Age . . . . . . . . . . . . . . . . . . . . . . . . . . . . . . . . . . . . . . . . . . . . . . . . 19<br />
Section III. Family Dilemma: F<strong>in</strong>d<strong>in</strong>g Child Care that Matches the Family’s Schedule . . . . . . . . . . . . . . . . . . . . . 21<br />
A. Providers Offer<strong>in</strong>g Child Care Dur<strong>in</strong>g Non-Traditional Hours . . . . . . . . . . . . . . . . . . . . . . . . . . . . . . . . . . . . . . . 21<br />
B. Referrals Given to Parents <strong>in</strong> Need of Non-Traditional Hours of Child Care . . . . . . . . . . . . . . . . . . . . . . . . . . . 22<br />
Section IV. Family Dilemma: F<strong>in</strong>d<strong>in</strong>g the Right Provider . . . . . . . . . . . . . . . . . . . . . . . . . . . . . . . . . . . . . . . . . . . . . . . 23<br />
A. What Do <strong>Children</strong> Need? . . . . . . . . . . . . . . . . . . . . . . . . . . . . . . . . . . . . . . . . . . . . . . . . . . . . . . . . . . . . . . . . . . . . 23<br />
B. Special Needs . . . . . . . . . . . . . . . . . . . . . . . . . . . . . . . . . . . . . . . . . . . . . . . . . . . . . . . . . . . . . . . . . . . . . . . . . . . . . 23<br />
Section V. Public Dilemma: Who Needs Child Care? Who Needs Support? . . . . . . . . . . . . . . . . . . . . . . . . . . . . . . 25<br />
A. Child Population, Poverty and Low Income . . . . . . . . . . . . . . . . . . . . . . . . . . . . . . . . . . . . . . . . . . . . . . . . . . . . . 25<br />
B. <strong>Children</strong> With All Work<strong>in</strong>g Parents . . . . . . . . . . . . . . . . . . . . . . . . . . . . . . . . . . . . . . . . . . . . . . . . . . . . . . . . . . . . . 26<br />
C. <strong>Children</strong> Eligible For but Without Child Care Assistance . . . . . . . . . . . . . . . . . . . . . . . . . . . . . . . . . . . . . . . . . . 27<br />
Section VI. Child Care Choices of Cook County Families . . . . . . . . . . . . . . . . . . . . . . . . . . . . . . . . . . . . . . . . . . . . . 29<br />
Conclusion . . . . . . . . . . . . . . . . . . . . . . . . . . . . . . . . . . . . . . . . . . . . . . . . . . . . . . . . . . . . . . . . . . . . . . . . . . . . . . . . . . . . . 31<br />
Footnotes . . . . . . . . . . . . . . . . . . . . . . . . . . . . . . . . . . . . . . . . . . . . . . . . . . . . . . . . . . . . . . . . . . . . . . . . . . . . . . 33<br />
Appendices<br />
Appendix 1: The Six Cook County Regions . . . . . . . . . . . . . . . . . . . . . . . . . . . . . . . . . . . . . . . . . . . . . . . . . . . . . . . . 35<br />
Appendix 2: The Demand <strong>for</strong> and Supply of Child Care—Basic Factors . . . . . . . . . . . . . . . . . . . . . . . . . . . . . . . . 37<br />
Appendix 3: Sources <strong>for</strong> Data on Child Care Providers <strong>in</strong> Cook County . . . . . . . . . . . . . . . . . . . . . . . . . . . . . . . . 39<br />
Glossary of Terms . . . . . . . . . . . . . . . . . . . . . . . . . . . . . . . . . . . . . . . . . . . . . . . . . . . . . . . . . . . . . . . . . . . . . . . . . . . . . . . 40<br />
iii
Executive Summary<br />
F<strong>in</strong>d<strong>in</strong>g the right <strong>child</strong> <strong>care</strong> is one<br />
of the most important decisions that<br />
a parent faces. Quality <strong>child</strong> <strong>care</strong><br />
makes it possible <strong>for</strong> parents to<br />
work, ensures their <strong>child</strong>ren’s health<br />
and safety and provides the developmental<br />
experiences that are crucial<br />
to grow<strong>in</strong>g bodies and m<strong>in</strong>ds.<br />
Each family’s needs are unique,<br />
and f<strong>in</strong>d<strong>in</strong>g the right <strong>child</strong> <strong>care</strong><br />
arrangements is key to a family’s<br />
ability to succeed. That’s why it is<br />
important that parents have access<br />
to a range of <strong>child</strong> <strong>care</strong> options.<br />
This report discusses <strong>child</strong> <strong>care</strong><br />
options available to families <strong>in</strong><br />
Cook County, from <strong>in</strong><strong>for</strong>mal relative,<br />
friend or neighbor <strong>care</strong>, to more<br />
<strong>for</strong>mal licensed home-based <strong>care</strong>,<br />
to the larger <strong>child</strong> <strong>care</strong> center. A<br />
family’s success <strong>in</strong> f<strong>in</strong>d<strong>in</strong>g quality<br />
<strong>child</strong> <strong>care</strong> is based on many factors<br />
<strong>in</strong>clud<strong>in</strong>g the family’s location, a<br />
<strong>child</strong>’s age, the hours of <strong>care</strong> needed,<br />
the amount the family can af<strong>for</strong>d<br />
to pay, a <strong>child</strong>’s specific needs and<br />
the parent’s particular preferences.<br />
The report f<strong>in</strong>ds that, though many<br />
types of <strong>child</strong> <strong>care</strong> exist <strong>in</strong> Cook<br />
County, options that meet the needs<br />
of work<strong>in</strong>g families are severely<br />
limited by the follow<strong>in</strong>g factors.<br />
A F F O R D A B I L I T Y:<br />
• Infant and toddler <strong>care</strong> <strong>in</strong> Cook<br />
County centers is just as expensive<br />
as rent <strong>for</strong> the typical family.<br />
Child <strong>care</strong> <strong>in</strong> centers is more<br />
expensive than the average<br />
tuition and fees at State colleges<br />
and universities <strong>in</strong> Ill<strong>in</strong>ois.<br />
• A family earn<strong>in</strong>g the median<br />
Cook County <strong>in</strong>come would<br />
need to spend 29 to 35 percent<br />
of their <strong>in</strong>come to place an <strong>in</strong>fant<br />
and a preschooler <strong>in</strong> a <strong>child</strong><br />
<strong>care</strong> center.<br />
• Child <strong>care</strong> costs are on the rise.<br />
For families mak<strong>in</strong>g less than<br />
$70,000 per year, license exempt<br />
<strong>care</strong> by a family member, friend<br />
or neighbor is the only type of<br />
<strong>care</strong> that will cost less than<br />
10% of family <strong>in</strong>come.<br />
• Ill<strong>in</strong>ois Child Care Assistance<br />
helps 50,000 families each<br />
month to af<strong>for</strong>d quality <strong>child</strong><br />
<strong>care</strong> <strong>in</strong> Cook County. Nevertheless,<br />
not all families who need<br />
assistance qualify <strong>for</strong> it, and<br />
sometimes even with assistance,<br />
families f<strong>in</strong>d center and licensed<br />
home <strong>child</strong> <strong>care</strong> too costly.<br />
AVA I L A B I L I T Y:<br />
• Parents often f<strong>in</strong>d that <strong>child</strong><br />
<strong>care</strong> homes and centers have no<br />
open<strong>in</strong>gs. This is especially true<br />
<strong>for</strong> parents seek<strong>in</strong>g <strong>in</strong>fant <strong>care</strong>.<br />
S C H E D U L E S :<br />
• 42% of Ill<strong>in</strong>ois parents work<br />
even<strong>in</strong>g, weekend or variable<br />
hours, but only three percent of<br />
<strong>child</strong> <strong>care</strong> centers offer <strong>care</strong> dur<strong>in</strong>g<br />
even<strong>in</strong>g hours, while merely one<br />
percent provide weekend <strong>care</strong>.<br />
• S<strong>in</strong>ce non-traditional work schedules<br />
often go hand <strong>in</strong> hand with<br />
low-<strong>in</strong>come jobs, families seek<strong>in</strong>g<br />
<strong>child</strong> <strong>care</strong> dur<strong>in</strong>g non-traditional<br />
hours are often challenged with<br />
af<strong>for</strong>dability issues as well.<br />
Problems with af<strong>for</strong>dability, availability<br />
and schedul<strong>in</strong>g leave work<strong>in</strong>g parents<br />
with few <strong>child</strong> <strong>care</strong> options.<br />
When parents are <strong>for</strong>ced to make<br />
choices based on the af<strong>for</strong>dability or<br />
availability of <strong>child</strong> <strong>care</strong>, rather than<br />
its quality, <strong>child</strong>ren’s well be<strong>in</strong>g can<br />
be compromised.<br />
We believe that parents should<br />
have choices when select<strong>in</strong>g a<br />
<strong>child</strong> <strong>care</strong> provider and that all <strong>child</strong><br />
<strong>care</strong> providers should have access<br />
to the resources they need to foster<br />
the development and well be<strong>in</strong>g of<br />
our <strong>child</strong>ren.<br />
It is our hope that this report will<br />
serve as a guide and resource<br />
to advocates and policy makers<br />
work<strong>in</strong>g to improve the accessibility<br />
of quality <strong>child</strong> <strong>care</strong> to all families<br />
<strong>in</strong> Cook County and the State<br />
of Ill<strong>in</strong>ois.<br />
1
I N T R O D U C T I O N<br />
Families and Child Care<br />
<strong>in</strong> Cook County<br />
Over one million <strong>child</strong>ren under the<br />
age of 13 live <strong>in</strong> Cook County. A<br />
large proportion, and perhaps a<br />
majority, of these <strong>child</strong>ren receive<br />
regular <strong>care</strong> from someone other<br />
than their parents or guardians:<br />
from another relative, a friend or<br />
neighbor, a family <strong>child</strong> <strong>care</strong> home,<br />
a <strong>child</strong> <strong>care</strong> center, or a park district<br />
or other after-school program.<br />
This 2006 Report on Child Care<br />
<strong>in</strong> Cook County discusses the<br />
employment and economic status<br />
of families who may use <strong>child</strong> <strong>care</strong>,<br />
where <strong>in</strong> Cook County they live and<br />
seek <strong>child</strong> <strong>care</strong>, what type of <strong>care</strong><br />
is available to them and what type<br />
they use. It reports the experiences<br />
of some parents who seek referrals<br />
to <strong>child</strong> <strong>care</strong> providers, exam<strong>in</strong>es<br />
the problems and dilemmas they<br />
face <strong>in</strong> choos<strong>in</strong>g a provider and the<br />
compromises they make.<br />
The 2006 Report also exam<strong>in</strong>es<br />
Cook County’s <strong>child</strong> <strong>care</strong> providers<br />
whose work we can document. It<br />
presents the different sett<strong>in</strong>gs <strong>in</strong><br />
which <strong>child</strong> <strong>care</strong> takes place, the<br />
number of <strong>child</strong>ren <strong>in</strong> each type of<br />
<strong>care</strong> and the fees that parents pay<br />
to different types of providers.<br />
A N O T E O N S U P P LY<br />
A N D D E M A N D<br />
While we subtitle this report “Elements<br />
of Child Care Supply and Demand,”<br />
we want to caution readers that the<br />
factors that determ<strong>in</strong>e the supply of<br />
and demand <strong>for</strong> <strong>child</strong> <strong>care</strong> are numerous<br />
and complex. We cannot simply<br />
EXAMINING COOK COUNTY CHILD CARE BY REGION<br />
Throughout this Report we divide Cook County <strong>in</strong>to six regions to show how<br />
geographic differences can affect parents’ success <strong>in</strong> f<strong>in</strong>d<strong>in</strong>g <strong>child</strong> <strong>care</strong>.<br />
CHICAGO<br />
SUBURBAN COOK COUNTY<br />
1) North and Northwest 4) North and Northwest<br />
2) Central and West 5) West<br />
3) South and Southwest 6) South and Southwest<br />
See Appendix 1 <strong>for</strong> more detailed def<strong>in</strong>itions of these regions.<br />
compare the number of <strong>child</strong> <strong>care</strong><br />
slots and the number of <strong>child</strong>ren <strong>in</strong><br />
need of <strong>care</strong>. Appendix 2 provides<br />
a detailed discussion of the various<br />
elements that <strong>in</strong>fluence both <strong>child</strong> <strong>care</strong><br />
supply and demand and expla<strong>in</strong>s why<br />
an effective analysis can be so complex.<br />
W H AT T Y P E S O F C H I L D<br />
C A R E A R E AVA I L A B L E ?<br />
A family’s success <strong>in</strong> f<strong>in</strong>d<strong>in</strong>g quality<br />
<strong>child</strong> <strong>care</strong> is based on many factors<br />
<strong>in</strong>clud<strong>in</strong>g the family’s location, a<br />
<strong>child</strong>’s age, the hours of <strong>care</strong> needed,<br />
the amount the family can af<strong>for</strong>d<br />
to pay, a <strong>child</strong>’s specific needs and<br />
the parent’s particular preferences.<br />
Assum<strong>in</strong>g <strong>for</strong> a moment that families<br />
can access all types of <strong>child</strong> <strong>care</strong>,<br />
let’s look at the available options.<br />
Many families only use parental<br />
<strong>care</strong>. Either one parent stays home<br />
to <strong>care</strong> <strong>for</strong> the <strong>child</strong>ren, or the parents<br />
stagger their schedules so one<br />
can <strong>care</strong> <strong>for</strong> the <strong>child</strong>ren while the<br />
other works, goes to school or fulfills<br />
other responsibilities.<br />
Parents who need or want to look<br />
beyond parental <strong>care</strong> may like the<br />
idea of a home <strong>child</strong> <strong>care</strong> sett<strong>in</strong>g.<br />
They may take their <strong>child</strong> to the<br />
home of someone they know well,<br />
such as a family member, friend or<br />
neighbor, or someone they discovered<br />
through word of mouth or<br />
through a referral service. They<br />
might also choose a <strong>care</strong>giver who<br />
can provide <strong>care</strong> <strong>in</strong> the <strong>child</strong>’s<br />
home, as a nanny does.<br />
Many home-based <strong>child</strong> <strong>care</strong><br />
providers, especially those who provide<br />
<strong>care</strong> as an on-go<strong>in</strong>g profession,<br />
choose to become licensed. This<br />
means the <strong>care</strong> provided <strong>in</strong> their<br />
homes is regulated by the Ill<strong>in</strong>ois<br />
Department of <strong>Children</strong> and Family<br />
Services (DCFS) as well as their<br />
local licens<strong>in</strong>g agency if one exists.<br />
Throughout this report we refer to<br />
these <strong>care</strong>givers as licensed home<br />
providers, and we refer to those<br />
without licenses as license-exempt<br />
home providers or as family, friend<br />
or neighbor <strong>care</strong>. (See the glossary<br />
<strong>for</strong> detailed def<strong>in</strong>itions of these<br />
terms.) License-exempt home <strong>child</strong><br />
3
The 2006 Report of Child Care <strong>in</strong> Cook County<br />
<strong>care</strong> can be provided <strong>in</strong> the home of<br />
the <strong>care</strong>giver or the <strong>child</strong>.<br />
Parents also have the option of<br />
tak<strong>in</strong>g their <strong>child</strong> to a <strong>child</strong> <strong>care</strong><br />
center. While most of these facilities<br />
are licensed by DCFS, certa<strong>in</strong><br />
centers are exempt from be<strong>in</strong>g<br />
licensed, <strong>in</strong>clud<strong>in</strong>g those based <strong>in</strong><br />
schools or affiliated with religious<br />
groups. Center <strong>care</strong> might <strong>in</strong>clude<br />
all-day <strong>child</strong> <strong>care</strong> programs, be<strong>for</strong>eand<br />
after-school programs (<strong>in</strong>clud<strong>in</strong>g<br />
those provided by park districts<br />
and YMCAs), as well as part-day or<br />
part-week preschool programs.<br />
It is important to note that preschool<br />
programs do not fill the same role<br />
as <strong>child</strong> <strong>care</strong>. The <strong>in</strong>tent of preschool<br />
is not to <strong>care</strong> <strong>for</strong> <strong>child</strong>ren<br />
so parents can go to work, school,<br />
etc. but to provide <strong>child</strong>ren with<br />
early learn<strong>in</strong>g experiences to prepare<br />
them <strong>for</strong> k<strong>in</strong>dergarten. However,<br />
many <strong>child</strong> <strong>care</strong> centers do an<br />
excellent job of <strong>in</strong>corporat<strong>in</strong>g early<br />
learn<strong>in</strong>g activities <strong>in</strong>to their programs,<br />
and a grow<strong>in</strong>g number of public<br />
preschool programs (Head Start<br />
and Preschool <strong>for</strong> All) are extend<strong>in</strong>g<br />
their hours or collaborat<strong>in</strong>g with<br />
<strong>child</strong> <strong>care</strong> programs <strong>in</strong> order to<br />
meet families’ full-day <strong>child</strong> <strong>care</strong><br />
needs.<br />
HOW DO FA M I L I E S F I N D<br />
C H I L D C A R E ?<br />
Families seek <strong>child</strong> <strong>care</strong> by ask<strong>in</strong>g<br />
relatives or friends <strong>for</strong> referrals, look<strong>in</strong>g<br />
at notices and advertisements,<br />
and visit<strong>in</strong>g <strong>child</strong> <strong>care</strong> centers <strong>in</strong><br />
their communities. The State of<br />
Ill<strong>in</strong>ois offers a resource <strong>for</strong> families<br />
<strong>in</strong> the <strong>for</strong>m of a referral service.<br />
Ill<strong>in</strong>ois <strong>Action</strong> <strong>for</strong> <strong>Children</strong> adm<strong>in</strong>isters<br />
this service <strong>for</strong> families <strong>in</strong> Cook<br />
County. The Ill<strong>in</strong>ois <strong>Action</strong> <strong>for</strong><br />
<strong>Children</strong> Resource and Referral<br />
Program ma<strong>in</strong>ta<strong>in</strong>s a database of<br />
<strong>child</strong> <strong>care</strong> providers who register<br />
voluntarily to be referred to parents.<br />
The providers supply detailed <strong>in</strong><strong>for</strong>mation<br />
about their programs so the<br />
referral consultants can help parents<br />
f<strong>in</strong>d providers that match their<br />
needs and preferences. Referral<br />
consultants also educate parents on<br />
what constitutes quality <strong>child</strong> <strong>care</strong><br />
so parents are more equipped to<br />
evaluate the programs they visit.<br />
W H AT I S T H E T Y P I C A L<br />
FA M I LY E X P E R I E N C E ?<br />
While many parents and guardians<br />
are quite satisfied with the <strong>care</strong> their<br />
<strong>child</strong>ren receive, many f<strong>in</strong>d the process<br />
of search<strong>in</strong>g <strong>for</strong> and decid<strong>in</strong>g<br />
on a <strong>child</strong> <strong>care</strong> provider stressful.<br />
They frequently have trouble f<strong>in</strong>d<strong>in</strong>g<br />
the right <strong>care</strong> at the right hours,<br />
right location and right price.<br />
Families search <strong>for</strong> <strong>child</strong> <strong>care</strong> under<br />
vastly different circumstances, and<br />
no one family’s story can represent<br />
them all. Still, we shall <strong>in</strong>troduce<br />
several “typical” families, and discuss<br />
the different dimensions of<br />
their <strong>child</strong> <strong>care</strong> needs <strong>in</strong> an attempt<br />
to convey someth<strong>in</strong>g of the complex<br />
problems and hard decisions Cook<br />
County families face <strong>in</strong> arrang<strong>in</strong>g<br />
their <strong>child</strong> <strong>care</strong>.<br />
4
Introduction<br />
JENNIFER ACOSTA AND<br />
HER FOUR-YEAR-OLD SON<br />
DENISE AND IVAN WILLIAMS<br />
AND THEIR 10-MONTH-OLD<br />
DAUGHTER<br />
REGINA THOMAS AND<br />
HER 3-YEAR-OLD AND<br />
7-YEAR-OLD DAUGHTERS<br />
Jennifer is a s<strong>in</strong>gle mother who works<br />
full-time. She recently obta<strong>in</strong>ed a steady<br />
job that pays her just over m<strong>in</strong>imum<br />
wage, $6.85 per hour or $14,248 each<br />
year. Jennifer lives with her mother who<br />
also works full-time dur<strong>in</strong>g the day at a<br />
m<strong>in</strong>imum wage job. Jennifer needs fullday<br />
<strong>child</strong> <strong>care</strong>. While her <strong>in</strong>come makes<br />
her son eligible <strong>for</strong> free early education<br />
programs such as the preschool class<br />
offered at the nearby public elementary<br />
school, this program is only 2-1/2 hours<br />
each day. To take advantage of free<br />
preschool, Jennifer would need to f<strong>in</strong>d<br />
a <strong>child</strong> <strong>care</strong> center with a preschool<br />
program on site or a provider who can<br />
transport her son to and from the<br />
elementary school’s preschool program.<br />
Denise and Ivan both work full-time.<br />
Together they work 60 hours per week<br />
<strong>in</strong> one full-time job and two part-time<br />
jobs. They earn about $32,500 each<br />
year, too much <strong>for</strong> a family of three to<br />
receive Ill<strong>in</strong>ois Child Care Assistance.<br />
(The maximum allowed is $30,369.)<br />
Although they have some relatives<br />
nearby, none can provide <strong>care</strong> <strong>for</strong> their<br />
daughter dur<strong>in</strong>g their daytime work<br />
hours. A nice neighbor offered to<br />
provide <strong>care</strong> at $100 per week ($2.50<br />
per hour), or about 16 percent of their<br />
<strong>in</strong>come. The neighbor is sometimes ill,<br />
however, or must take her own <strong>child</strong> to<br />
the doctor. Dur<strong>in</strong>g those times Denise<br />
or Ivan have to stay home from work<br />
to <strong>care</strong> <strong>for</strong> their daughter.<br />
They realize that if they quit the most<br />
irregular of their part-time jobs, they<br />
would not lose much. Their <strong>in</strong>come would<br />
drop by $2,308 to below $30,369,<br />
mak<strong>in</strong>g them eligible <strong>for</strong> Ill<strong>in</strong>ois Child<br />
Care Assistance. By quitt<strong>in</strong>g that job,<br />
the family would ga<strong>in</strong> <strong>in</strong> Child Care<br />
Assistance much of what they would<br />
lose <strong>in</strong> <strong>in</strong>come, and also ga<strong>in</strong> about<br />
18 hours of free time each month.<br />
They are consider<strong>in</strong>g do<strong>in</strong>g this but are<br />
uncom<strong>for</strong>table about it. Instead they<br />
hope to f<strong>in</strong>d better full-time jobs.<br />
Reg<strong>in</strong>a has a full-time job as a retail<br />
sales manager earn<strong>in</strong>g $59,000 per<br />
year. This <strong>in</strong>come is above the median<br />
<strong>in</strong>come of families with <strong>child</strong>ren <strong>in</strong><br />
Cook County, which is about $54,000.<br />
Reg<strong>in</strong>a’s job, however, requires her to<br />
work afternoons and even<strong>in</strong>gs. While<br />
she is happy that she can take her<br />
seven-year-old to school each morn<strong>in</strong>g<br />
and spend the day with her three-yearold,<br />
she regrets that she is not there <strong>for</strong><br />
them after school or <strong>in</strong> the even<strong>in</strong>gs.<br />
She is <strong>in</strong> search of a provider who can<br />
help her older daughter with homework<br />
<strong>in</strong> a com<strong>for</strong>table sett<strong>in</strong>g. She is also<br />
explor<strong>in</strong>g ways she can beg<strong>in</strong> to<br />
socialize her three-year-old to get her<br />
ready <strong>for</strong> school.<br />
5
I. Family Dilemma:<br />
Child Care Af<strong>for</strong>dability<br />
A .<br />
THE COST OF CHILD CARE<br />
Each year, the Ill<strong>in</strong>ois <strong>Action</strong> <strong>for</strong><br />
<strong>Children</strong> Resource and Referral<br />
Program asks providers to report<br />
the rates they charge parents.<br />
Tables I-1 and I-2 present the average<br />
market rates that 697 <strong>child</strong> <strong>care</strong><br />
centers and 2,634 homes respectively<br />
charge <strong>in</strong> the six regions of<br />
Cook County. Centers average<br />
between $126 and $259 each week<br />
to <strong>care</strong> <strong>for</strong> <strong>child</strong>ren under age six.<br />
Home providers charge an average<br />
of $109 to $187 weekly, depend<strong>in</strong>g<br />
upon age and region. The last rows<br />
of both tables show the rates that<br />
the Ill<strong>in</strong>ois Child Care Assistance<br />
Program reimburses Cook County<br />
providers. We will discuss these<br />
rates further <strong>in</strong> Section I-D.<br />
Tables I-1 and I-2 show that sharp<br />
differences occur <strong>in</strong> <strong>child</strong> <strong>care</strong> rates<br />
depend<strong>in</strong>g upon the region <strong>in</strong> which<br />
the <strong>care</strong> occurs and the age of the<br />
<strong>child</strong>. In <strong>child</strong> <strong>care</strong>, it is well-known<br />
that the younger the <strong>child</strong>ren, the<br />
more expensive it is to provide their<br />
<strong>care</strong>, largely because of the extra<br />
<strong>care</strong> and attention younger <strong>child</strong>ren<br />
require.<br />
The South and Southwestern regions<br />
of both Chicago and suburban<br />
Cook County generally have the<br />
lowest rates. These regions also<br />
have lower average <strong>in</strong>comes and<br />
higher numbers of <strong>child</strong> <strong>care</strong><br />
providers. [See Section II.] Private<br />
and public sector entrepreneurs<br />
have been relatively successful <strong>in</strong><br />
build<strong>in</strong>g needed <strong>child</strong> <strong>care</strong> capacity<br />
Table I-1. Child Care Center Full-Time Weekly Rates<br />
Licensed and License-Exempt Centers, FY2006.<br />
Source: Ill<strong>in</strong>ois <strong>Action</strong> <strong>for</strong> <strong>Children</strong> Resource and Referral Program<br />
2- 5- Be<strong>for</strong>e<br />
year- 3- to 4- year- or After<br />
Infant Toddler old year-old old & K School<br />
N & NW Chicago $211 $199 $168 $150 $145 $92<br />
C & W Chicago $204 $202 $179 $158 $155 $120<br />
S & SW Chicago $161 $159 $141 $127 $126 $100<br />
N & NW Suburban Cook $259 $236 $209 $187 $181 $119<br />
West Suburban Cook $208 $189 $168 $151 $149 $92<br />
S & SW Suburban Cook $185 $174 $158 $139 $135 $105<br />
IDHS Full Time<br />
Payment Rates $179.80 $155.40 $127.20 $63.60<br />
Table I-2. Child Care Home Full-Time Weekly Rates<br />
Licensed Homes, FY2006.<br />
Source: Ill<strong>in</strong>ois <strong>Action</strong> <strong>for</strong> <strong>Children</strong> Resource and Referral Program<br />
2- 5- Be<strong>for</strong>e<br />
year- 3- to 4- year- or After<br />
Infant Toddler old year-old old & K School<br />
N & NW Chicago $153 $149 $144 $139 $134 $108<br />
C & W Chicago $124 $120 $116 $112 $109 $90<br />
S & SW Chicago $123 $119 $117 $113 $110 $90<br />
N & NW Suburban Cook $187 $183 $180 $177 $171 $125<br />
West Suburban Cook $143 $137 $134 $130 $126 $97<br />
S & SW Suburban Cook $124 $120 $117 $113 $110 $87<br />
IDHS Full Time<br />
Payment Rates $117 $115.25 $110.50 $55.25<br />
6
<strong>in</strong> many of these communities, and<br />
this more plentiful supply might<br />
keep their average rates lower.<br />
An unusual f<strong>in</strong>d<strong>in</strong>g <strong>in</strong> the Central<br />
and West Chicago region is that<br />
home <strong>child</strong> <strong>care</strong> rates are low while<br />
center rates are the second highest<br />
of all regions. The explanation is<br />
that this region <strong>in</strong>cludes central<br />
Chicago which is relatively wealthy<br />
as well as the west side of Chicago<br />
which is one of the poorest areas <strong>in</strong><br />
the <strong>county</strong>. N<strong>in</strong>ety-two percent of<br />
the home providers <strong>in</strong> this region are<br />
located <strong>in</strong> the western portion, while<br />
centers are distributed more evenly<br />
throughout.<br />
In the next section we show how<br />
average <strong>child</strong> <strong>care</strong> center rates generally<br />
have <strong>in</strong>creased four to six percent<br />
per year s<strong>in</strong>ce 2000, with the<br />
exception of Chicago <strong>in</strong>fant and toddler<br />
center rates which have risen<br />
one percent per year. Between 2005<br />
and 2006, however, there were two<br />
noteworthy exceptions. In the North<br />
and Northwest suburbs, average<br />
center rates <strong>in</strong>creased eight to ten<br />
percent <strong>for</strong> <strong>in</strong>fant through four-yearold<br />
<strong>care</strong>, 13 percent <strong>for</strong> five-year-old<br />
and k<strong>in</strong>dergarten <strong>care</strong>, and as much<br />
as 19 percent <strong>for</strong> be<strong>for</strong>e- and afterschool<br />
<strong>care</strong>. At the same time, <strong>in</strong><br />
the South and Southwestern region<br />
of Chicago, average <strong>in</strong>fant and toddler<br />
center rates actually decreased,<br />
down five percent and two percent<br />
respectively from 2005. (We should<br />
note that long-term trends are more<br />
reliable than the year-to-year changes<br />
if a different mix of establishments is<br />
report<strong>in</strong>g rates each year.)<br />
B.<br />
T R E N D S I N C H I L D<br />
C A R E R AT E S<br />
Like most expenses, <strong>child</strong> <strong>care</strong><br />
costs tend to rise every year. Table<br />
I-3 presents the aggregate rate<br />
<strong>in</strong>creases <strong>in</strong> centers and family <strong>child</strong><br />
<strong>care</strong> homes <strong>for</strong> Chicago and suburban<br />
Cook County. The dollar columns<br />
show the most recent rates <strong>for</strong> each<br />
age group. Next to each rate is a<br />
column that presents the percent<br />
<strong>in</strong>crease over the six years from July<br />
2000 to July 2006. Increases ranged<br />
from 4 to 57 percent. Over the same<br />
period of time, all consumer prices<br />
rose about 18 percent nationally. 1<br />
Some <strong>child</strong> <strong>care</strong> rates rose below<br />
that average <strong>in</strong>flation rate, but many<br />
far exceeded that rate, especially<br />
center rates.<br />
While the average cost of <strong>child</strong> <strong>care</strong><br />
<strong>for</strong> all age groups is higher <strong>in</strong> suburban<br />
Cook County than <strong>in</strong> Chicago,<br />
Chicago has experienced more rapid<br />
rate <strong>in</strong>creases over the last five years<br />
than has suburban Cook County.<br />
This is the case <strong>for</strong> both center and<br />
home <strong>care</strong> <strong>for</strong> all age groups, with<br />
the exception of <strong>in</strong>fant and toddler<br />
center <strong>care</strong>.<br />
In another notable trend, be<strong>for</strong>eand<br />
after-school <strong>care</strong> rates have<br />
generally risen faster than other<br />
types of <strong>care</strong>, especially <strong>in</strong> Chicago.<br />
Overall, the more rapid growth <strong>in</strong><br />
<strong>child</strong> <strong>care</strong> rates occurred <strong>in</strong> centers<br />
rather than among homes. Two<br />
important exceptions where home<br />
rates outpaced those of centers<br />
were <strong>in</strong>fant and toddler <strong>care</strong> <strong>in</strong><br />
Chicago and be<strong>for</strong>e- and after-school<br />
<strong>care</strong> <strong>in</strong> suburban Cook County. It<br />
Table I-3. 2006 Average Weekly Market Rates and Rate Increases S<strong>in</strong>ce 2000<br />
Source: Ill<strong>in</strong>ois <strong>Action</strong> <strong>for</strong> <strong>Children</strong> Resource and Referral Program. Rounded to the nearest dollar or percent.<br />
Growth Growth Suburban Growth Suburban Growth<br />
Chicago S<strong>in</strong>ce Chicago S<strong>in</strong>ce Cook S<strong>in</strong>ce Cook S<strong>in</strong>ce<br />
Age Centers 2000 Homes 2000 Centers 2000 Homes 2000<br />
Infant $182 4% $128 15% $223 23% $145 9%<br />
Toddler $177 7% $124 16% $204 24% $140 10%<br />
2-year-old $154 35% $121 17% $182 30% $137 9%<br />
3- to 4-year-old $139 31% $117 17% $162 28% $133 8%<br />
5-year-old $136 30% $113 16% $158 26% $128 7%<br />
Be<strong>for</strong>e or After School $102 57% $92 52% $107 34% $95 39%<br />
School-Age Summer $129 48% $110 27% $144 20% $117 18%<br />
7
The 2006 Report of Child Care <strong>in</strong> Cook County<br />
appears, then, that Cook County<br />
parents—or those who can af<strong>for</strong>d to<br />
pay <strong>for</strong> <strong>care</strong>—have a demand <strong>for</strong><br />
center <strong>care</strong> grow<strong>in</strong>g faster than their<br />
demand <strong>for</strong> home <strong>care</strong>, especially <strong>in</strong><br />
the ages above toddler.<br />
C.<br />
W H AT P E R C E N T O F<br />
I N C O M E I S R E A S O N A B L E<br />
TO SPEND ON CHILD CARE?<br />
The data are clear: <strong>child</strong> <strong>care</strong><br />
places a large f<strong>in</strong>ancial burden on<br />
families. Accord<strong>in</strong>g to the U.S.<br />
Census, the typical (median) <strong>in</strong>come<br />
<strong>for</strong> families with <strong>child</strong>ren under 18 <strong>in</strong><br />
Cook County was $54,719 be<strong>for</strong>e<br />
taxes <strong>in</strong> 2005, and even lower <strong>for</strong><br />
Chicago families at $40,331. 2 Care<br />
<strong>for</strong> one <strong>in</strong>fant <strong>in</strong> a Chicago <strong>child</strong><br />
<strong>care</strong> center, at an average cost of<br />
$182 per week, or $9,100 over a<br />
fifty-week year, costs 23 percent of<br />
a typical Chicago family’s <strong>in</strong>come.<br />
At $8,850 per year, toddler <strong>care</strong><br />
takes up almost as much. Licensed<br />
home <strong>care</strong> <strong>for</strong> an <strong>in</strong>fant or toddler is<br />
more af<strong>for</strong>dable at $6,200 to<br />
$6,400 per year, but even this is 15<br />
to 16 percent of a family’s <strong>in</strong>come.<br />
The median rent <strong>in</strong> Chicago <strong>in</strong> 2005<br />
was $9,396, accord<strong>in</strong>g to the same<br />
U.S. Census report. By this measure,<br />
<strong>in</strong>fant and toddler <strong>care</strong> <strong>in</strong><br />
Chicago centers is just as expensive<br />
as rent <strong>for</strong> the typical Chicago<br />
family. Similarly, <strong>child</strong> <strong>care</strong> is more<br />
expensive than average fees and<br />
tuition at State colleges and universities<br />
<strong>in</strong> Ill<strong>in</strong>ois. At $7,875, these<br />
average fees and tuition cover 87<br />
percent of the cost of <strong>in</strong>fant <strong>care</strong> <strong>in</strong><br />
Chicago centers and only 71 percent<br />
of the cost of <strong>in</strong>fant <strong>care</strong> <strong>in</strong><br />
suburban Cook centers. 3<br />
Is 16 percent of a family’s <strong>in</strong>come<br />
too much to pay <strong>for</strong> an <strong>in</strong>fant’s <strong>child</strong><br />
<strong>care</strong>? Is 31 percent too much to pay<br />
<strong>for</strong> an <strong>in</strong>fant and a toddler? What is<br />
the proper proportion between <strong>child</strong><br />
<strong>care</strong> expenses and <strong>in</strong>come? There<br />
is no generally accepted level that<br />
everyone agrees is the “proper”<br />
percentage to pay.<br />
Researchers have calculated the<br />
amount that families actually pay. Most<br />
national studies s<strong>in</strong>ce the 1990s found<br />
that average two-parent middle<strong>in</strong>come<br />
families paid between six<br />
percent and ten percent of their<br />
<strong>in</strong>come <strong>for</strong> <strong>child</strong> <strong>care</strong>. 4 If, <strong>for</strong> illustration,<br />
we pick the higher, ten percent<br />
level as a rule of thumb, we calculate<br />
that a family <strong>in</strong> 2007 would have to<br />
earn $91,000 <strong>for</strong> a s<strong>in</strong>gle <strong>in</strong>fant <strong>in</strong><br />
Chicago center <strong>care</strong> and just over<br />
$160,000 <strong>for</strong> both an <strong>in</strong>fant and<br />
four-year-old <strong>in</strong> a Chicago center to<br />
keep their <strong>child</strong> <strong>care</strong> costs with<strong>in</strong><br />
10 percent of their <strong>in</strong>come. To meet<br />
the 10 percent rule of thumb <strong>in</strong><br />
suburban Cook County centers, a<br />
family pay<strong>in</strong>g <strong>for</strong> <strong>in</strong>fant <strong>care</strong> would<br />
require an <strong>in</strong>come of $111,500,<br />
while center <strong>care</strong> <strong>for</strong> both an <strong>in</strong>fant<br />
and a four-year-old would require an<br />
<strong>in</strong>come of $192,500. 5<br />
D.<br />
H E L P I N G PA R E N T S<br />
MEET THE COST<br />
OF CHILD CARE<br />
Several government-funded<br />
resources exist to help families pay<br />
<strong>for</strong> their <strong>child</strong> <strong>care</strong> costs, and <strong>child</strong><br />
<strong>care</strong> providers themselves often<br />
have tuition policies to assist families<br />
who struggle to pay.<br />
The ma<strong>in</strong> source of f<strong>in</strong>ancial assistance<br />
to help Ill<strong>in</strong>ois parents with<br />
<strong>child</strong> <strong>care</strong> costs is the Ill<strong>in</strong>ois Child<br />
Care Assistance Program. A family<br />
eligible <strong>for</strong> this program chooses a<br />
<strong>child</strong> <strong>care</strong> provider and the State<br />
reimburses this provider <strong>for</strong> his or<br />
her services. Parents pay a portion<br />
of the cost of <strong>care</strong>, a co-payment,<br />
which depends on the family’s size<br />
and <strong>in</strong>come. Ill<strong>in</strong>ois Child Care<br />
Assistance is available to families<br />
that earn at or below 50 percent of<br />
the state median <strong>in</strong>come, or $36,192<br />
<strong>for</strong> a family of four <strong>in</strong> 2006. Parents<br />
must work or participate <strong>in</strong> an<br />
approved school or tra<strong>in</strong><strong>in</strong>g program<br />
to be eligible. The Ill<strong>in</strong>ois Child Care<br />
Assistance Program is primarily a<br />
voucher system, which is adm<strong>in</strong>istered<br />
<strong>in</strong> Cook County by Ill<strong>in</strong>ois <strong>Action</strong><br />
<strong>for</strong> <strong>Children</strong> under contract with the<br />
Ill<strong>in</strong>ois Department of Human Services<br />
(IDHS). Some <strong>child</strong> <strong>care</strong> centers,<br />
however, have direct contracts with<br />
IDHS to serve families eligible <strong>for</strong><br />
Ill<strong>in</strong>ois Child Care Assistance.<br />
Another state program that provides<br />
<strong>child</strong> <strong>care</strong> assistance, but to a more<br />
specific population, is the Department<br />
of <strong>Children</strong> and Family Services<br />
(DCFS). DCFS provides <strong>child</strong> <strong>care</strong><br />
vouchers primarily to families with<br />
foster <strong>child</strong>ren.<br />
Beyond government-funded programs,<br />
a number of <strong>child</strong> <strong>care</strong> providers<br />
offer their own <strong>for</strong>ms of <strong>child</strong> <strong>care</strong><br />
assistance. These <strong>in</strong>clude discounts<br />
<strong>for</strong> parents with more than one <strong>child</strong><br />
<strong>in</strong> their <strong>care</strong>, slid<strong>in</strong>g scale fees based<br />
on a family’s ability to pay, scholarships<br />
and negotiable rates. Some<br />
providers will accept the Ill<strong>in</strong>ois<br />
Child Care Assistance reimbursement<br />
as full payment even though<br />
the amount they receive through the<br />
program may be less than what the<br />
providers typically charge.<br />
8
I. Family Dilemma: Child Care Af<strong>for</strong>dability<br />
WHICH FA M I L I E S A R E E L I G I B L E T O R E C E I V E C H I L D C A R E A S S I S TA N C E ?<br />
JENNIFER ACOSTA: WORKING<br />
MOM WITH FOUR-YEAR-OLD.<br />
INCOME IS $14,248 A YEAR.<br />
Jennifer is eligible <strong>for</strong> Child Care<br />
Assistance. She will need to pay a copayment<br />
of $86.66 per month, or 7<br />
percent of her gross <strong>in</strong>come. If she<br />
chooses a <strong>child</strong> <strong>care</strong> provider who<br />
charges more than the Assistance<br />
program pays, she may have to make<br />
additional payments. If she has an<br />
available relative, friend or neighbor to<br />
provide <strong>care</strong>, they might be more will<strong>in</strong>g<br />
to waive all or part of her co-payment or<br />
be more flexible with when she has to<br />
make her co-payments.<br />
DENISE AND IVAN WILLIAMS:<br />
WORKING PARENTS WITH<br />
INFANT. INCOME IS $32,500.<br />
Though each parent earns little more<br />
than m<strong>in</strong>imum wage, this family is over<br />
the <strong>in</strong>come limit <strong>for</strong> Child Care<br />
Assistance <strong>for</strong> a family of three<br />
($30,369). They will need to cover the<br />
full cost of <strong>child</strong> <strong>care</strong> on their own<br />
unless they quit one job or otherwise<br />
reduce their <strong>in</strong>come enough to be<br />
eligible <strong>for</strong> Assistance.<br />
REGINA THOMAS: WORKING<br />
MOM WITH THREE-YEAR-OLD<br />
AND SEVEN-YEAR-OLD.<br />
INCOME IS $59,000.<br />
Reg<strong>in</strong>a’s <strong>in</strong>come is far above 50 percent<br />
of the state median <strong>in</strong>come <strong>for</strong> a family<br />
of three ($30,369) so she is not eligible<br />
<strong>for</strong> Assistance. Perhaps she can f<strong>in</strong>d a<br />
<strong>child</strong> <strong>care</strong> provider who offers a reduced<br />
price <strong>for</strong> hav<strong>in</strong>g two <strong>child</strong>ren <strong>in</strong> <strong>care</strong>.<br />
E.<br />
CHILD CARE<br />
A F F O R D A B I L I T Y<br />
W I T H A S S I S TA N C E<br />
The Ill<strong>in</strong>ois Child Care Assistance<br />
Program was designed to help work<strong>in</strong>g<br />
parents who earn less than 50<br />
percent of the state’s median family<br />
<strong>in</strong>come af<strong>for</strong>d <strong>child</strong> <strong>care</strong>. Child <strong>care</strong><br />
advocates and policy makers are<br />
keenly <strong>in</strong>terested <strong>in</strong> whether the program<br />
enables low-<strong>in</strong>come parents <strong>in</strong><br />
Cook County to af<strong>for</strong>d quality <strong>care</strong>.<br />
While Tables I-1 and I-2 above do<br />
not answer this question completely,<br />
they suggest an answer. The last<br />
row of each table presents how<br />
much the Assistance Program pays<br />
to providers <strong>for</strong> different types of<br />
<strong>care</strong>. As these rows <strong>in</strong>dicate, the<br />
rates that the Assistance Program<br />
pays to Cook County centers and<br />
homes <strong>in</strong> almost all cases fall below<br />
the average rates that centers and<br />
homes actually charge parents.<br />
Under the Ill<strong>in</strong>ois Child Care<br />
Assistance Program, parents must<br />
make a co-payment. They pay the<br />
provider a part of the Assistance<br />
rate listed <strong>in</strong> Tables I-1 and I-2. The<br />
amount of a family’s co-payment<br />
depends on <strong>in</strong>come. A family of<br />
three must pay at least $1.00 and<br />
as much as $49.00 per week with<br />
one <strong>child</strong> <strong>in</strong> <strong>care</strong> (or $84 <strong>for</strong> two<br />
<strong>child</strong>ren). Parents may also face an<br />
additional payment. S<strong>in</strong>ce the average<br />
provider <strong>in</strong> Cook County charges<br />
more than what the Assistance<br />
Program will pay them, parents may<br />
also have to pay that difference <strong>in</strong><br />
addition to their co-payments (or<br />
else they must conv<strong>in</strong>ce their<br />
providers to accept a lower payment<br />
than they normally charge).<br />
It is fair to conclude that even after<br />
receiv<strong>in</strong>g Child Care Assistance, a<br />
family’s choice of provider and the<br />
quality of options available to it can<br />
rema<strong>in</strong> seriously limited. While we<br />
have hearsay evidence that some<br />
providers do work with the family to<br />
determ<strong>in</strong>e an acceptable rate, many<br />
providers cannot af<strong>for</strong>d to reduce<br />
their rates to meet a family’s ability<br />
to pay.<br />
Figure I-1 (on the next page) develops<br />
the story of <strong>child</strong> <strong>care</strong> af<strong>for</strong>dability<br />
with Ill<strong>in</strong>ois Child Care Assistance<br />
9
The 2006 Report of Child Care <strong>in</strong> Cook County<br />
Figure I-1. What Families Need to Spend on Child Care<br />
Family Size of 4, 1 Child <strong>in</strong> Care<br />
30%<br />
25%<br />
Type of Care<br />
Center—Infant<br />
Percent of Family Income<br />
20%<br />
15%<br />
10%<br />
5%<br />
0%<br />
$10,000<br />
$15,000<br />
<strong>in</strong> more detail, <strong>in</strong> this case <strong>for</strong> a<br />
family of four <strong>in</strong> Cook County. 6<br />
It presents the cost of <strong>care</strong> <strong>for</strong> just<br />
one <strong>child</strong> as a percentage of different<br />
family <strong>in</strong>comes rang<strong>in</strong>g from<br />
$10,000 to $200,000. The chart’s<br />
four l<strong>in</strong>es are cost l<strong>in</strong>es, with the<br />
highest cost l<strong>in</strong>e represent<strong>in</strong>g the<br />
high price of center <strong>care</strong> <strong>for</strong> an<br />
<strong>in</strong>fant and the lowest cost l<strong>in</strong>e represent<strong>in</strong>g<br />
the more af<strong>for</strong>dable price of<br />
family, friend or neighbor <strong>care</strong> <strong>for</strong> an<br />
older <strong>child</strong>. The four k<strong>in</strong>ds of <strong>child</strong><br />
<strong>care</strong> costs appear as percentages<br />
of each <strong>in</strong>come level that is measured<br />
on the horizontal axis. The<br />
chart is realistic <strong>in</strong> the sense that it<br />
<strong>in</strong>cludes the effect of receiv<strong>in</strong>g<br />
Ill<strong>in</strong>ois Child Care Assistance,<br />
which is available to low <strong>in</strong>come if<br />
all present parents are employed. 7<br />
$20,000<br />
$25,000<br />
$28,000<br />
$30,000<br />
$33,000<br />
$37,000<br />
$40,000<br />
$50,000<br />
$60,000<br />
Family Income<br />
Figure I-1 shows Cook County parents<br />
can pay less than five percent<br />
of family <strong>in</strong>come (<strong>for</strong> <strong>in</strong><strong>for</strong>mal neighbor<br />
<strong>child</strong> <strong>care</strong>) and as much as<br />
28 percent (<strong>for</strong> <strong>in</strong>fant center <strong>care</strong>)<br />
<strong>for</strong> one <strong>child</strong>, depend<strong>in</strong>g on their<br />
level of <strong>in</strong>come, the age of the <strong>child</strong><br />
and type of <strong>care</strong> they use. Note that<br />
Figure I-1 builds upon average rates<br />
of <strong>care</strong> such as those <strong>in</strong> Tables I-1<br />
and I-2. Some parents might have to<br />
pay a higher rate than the average<br />
while others will pay below the average.<br />
Plac<strong>in</strong>g more <strong>child</strong>ren <strong>in</strong> <strong>care</strong>,<br />
moreover, will cost parents more.<br />
Beg<strong>in</strong>n<strong>in</strong>g with a family with almost<br />
no <strong>in</strong>come on the left and mov<strong>in</strong>g<br />
up to a family <strong>in</strong>come of about<br />
$35,000, we see that a family of<br />
four would spend between 6 percent<br />
and 17 percent of its <strong>in</strong>come<br />
<strong>for</strong> full-time <strong>care</strong> <strong>for</strong> one <strong>child</strong>,<br />
depend<strong>in</strong>g on age and type of <strong>care</strong>.<br />
10<br />
$70,000<br />
$80,000<br />
$90,000<br />
$100,000<br />
$120,000<br />
$130,000<br />
$150,000<br />
$200,000<br />
Center—Age 3<br />
Licensed Home<br />
Neighbor<br />
It is Ill<strong>in</strong>ois Child Care Assistance<br />
alone that makes it possible <strong>for</strong><br />
<strong>child</strong> <strong>care</strong> to cost this little <strong>for</strong><br />
work<strong>in</strong>g families with these low<br />
<strong>in</strong>comes. If the work<strong>in</strong>g family’s<br />
<strong>in</strong>come rises above $36,000, the<br />
family ceases to be eligible <strong>for</strong><br />
Ill<strong>in</strong>ois Child Care Assistance and<br />
most <strong>child</strong> <strong>care</strong> costs shoot up to<br />
a prohibitively high percentage of<br />
the family’s <strong>in</strong>come (from 17 to 28<br />
percent).<br />
Only family, friend and neighbor<br />
<strong>care</strong> changes little as a percentage<br />
of <strong>in</strong>come and rema<strong>in</strong>s af<strong>for</strong>dable<br />
<strong>for</strong> families earn<strong>in</strong>g just over $36,000.<br />
Consider the example of ten-percentof-<strong>in</strong>come<br />
we used earlier <strong>in</strong> this<br />
section to discuss af<strong>for</strong>dability.<br />
Once a family’s <strong>in</strong>come rises above<br />
$36,000 and the family becomes<br />
<strong>in</strong>eligible <strong>for</strong> Child Care Assistance,<br />
it takes an <strong>in</strong>come of $61,000
I. Family Dilemma: Child Care Af<strong>for</strong>dability<br />
W H AT T Y P E S O F C H I L D C A R E C A N FA M I L I E S A F F O R D ?<br />
Assum<strong>in</strong>g “af<strong>for</strong>dable” means pay<strong>in</strong>g no more than ten percent of the family <strong>in</strong>come on <strong>child</strong> <strong>care</strong>, here are the<br />
types of <strong>care</strong> our families can af<strong>for</strong>d based on the average cost of <strong>care</strong>.<br />
JENNIFER ACOSTA: WORKING<br />
MOM WITH FOUR-YEAR-OLD.<br />
INCOME IS $14,248 A YEAR.<br />
To stay with<strong>in</strong> ten percent of her <strong>in</strong>come,<br />
Jennifer would be able to pay as much<br />
as $28 per week on <strong>child</strong> <strong>care</strong>. If she<br />
uses Ill<strong>in</strong>ois Child Care Assistance, <strong>for</strong><br />
which she is eligible, she will have to<br />
pay $20 per week <strong>for</strong> her co-payment.<br />
If Jennifer is able to f<strong>in</strong>d a <strong>child</strong> <strong>care</strong><br />
provider who accepts Ill<strong>in</strong>ois Child Care<br />
Assistance and who expects no additional<br />
payments on top of her copayment,<br />
she will have access to both<br />
center and licensed home <strong>care</strong>.<br />
However, s<strong>in</strong>ce the rates paid by the<br />
Ill<strong>in</strong>ois Child Care Assistance program<br />
are less than the average rates charged<br />
by center and licensed home providers,<br />
these providers might ask her to pay the<br />
difference. In this case, Jennifer would<br />
be priced out of average-priced center<br />
<strong>care</strong> except <strong>in</strong> the South and Southwest<br />
Chicago region. Licensed home <strong>care</strong> <strong>in</strong><br />
the Central and West Chicago region<br />
and the South and Southwest Chicago<br />
and suburban regions would be<br />
af<strong>for</strong>dable. In all other regions she<br />
would only be able to af<strong>for</strong>d licenseexempt<br />
home <strong>care</strong>.<br />
DENISE AND IVAN WILLIAMS:<br />
WORKING PARENTS WITH<br />
INFANT. INCOME IS $32,500.<br />
S<strong>in</strong>ce this couple is not eligible <strong>for</strong><br />
Ill<strong>in</strong>ois Child Care Assistance, their<br />
options are more limited. Work<strong>in</strong>g with<strong>in</strong><br />
ten percent of their <strong>in</strong>come, they could<br />
pay as much as $65 per week toward<br />
<strong>child</strong> <strong>care</strong>, or about $280 per month.<br />
Even if their <strong>child</strong> was preschool or<br />
school-age rather than an <strong>in</strong>fant, they<br />
would not be able to af<strong>for</strong>d the average<br />
cost of either licensed home or<br />
center <strong>care</strong>.<br />
Options <strong>for</strong> this couple <strong>in</strong>clude look<strong>in</strong>g<br />
<strong>for</strong> family, friend or neighbor <strong>child</strong> <strong>care</strong>,<br />
tak<strong>in</strong>g jobs where they could stagger<br />
their work schedules, or reduc<strong>in</strong>g their<br />
wages enough so they could be eligible<br />
<strong>for</strong> Ill<strong>in</strong>ois Child Care Assistance.<br />
REGINA THOMAS: WORKING<br />
PARENT WITH THREE-YEAR-OLD<br />
& SEVEN-YEAR-OLD. INCOME<br />
IS $59,000.<br />
Reg<strong>in</strong>a earns above the Ill<strong>in</strong>ois median<br />
<strong>in</strong>come <strong>for</strong> a family of three, well above<br />
the cut off <strong>for</strong> Ill<strong>in</strong>ois Child Care Assistance.<br />
She can spend up to $118 per<br />
week to stay with<strong>in</strong> ten percent of her<br />
<strong>in</strong>come. But if she wants to use center<br />
<strong>care</strong>, $118 would not even cover the<br />
cost of <strong>care</strong> <strong>for</strong> her three-year-old. In<br />
three regions she could af<strong>for</strong>d to place<br />
one <strong>child</strong> <strong>in</strong> licensed home <strong>care</strong>, but <strong>in</strong><br />
no region could she af<strong>for</strong>d this <strong>care</strong> <strong>for</strong><br />
both <strong>child</strong>ren. Like the Williams Family,<br />
Reg<strong>in</strong>a would need to consider family,<br />
friend or neighbor <strong>care</strong> if she is to<br />
spend no more than ten percent of<br />
her <strong>in</strong>come on <strong>child</strong> <strong>care</strong>.<br />
Reg<strong>in</strong>a was also <strong>in</strong>terested <strong>in</strong> part-day<br />
preschool <strong>for</strong> her three-year-old so she<br />
could get some exposure to classroom<br />
activities. Her daughter was not eligible<br />
<strong>for</strong> free public preschool, and pay<strong>in</strong>g <strong>for</strong><br />
private preschool would leave little, if<br />
any, money <strong>for</strong> <strong>child</strong> <strong>care</strong> dur<strong>in</strong>g the<br />
other hours needed.<br />
11
The 2006 Report of Child Care <strong>in</strong> Cook County<br />
be<strong>for</strong>e licensed home <strong>care</strong> <strong>for</strong> a<br />
three-year-old returns to ten percent<br />
of the family’s <strong>in</strong>come. It takes an<br />
<strong>in</strong>come of $104,000 be<strong>for</strong>e the cost<br />
of <strong>in</strong>fant <strong>care</strong> <strong>in</strong> a center returns to<br />
ten percent of the family’s <strong>in</strong>come.<br />
Aga<strong>in</strong>, <strong>for</strong> a family earn<strong>in</strong>g less than<br />
$61,000, only <strong>in</strong><strong>for</strong>mal family, friend<br />
or neighbor <strong>child</strong> <strong>care</strong> is af<strong>for</strong>dable<br />
at ten percent of family <strong>in</strong>come.<br />
These higher <strong>in</strong>comes, needless<br />
to say, are substantially above the<br />
typical family <strong>in</strong>come <strong>in</strong> Ill<strong>in</strong>ois.<br />
F.<br />
T H E U S E O F I L L I N O I S<br />
C H I L D C A R E A S S I S TANCE<br />
Despite its limitations, the Ill<strong>in</strong>ois<br />
Child Care Assistance Program<br />
supports about 50,000 Cook<br />
County families each month, and<br />
assistance <strong>for</strong> foster <strong>care</strong> helps<br />
thousands more. To take advantage<br />
of this assistance, an eligible family<br />
must first f<strong>in</strong>d a <strong>child</strong> <strong>care</strong> provider<br />
will<strong>in</strong>g to work with the IDHS or<br />
DCFS payment system. The Ill<strong>in</strong>ois<br />
<strong>Action</strong> <strong>for</strong> <strong>Children</strong> Resource and<br />
Referral Program asks providers on<br />
its database whether or not they are<br />
will<strong>in</strong>g to accept <strong>child</strong>ren with Ill<strong>in</strong>ois<br />
Child Care Assistance or DCFS<br />
vouchers. In 2006:<br />
• Seventy-one percent of Cook<br />
County centers listed with Ill<strong>in</strong>ois<br />
<strong>Action</strong> <strong>for</strong> <strong>Children</strong> (or 884<br />
centers) said they would accept<br />
<strong>child</strong>ren who use Ill<strong>in</strong>ois Child<br />
Care Assistance. 8<br />
• Fewer centers accept the DCFS<br />
assistance <strong>for</strong> foster <strong>child</strong>ren:<br />
634 centers, or 51 percent.<br />
• Direct public-sector contracts to<br />
serve families with Ill<strong>in</strong>ois Child<br />
Care Assistance are <strong>in</strong> place <strong>in</strong><br />
69 centers—71 percent of these<br />
are <strong>in</strong> Chicago and 29 percent<br />
are <strong>in</strong> suburban Cook County.<br />
• 2,939 licensed home providers,<br />
88 percent of those listed with<br />
Ill<strong>in</strong>ois <strong>Action</strong> <strong>for</strong> <strong>Children</strong>,<br />
reported that they accept <strong>child</strong>ren<br />
with Ill<strong>in</strong>ois Child Care<br />
Assistance. Fifty-eight percent<br />
reported that they accept <strong>child</strong>ren<br />
who have DCFS vouchers.<br />
Providers themselves report the<br />
above data to Ill<strong>in</strong>ois <strong>Action</strong> <strong>for</strong><br />
<strong>Children</strong>. IDHS has separate<br />
reports on the number of providers<br />
who actually receive payment from<br />
the Ill<strong>in</strong>ois Child Care Assistance<br />
Program at any given time. In FY2006,<br />
1,221 <strong>child</strong> <strong>care</strong> centers and 3,800<br />
licensed homes <strong>in</strong> Cook County<br />
were paid through the Ill<strong>in</strong>ois Child<br />
Care Assistance Program <strong>for</strong> some<br />
<strong>child</strong> <strong>care</strong> services.<br />
Referrals Given to Families<br />
Eligible <strong>for</strong> Child Care Assistance<br />
In 2006, 14,654 Cook County families<br />
called Ill<strong>in</strong>ois <strong>Action</strong> <strong>for</strong> <strong>Children</strong><br />
<strong>in</strong> search of <strong>child</strong> <strong>care</strong> referrals. Of<br />
these families, 81 percent had <strong>in</strong>comes<br />
at or below 50 percent of the state<br />
median <strong>in</strong>come, mak<strong>in</strong>g them eligible<br />
<strong>for</strong> Ill<strong>in</strong>ois Child Care Assistance if<br />
they were work<strong>in</strong>g or <strong>in</strong> an approved<br />
school or tra<strong>in</strong><strong>in</strong>g program.<br />
Note: In Section V we return to the<br />
topic of Ill<strong>in</strong>ois Child Care Assistance<br />
and report on the total number<br />
of <strong>child</strong>ren eligible <strong>in</strong> Cook County<br />
and the number of eligible <strong>child</strong>ren<br />
not be<strong>in</strong>g served. In Section VI we<br />
report on the types of <strong>child</strong> <strong>care</strong><br />
used by families with Assistance.<br />
12
I. Family Dilemma: Child Care Af<strong>for</strong>dability<br />
W H Y D O E S C H I L D C A R E I N C E N T E R S C O S T S O M U C H ?<br />
Salaries and benefits generally account <strong>for</strong> well over half of a<br />
center’s expenses.* The higher staff compensation is, the<br />
harder it is <strong>for</strong> programs to offer <strong>child</strong> <strong>care</strong> unless they can<br />
charge parents higher fees.<br />
SALARIES IN COOK COUNTY<br />
It is no secret that Ill<strong>in</strong>ois <strong>child</strong> <strong>care</strong> workers generally are not<br />
well-paid. In 2005 <strong>in</strong> Cook County, full-time center teachers<br />
<strong>in</strong> full-year licensed programs earned an average of $10.54<br />
per hour, while assistant teachers earned $9.00.** This<br />
amounts to less than half of what public elementary school<br />
teachers earn (<strong>in</strong> a system fully subsidized by the public<br />
sector). Elementary school teachers also are more likely to<br />
have benefits such as health <strong>in</strong>surance and retirement plans<br />
than are <strong>child</strong> <strong>care</strong> teachers.<br />
SALARIES AND QUALITY<br />
In th<strong>in</strong>k<strong>in</strong>g about the high cost of <strong>child</strong> <strong>care</strong>, we need be<br />
aware that staff compensation also affects the quality of the<br />
<strong>child</strong> <strong>care</strong> supplied by centers and homes. One major aspect<br />
of quality, the relationship between provider and <strong>child</strong>, suffers<br />
when lower compensation makes it difficult to reta<strong>in</strong> staff.<br />
Better tra<strong>in</strong>ed, more experienced and more skilled teachers,<br />
<strong>for</strong> example, will generally cost a center or home more to<br />
hire and reta<strong>in</strong> than less tra<strong>in</strong>ed, less experienced and less<br />
skilled staff.<br />
Low compensation rates <strong>in</strong> <strong>child</strong> <strong>care</strong> br<strong>in</strong>g a high turnover<br />
among staff. In Ill<strong>in</strong>ois <strong>for</strong> every 100 early <strong>child</strong>hood teachers<br />
work<strong>in</strong>g <strong>for</strong> centers <strong>in</strong> 2005, some 32 left their jobs <strong>in</strong> the<br />
previous two years. Of every 100 assistant teachers, 53 left<br />
their jobs. A further consequence of this high turnover rate is a<br />
lower level of job experience: the median number of years that<br />
teachers and assistant teachers had worked <strong>in</strong> their current<br />
<strong>child</strong> <strong>care</strong> centers were 3.5 and 1.9 years respectively. †<br />
S<strong>in</strong>ce <strong>in</strong>adequate compensation is one reason why <strong>child</strong> <strong>care</strong><br />
experiences such work<strong>for</strong>ce <strong>in</strong>stability, studies f<strong>in</strong>d that low<br />
quality is generally correlated with low cost. On average, the<br />
center or home that pays below go<strong>in</strong>g rates <strong>for</strong> staff will offer<br />
lower quality <strong>care</strong>. ‡<br />
Child <strong>care</strong> providers thus face a vex<strong>in</strong>g dilemma. They must<br />
keep staff compensation low <strong>in</strong> order to stay <strong>in</strong> bus<strong>in</strong>ess, but<br />
need to keep compensation high <strong>in</strong> order to ma<strong>in</strong>ta<strong>in</strong> high<br />
quality and pay a liv<strong>in</strong>g wage.<br />
* A study of Massachusetts’ <strong>child</strong> <strong>care</strong> centers found that 71 percent of an<br />
average center's expenses go to salaries and benefits. The Cost and Quality of<br />
Full Day Care, Year-round Early Care and Education <strong>in</strong> Massachusetts<br />
(A study prepared <strong>for</strong> the Massachusetts Department of Education by the<br />
Wellesley College Centers <strong>for</strong> Women, 2001).<br />
** Ill<strong>in</strong>ois Salary and Staff<strong>in</strong>g Survey of Licensed Child Care Facilities: FY 2005<br />
(A study prepared <strong>for</strong> the Department of Human and Community Development<br />
by Philip C. Garnier, May 2006.) Table 28.<br />
† Ibid., Tables 9 and 20.<br />
‡ Of course, this is true only on average, and not <strong>for</strong> all programs. Many skilled<br />
and dedicated teachers rema<strong>in</strong> at low salaries.<br />
13
II. Family Dilemma: Access to<br />
Available Child Care Slots<br />
A .<br />
C H I L D C A R E P R O V I D E R S<br />
A N D S L O T S I N C O O K<br />
C O U N T Y<br />
A family’s access to <strong>child</strong> <strong>care</strong><br />
depends not only on af<strong>for</strong>dability<br />
but also on the number of available<br />
<strong>child</strong> <strong>care</strong> slots <strong>in</strong> the community <strong>for</strong><br />
the <strong>child</strong>’s age group. Child <strong>care</strong><br />
supply <strong>in</strong> Cook County comes from<br />
a rich mix of some 30,000 entrepreneurs<br />
<strong>in</strong>clud<strong>in</strong>g <strong>in</strong>dividual providers,<br />
educators, non-profit and <strong>for</strong>-profit<br />
enterprises and public agencies.<br />
Appendix 3 discusses some of the<br />
factors that enter <strong>in</strong>to the supply of<br />
<strong>child</strong> <strong>care</strong>. This section exam<strong>in</strong>es<br />
some critical elements of that supply:<br />
the number of providers, their<br />
geographical distribution across<br />
Cook County and the number of<br />
slots they report to us.<br />
Table II-1 shows the best count we<br />
can provide of the number of <strong>child</strong><br />
<strong>care</strong> programs <strong>in</strong> Cook County, while<br />
Table II-2 shows the number of<br />
<strong>child</strong> <strong>care</strong> slots provided by these<br />
programs. Each table divides the<br />
programs <strong>in</strong>to type of <strong>child</strong> <strong>care</strong><br />
sett<strong>in</strong>g: licensed and license-exempt<br />
center <strong>care</strong>, and licensed and licenseexempt<br />
home <strong>care</strong>. These types of<br />
<strong>child</strong> <strong>care</strong> sett<strong>in</strong>gs are def<strong>in</strong>ed <strong>in</strong> the<br />
Glossary. Appendix 4 discusses the<br />
data sources we use <strong>in</strong> more detail.<br />
Table II-1.<br />
Best Counts of Child Care Programs <strong>in</strong> Cook County*<br />
Type of Program FY2005 FY2006<br />
Licensed Centers 1,221 1,236<br />
License-Exempt Centers 632 625<br />
Licensed Homes 4,042 4,031<br />
License-Exempt Homes 26,087 20,647<br />
Total Programs 31,982 26,539<br />
* The best currently available source of <strong>in</strong><strong>for</strong>mation <strong>for</strong> each k<strong>in</strong>d of <strong>care</strong>. See Appendix 4.<br />
Note that the TOTAL row adds dissimilar homes and centers together and should be considered a total<br />
only <strong>for</strong> recorded <strong>child</strong> <strong>care</strong> establishments irrespective of size.<br />
Table II-2. Child Care Slots <strong>in</strong> Cook County<br />
Center and licensed home slots <strong>in</strong>clude daytime slots only.*<br />
Type of Program FY2005 FY2006<br />
Licensed Centers 86,387 88,902<br />
License-Exempt Centers 29,916 31,012<br />
Licensed Homes 29,744 29,432<br />
License-Exempt Homes** 78,261 61,941<br />
Total 224,308 211,287<br />
** Licensed homes have the capacity to serve an additional 8,840 <strong>child</strong>ren dur<strong>in</strong>g even<strong>in</strong>g hours.<br />
Child <strong>care</strong> centers provide an additional 1,250 even<strong>in</strong>g slots. See Section III-A.<br />
** To estimate slots <strong>in</strong> license-exempt homes, we multiply the number of license-exempt homes known<br />
through the Ill<strong>in</strong>ois Child Care Assistance Program by three <strong>child</strong>ren per home. License-exempt home<br />
providers legally can <strong>care</strong> <strong>for</strong> no more than three <strong>child</strong>ren unless all <strong>child</strong>ren are related. While this<br />
number reflects the potential capacity of license-exempt home providers, on average the actual number<br />
of <strong>child</strong>ren enrolled per provider is closer to two.<br />
These tables understate the actual<br />
number of providers <strong>in</strong> Cook<br />
County and the <strong>child</strong>ren they can<br />
serve. Centers and homes that are<br />
14
exempt from licens<strong>in</strong>g do not have<br />
to list their slots with any official<br />
source, so many go uncounted. 9<br />
While a large number of licenseexempt<br />
centers do list their programs<br />
with the Ill<strong>in</strong>ois <strong>Action</strong> <strong>for</strong> <strong>Children</strong><br />
Resource and Referral Program,<br />
we have a more limited list of<br />
license-exempt home providers<br />
<strong>in</strong> Cook County.<br />
In 2006, 1,861 known <strong>child</strong> <strong>care</strong><br />
centers offered 119,914 <strong>child</strong> <strong>care</strong><br />
slots. Child <strong>care</strong> centers offered<br />
somewhat more than half of the total<br />
known capacity <strong>in</strong> Cook County.<br />
About 74 percent of the slots <strong>in</strong><br />
<strong>child</strong> <strong>care</strong> centers were <strong>in</strong> licensed<br />
centers.<br />
As of June 2006, the Department of<br />
<strong>Children</strong> and Family Services (DCFS)<br />
had listed 4,031 licensed family and<br />
group <strong>child</strong> <strong>care</strong> homes <strong>in</strong> Cook<br />
County with daytime slots <strong>for</strong> 29,432<br />
<strong>child</strong>ren. The large majority of licensed<br />
family <strong>child</strong> <strong>care</strong> homes can have a<br />
legal capacity up to 12. There is also<br />
a limited number of group <strong>child</strong> <strong>care</strong><br />
homes which can have a legal capacity<br />
up to 16. 10 The actual average<br />
licensed capacity of homes, however,<br />
is considerably lower: 7.3.<br />
The tables also report the number<br />
of known license-exempt home<br />
providers and their available slots.<br />
As mentioned, license-exempt home<br />
providers are a much more elusive<br />
group. Neither DCFS nor the Ill<strong>in</strong>ois<br />
<strong>Action</strong> <strong>for</strong> <strong>Children</strong> Resource and<br />
Referral Program has significant<br />
<strong>in</strong><strong>for</strong>mation on license-exempt home<br />
providers, although we learn more<br />
every year through the Resource<br />
and Referral Program. We know<br />
most about those license-exempt<br />
home providers who receive payments<br />
from the Ill<strong>in</strong>ois Child Care<br />
Assistance Program <strong>for</strong> provid<strong>in</strong>g<br />
<strong>child</strong> <strong>care</strong> to low-<strong>in</strong>come work<strong>in</strong>g<br />
families, so those are the ones we<br />
report on here.<br />
In Fiscal Year 2006, some 45,936<br />
Cook County license-exempt home<br />
providers received Ill<strong>in</strong>ois Child Care<br />
Assistance payments dur<strong>in</strong>g at least<br />
one month of the year, though fewer<br />
participate at any one time. In June<br />
2006, 20,647 license-exempt home<br />
<strong>child</strong> <strong>care</strong> providers were receiv<strong>in</strong>g<br />
Ill<strong>in</strong>ois Child Care Assistance<br />
payments. 11<br />
Home providers who have licenseexempt<br />
status may legally <strong>care</strong> <strong>for</strong><br />
as many as three <strong>child</strong>ren who are<br />
not their own. 12 While we provisionally<br />
estimate 61,941 slots <strong>in</strong> known<br />
license-exempt homes <strong>in</strong> Table II-2,<br />
the reader should be aware that<br />
many, though not all, license-exempt<br />
home providers do not offer <strong>child</strong><br />
<strong>care</strong> slots <strong>in</strong> the same way that<br />
centers and licensed homes do.<br />
Instead, many are relatives, neighbors<br />
or family friends who choose<br />
to <strong>care</strong> <strong>for</strong> particular <strong>child</strong>ren <strong>for</strong><br />
particular periods of time rather than<br />
offer <strong>care</strong> to any <strong>child</strong> as part of an<br />
on-go<strong>in</strong>g bus<strong>in</strong>ess.<br />
B.<br />
P R O V I D E R S A N D S L O T S<br />
B Y R E G I O N<br />
Some parents will have a more<br />
difficult time f<strong>in</strong>d<strong>in</strong>g <strong>child</strong> <strong>care</strong><br />
because of where they live. The<br />
119,914 spaces <strong>in</strong> <strong>child</strong> <strong>care</strong><br />
centers are almost evenly divided<br />
between Chicago and suburban<br />
Cook County. By comparison,<br />
almost two-thirds (65 percent) of<br />
the 29,432 licensed home spaces<br />
are located <strong>in</strong> Chicago. Table II-3<br />
shows how center and licensed<br />
home slots are distributed among<br />
the regions of Cook County.<br />
The last row of Table II-3 shows the<br />
total number of center and licensed<br />
home slots as a percent of the number<br />
of <strong>child</strong>ren under 13 with<strong>in</strong> the<br />
region. These percentages are not<br />
<strong>in</strong>cluded to suggest met or unmet<br />
need but to allow some comparison<br />
of known supply across the regions,<br />
which differ <strong>in</strong> population.<br />
Table II-4 presents the distribution<br />
of the 61,941 known license-exempt<br />
home slots. Aga<strong>in</strong>, these data represent<br />
only a portion of the actual<br />
number of license-exempt home<br />
providers—namely, those serv<strong>in</strong>g<br />
families with Child Care Assistance.<br />
We know, however, that licenseexempt<br />
<strong>care</strong> is used widely across<br />
all <strong>in</strong>comes.<br />
15
The 2006 Report of Child Care <strong>in</strong> Cook County<br />
Table II-3. Center and Licensed Home Child Care Slots<br />
<strong>in</strong> Cook County Regions, 2006<br />
Includes daytime slots only.<br />
Source: Ill<strong>in</strong>ois <strong>Action</strong> <strong>for</strong> <strong>Children</strong> Resource and Referral Program and DCFS<br />
N & NW West S & SW<br />
N & NW C & W S & SW Suburban Suburban Suburban<br />
Program Type Chicago Chicago Chicago Cook Cook Cook<br />
Licensed Centers 10,203 13,175 18,653 21,243 7,473 18,155<br />
56% 55% 47% 70% 65% 70%<br />
License-Exempt Centers 5,210 6,012 9,306 6,954 1,500 2,030<br />
29% 25% 24% 23% 13% 8%<br />
Licensed Homes 2,712 4,973 11,420 1,946 2,503 5,878<br />
15% 21% 29% 6% 22% 23%<br />
Total Center and<br />
Licensed Home Slots 22,184 39,703 69,808 31,130 14,488 33,974<br />
100% 100% 100% 100% 100% 100%<br />
Total Slots as a Percent<br />
of <strong>Children</strong> Under Age 13 11% 18% 15% 14% 11% 17%<br />
Table II-4.<br />
License-Exempt Home Child Care Slots, June 2006<br />
Source: Ill<strong>in</strong>ois Child Care Assistance Program<br />
N & NW West S & SW<br />
N & NW C & W S & SW Suburban Suburban Suburban<br />
Program Type Chicago Chicago Chicago Cook Cook Cook<br />
Total 4,059 15,543 30,429 987 3,012 7,911<br />
Home of Non-Relative 558 1,920 3,615 165 390 996<br />
Relative’s Home 1,590 6,036 11,298 342 1,251 3,201<br />
Non-Relative <strong>in</strong> Child’s Home 843 3,654 7,668 192 528 1,665<br />
Relative <strong>in</strong> Child’s Home 1,068 3,933 7,848 288 843 2,049<br />
Eighty-one percent of the licenseexempt<br />
home providers participat<strong>in</strong>g<br />
<strong>in</strong> the Child Care Assistance program<br />
fall with<strong>in</strong> Chicago while only<br />
19 percent are <strong>in</strong> suburban Cook<br />
County. The table shows the numerical<br />
concentration of these homes <strong>in</strong><br />
Chicago’s South and Southwestern<br />
and Central and West regions, mirror<strong>in</strong>g<br />
the distribution of low-<strong>in</strong>come<br />
families who are eligible <strong>for</strong><br />
Assistance.<br />
License-exempt home <strong>care</strong> can be<br />
broken down further <strong>in</strong>to <strong>care</strong> provided<br />
by relatives versus non-relatives<br />
and <strong>care</strong> provided <strong>in</strong> the<br />
<strong>child</strong>’s home versus the provider’s<br />
home. Table II-4 shows the distribution<br />
of these four types of licenseexempt<br />
home <strong>care</strong> <strong>for</strong> the six Cook<br />
County regions.<br />
Maps 1 and 2 show how center and<br />
licensed home slots added together<br />
are spread among the <strong>in</strong>dividual<br />
communities of Cook County.<br />
License-exempt home slots are not<br />
<strong>in</strong>cluded here because the data we<br />
have provide only a portion of a<br />
widely unknown supply and<br />
because the supply of licenseexempt<br />
home <strong>care</strong> is more variable<br />
than licensed <strong>care</strong> as we expla<strong>in</strong>ed<br />
earlier <strong>in</strong> this section. 13 While<br />
providers have more <strong>child</strong> <strong>care</strong> slots<br />
<strong>in</strong> Chicago than <strong>in</strong> suburban Cook<br />
County, the number of slots <strong>in</strong> both<br />
the suburban communities and<br />
Chicago neighborhoods vary.<br />
16
II. Family Dilemma: Access to Available Child Care Slots<br />
Map 1: Center and Licensed Home Slots <strong>in</strong> Cook County Municipalities<br />
17
The 2006 Report of Child Care <strong>in</strong> Cook County<br />
Map 2: Center and Licensed Home Slots <strong>in</strong> Chicago Community Areas<br />
18
II. Family Dilemma: Access to Available Child Care Slots<br />
Table II-5. Child Care Center Slots <strong>in</strong> Cook County by Age <strong>in</strong> 2006<br />
Source: Ill<strong>in</strong>ois <strong>Action</strong> <strong>for</strong> <strong>Children</strong> Resource and Referral Program<br />
N & NW West S & SW Suburban<br />
N & NW C & W S & SW Chicago Suburban Suburban Suburban Cook<br />
Age Chicago Chicago Chicago Total Cook Cook Cook Total Total<br />
Infant 262 608 833 1,703 1,486 374 1,236 3,096 4,799<br />
Toddler 486 725 1,098 2,309 1,978 551 1,662 4,191 6,500<br />
2-year-old 1,452 1,555 2,993 6,000 3,463 1,091 2,709 7,263 13,263<br />
3- to 4-year-old 4,710 6,012 9,291 20,013 7,159 3,108 5,384 15,651 35,664<br />
5-year-old & K 2,937 4,489 6,584 14,010 6,440 1,808 3,373 11,621 25,631<br />
School-Age 2,491 3,002 4,425 9,918 7,289 1,562 3,149 12,000 21,918<br />
Total 13,038 16,408 25,375 54,821 26,840 8,736 18,206 53,782 108,603<br />
C.<br />
C E N T E R S L O T S B Y A G E<br />
Some parents will have more difficulty<br />
f<strong>in</strong>d<strong>in</strong>g <strong>child</strong> <strong>care</strong> because of<br />
the ages of their <strong>child</strong>ren. This section<br />
presents the number of <strong>child</strong>ren<br />
<strong>in</strong> each age group that Cook County<br />
<strong>child</strong> <strong>care</strong> centers can serve. Home<br />
<strong>child</strong> <strong>care</strong> providers have more<br />
flexibility <strong>in</strong> the ages of <strong>child</strong>ren they<br />
can enroll and these change frequently.<br />
For this reason we do not<br />
provide comparable data <strong>for</strong> <strong>child</strong><br />
<strong>care</strong> homes.<br />
In 2006, 1,810 <strong>child</strong> <strong>care</strong> centers<br />
listed with Ill<strong>in</strong>ois <strong>Action</strong> <strong>for</strong> <strong>Children</strong><br />
reported the number of <strong>child</strong>ren they<br />
serve per age group. Table II-5 shows<br />
the distribution of 108,603 slots <strong>in</strong><br />
licensed and license-exempt <strong>child</strong><br />
<strong>care</strong> centers among the different age<br />
groups <strong>in</strong> the six regions of Cook<br />
County. 14 Overall, the total age-identified<br />
center slots are split almost<br />
equally between Chicago and suburban<br />
Cook County regions.<br />
It is often noted that <strong>in</strong>fant <strong>care</strong><br />
and school-age <strong>care</strong> are among the<br />
most difficult <strong>for</strong> parents to f<strong>in</strong>d.<br />
Table II-5 confirms this. With a total<br />
of 4,799 slots, fewer places exist<br />
<strong>for</strong> <strong>in</strong>fants than any other age group<br />
under school age. Only ten percent<br />
of all center slots are <strong>for</strong> <strong>in</strong>fants and<br />
toddlers. This limited supply of<br />
<strong>in</strong>fant and toddler slots is not surpris<strong>in</strong>g<br />
s<strong>in</strong>ce it is costly <strong>for</strong> centers<br />
to provide <strong>care</strong> <strong>for</strong> this age group.<br />
Many families with <strong>in</strong>fants and toddlers<br />
look to family <strong>child</strong> <strong>care</strong><br />
homes <strong>for</strong> this <strong>care</strong>; however, even<br />
family <strong>child</strong> <strong>care</strong> homes, understandably,<br />
are limited by law to<br />
watch<strong>in</strong>g three <strong>child</strong>ren under age<br />
two at one time unless an assistant<br />
is present.<br />
Programs <strong>for</strong> school-age <strong>child</strong>ren,<br />
with a total of 21,918 slots <strong>for</strong> all<br />
age groups, have the lowest number<br />
of slots per age. There are about<br />
three times as many slots listed <strong>for</strong><br />
just three- through five-year-olds as<br />
there are <strong>for</strong> the entire school-age<br />
group, ages six through 12.<br />
A comparison of suburban Cook<br />
County center slots with Chicago<br />
center slots reveals unequal balance<br />
<strong>in</strong> different age groups. Suburban<br />
Cook County has 45 percent more<br />
center slots <strong>for</strong> <strong>child</strong>ren under age<br />
three than the city of Chicago has:<br />
14,550 slots to 10,012. Aga<strong>in</strong>, however,<br />
Chicago has disproportionately<br />
more center slots <strong>for</strong> the three<br />
through five-year-old age range:<br />
34,891 slots to 27,232 slots.<br />
D.<br />
R E F E R R A L S G I V E N<br />
T O PA R E N T S I N 2 0 0 6<br />
B Y C H I L D A G E<br />
Parents look<strong>in</strong>g <strong>for</strong> <strong>child</strong> <strong>care</strong> often<br />
seek referrals from Ill<strong>in</strong>ois <strong>Action</strong> <strong>for</strong><br />
<strong>Children</strong>’s referral service. As <strong>in</strong><br />
previous years, <strong>child</strong> <strong>care</strong> referrals<br />
were most often requested <strong>for</strong> <strong>child</strong>ren<br />
under age two—36 percent of<br />
all requests. Requests <strong>for</strong> <strong>child</strong>ren<br />
under age two were relatively higher<br />
on the north side of the <strong>county</strong> at 41<br />
and 42 percent, while lower on the<br />
southern side of the <strong>county</strong> at 32<br />
and 33 percent. In South and<br />
Southwestern suburban Cook<br />
County, there was a particularly high<br />
percent of requests <strong>for</strong> school-age<br />
<strong>care</strong>. See Table II-6 <strong>for</strong> the breakdown<br />
of referral requests by <strong>child</strong><br />
age and region.<br />
19
The 2006 Report of Child Care <strong>in</strong> Cook County<br />
Table II-6. Requests <strong>for</strong> Child Care by Age<br />
Source: Ill<strong>in</strong>ois <strong>Action</strong> <strong>for</strong> <strong>Children</strong> Resource and Referral Program, 2006<br />
N & NW West S & SW Cook<br />
N & NW C & W S & SW Suburban Suburban Suburban County<br />
Age Chicago Chicago Chicago Cook Cook Cook Total<br />
Under 2 2,067 1,083 2,179 812 689 702 7,532<br />
42% 36% 32% 41% 38% 33% 36%<br />
2-year-old 661 428 907 265 280 253 2,794<br />
13% 14% 13% 13% 15% 12% 14%<br />
3- to 4-year-old 1,282 889 2,077 425 405 469 5,547<br />
26% 29% 30% 22% 22% 22% 27%<br />
5-year-old & K 247 174 407 140 131 155 1,254<br />
5% 6% 6% 7% 7% 7% 6%<br />
School-Age 640 457 1,246 329 310 531 3,513<br />
13% 15% 18% 17% 17% 25% 17%<br />
Total 4,897 3,031 6,816 1,971 1,815 2,110 20,640<br />
100% 100% 100% 100% 100% 100% 100%<br />
BEST AND WORST REGIONS FOR FINDING INFANT CARE<br />
A family look<strong>in</strong>g <strong>for</strong> <strong>in</strong>fant <strong>care</strong> <strong>in</strong> a center or licensed home will<br />
likely have the greatest success <strong>in</strong> f<strong>in</strong>d<strong>in</strong>g <strong>care</strong> if they live <strong>in</strong> the<br />
South and Southwest suburban region of the <strong>county</strong>. This region<br />
has a low number of <strong>in</strong>fants per <strong>in</strong>fant slot, both <strong>in</strong> centers and <strong>in</strong><br />
licensed homes—mak<strong>in</strong>g it easier <strong>for</strong> families to f<strong>in</strong>d <strong>care</strong>.<br />
Number of Infants<br />
<strong>in</strong> the Community<br />
per Center Slot<br />
Number of<br />
Infants <strong>in</strong> the<br />
Community<br />
per Licensed<br />
Home Provider<br />
The North and Northwest Suburban region also does well with<br />
<strong>in</strong>fant center <strong>care</strong>. However, <strong>for</strong> a family priced out of this type of<br />
<strong>care</strong>, there are relatively few licensed home options <strong>in</strong> the region.<br />
Infant <strong>care</strong> is most scarce <strong>in</strong> the North and Northwest Chicago<br />
region. Here center <strong>in</strong>fant <strong>care</strong> is three times scarcer than any<br />
other region, and licensed home <strong>care</strong> <strong>for</strong> <strong>in</strong>fants is less abundant<br />
than almost all other areas.<br />
North and Northwest Chicago 63 48<br />
Central and West Chicago 18 17<br />
South and Southwest Chicago 22 13<br />
North and Northwest Suburban Cook 11 61<br />
West Suburban Cook 21 23<br />
South and Southwest Suburban Cook 8 13<br />
Note: The number of <strong>in</strong>fants per region is from the 2000 Census and does not<br />
reflect population changes over the last six years.<br />
20
III. Family Dilemma: F<strong>in</strong>d<strong>in</strong>g Child Care<br />
that Matches the Family’s Schedule<br />
Most <strong>child</strong> <strong>care</strong> programs are available<br />
only dur<strong>in</strong>g the daytime on<br />
weekdays, but only 66 percent of<br />
Ill<strong>in</strong>oisans with full-time jobs work<br />
these traditional hours. 15 Half of<br />
part-time employees and one-third<br />
of full-time employees work nontraditional<br />
schedules that <strong>in</strong>clude<br />
at least some even<strong>in</strong>g, night or<br />
weekend hours. Many also work<br />
schedules that change periodically,<br />
either <strong>in</strong> a predictable manner or<br />
irregularly. Some of the most common<br />
or fastest-grow<strong>in</strong>g jobs require<br />
non-traditional hours, <strong>in</strong>clud<strong>in</strong>g<br />
retail, food services, office clean<strong>in</strong>g,<br />
hospitals and nurs<strong>in</strong>g homes. In<br />
general, low pay<strong>in</strong>g jobs are more<br />
likely to require parents to work<br />
non-traditional schedules than better<br />
pay<strong>in</strong>g jobs. 16 These work schedules<br />
give rise to one of the most<br />
<strong>in</strong>tractable problems fac<strong>in</strong>g many<br />
parents seek<strong>in</strong>g <strong>child</strong> <strong>care</strong>. Relatively<br />
few programs accommodate<br />
parents’ needs <strong>for</strong> even<strong>in</strong>g <strong>child</strong><br />
<strong>care</strong>, overnight <strong>care</strong>, weekend <strong>care</strong>,<br />
<strong>care</strong> dur<strong>in</strong>g rotat<strong>in</strong>g work shifts and<br />
<strong>care</strong> dur<strong>in</strong>g work shifts scheduled<br />
almost at the last m<strong>in</strong>ute.<br />
A .<br />
P R O V I D E R S O F F E R I N G<br />
C A R E D U R I N G N O N -<br />
T R A D I T I O N A L H O U R S<br />
Table III-1 shows the number and<br />
percentage of centers and homes <strong>in</strong><br />
Cook County available <strong>for</strong> Ill<strong>in</strong>ois<br />
<strong>Action</strong> <strong>for</strong> <strong>Children</strong> to refer parents<br />
to <strong>for</strong> even<strong>in</strong>g <strong>child</strong> <strong>care</strong>, overnight<br />
<strong>care</strong>, weekend <strong>care</strong> and <strong>care</strong> dur<strong>in</strong>g<br />
rotat<strong>in</strong>g shifts.<br />
Table III-1.<br />
Cook County Providers with Non-Traditional Care 17<br />
Source: Ill<strong>in</strong>ois <strong>Action</strong> <strong>for</strong> <strong>Children</strong> Resource and Referral Program<br />
Percent of All<br />
Suburban<br />
Listed Centers<br />
Chicago Cook County Total or Homes<br />
Centers with Any Non-Traditional Care 70 119 189 11%<br />
Even<strong>in</strong>g 21 25 46 3%<br />
Overnight 0 1 1 0%<br />
Weekend 10 6 16 1%<br />
Rotat<strong>in</strong>g Shifts 48 95 143 8%<br />
Homes with Any Non-Traditional Care 1,419 609 2,028 61%<br />
Even<strong>in</strong>g 933 392 1,325 40%<br />
Overnight 128 61 189 6%<br />
Weekend 187 78 265 8%<br />
Rotat<strong>in</strong>g Shifts 774 312 1,086 32%<br />
In the table several facts stand out<br />
about the availability of <strong>child</strong> <strong>care</strong><br />
dur<strong>in</strong>g non-traditional hours. First,<br />
very few centers offer <strong>care</strong> dur<strong>in</strong>g<br />
non-traditional hours. In terms of<br />
both numbers and percentages, more<br />
<strong>child</strong> <strong>care</strong> homes than centers offer<br />
non-traditional hours of <strong>care</strong>. However,<br />
while two-fifths of homes offer<br />
even<strong>in</strong>g <strong>care</strong>, only a small percentage<br />
offer overnight or weekend <strong>care</strong>.<br />
The fact that homes are more likely<br />
than centers to offer non-traditional<br />
hours of <strong>care</strong> confirms the frequently<br />
heard comment that <strong>child</strong> <strong>care</strong> homes<br />
are more flexible than center programs<br />
<strong>in</strong> accommodat<strong>in</strong>g parents’<br />
work schedules. In addition, the<br />
spread of homes geographically<br />
offers greater flexibility <strong>for</strong> parents:<br />
the 2,028 home sites <strong>in</strong> Cook County<br />
offer<strong>in</strong>g non-traditional hours are<br />
more convenient geographically <strong>for</strong><br />
parents than the 189 center sites.<br />
Noteworthy differences exist between<br />
Chicago and suburban Cook<br />
County. Seventy percent of homes<br />
offer<strong>in</strong>g non-traditional hours of <strong>care</strong><br />
fall with<strong>in</strong> Chicago. Suburban Cook<br />
County outnumbers Chicago <strong>in</strong> the<br />
number of centers offer<strong>in</strong>g <strong>care</strong><br />
dur<strong>in</strong>g rotat<strong>in</strong>g shifts.<br />
Table III-2 breaks down the number<br />
of even<strong>in</strong>g slots by type of <strong>care</strong> and<br />
region, show<strong>in</strong>g that even<strong>in</strong>g slots<br />
are concentrated <strong>in</strong> licensed homes.<br />
The North and Northwest region of<br />
suburban Cook County has the fewest<br />
number of even<strong>in</strong>g slots, while<br />
the South and Southwest Chicago<br />
region has the greatest number. In<br />
recent years, licensed even<strong>in</strong>g<br />
21
The 2006 Report of Child Care <strong>in</strong> Cook County<br />
Table III-2. Even<strong>in</strong>g Slots by Cook County Region*<br />
Sources: DCFS and Ill<strong>in</strong>ois <strong>Action</strong> <strong>for</strong> <strong>Children</strong> Resource and Referral Program, June 2006<br />
N & NW West S & SW Cook<br />
N & NW C & W S & SW Suburban Suburban Suburban County<br />
Type of Care Chicago Chicago Chicago Cook Cook Cook Total<br />
Centers (licensed and license-exempt) 2,067 1,083 2,179 812 689 702 7,532<br />
Licensed Homes 661 428 907 265 280 253 2,794<br />
*Includes those centers or homes licensed <strong>for</strong> a nighttime capacity by DCFS and those licensed-exempt centers list<strong>in</strong>g an even<strong>in</strong>g shift with Ill<strong>in</strong>ois <strong>Action</strong> <strong>for</strong> <strong>Children</strong>.<br />
REGINA THOMAS: WORKING<br />
PARENT WITH THREE-YEAR-<br />
OLD AND SEVEN-YEAR OLD.<br />
INCOME IS $59,000.<br />
As a retail sales manager, Reg<strong>in</strong>a<br />
works from 2 p.m. to 10 p.m. each<br />
weekday. We have already learned that<br />
both center and licensed home <strong>care</strong><br />
<strong>for</strong> her two <strong>child</strong>ren are unaf<strong>for</strong>dable<br />
<strong>for</strong> Reg<strong>in</strong>a, mak<strong>in</strong>g family, friend or<br />
neighbor <strong>care</strong> the most realistic option.<br />
Figure III-1.<br />
<strong>Children</strong> <strong>in</strong> Need of Non-traditional Hours of Care<br />
Source: Ill<strong>in</strong>ois <strong>Action</strong> <strong>for</strong> <strong>Children</strong> Resource and Referral Program, 2005<br />
2,400<br />
1,800<br />
1,200<br />
600<br />
0<br />
2,015<br />
698<br />
Even<strong>in</strong>g Care Overnight Care Weekend Care<br />
■ Chicago<br />
250<br />
97<br />
■ Suburban Cook<br />
1,015<br />
370<br />
Reg<strong>in</strong>a’s work schedule presents an<br />
additional barrier to us<strong>in</strong>g center or<br />
licensed home <strong>care</strong>. Even if af<strong>for</strong>dability<br />
were not a factor, 97% of center<br />
slots and 60% of licensed home slots<br />
would be unavailable to her because<br />
of her even<strong>in</strong>g work hours.<br />
The school that her seven-year-old<br />
attends might provide after-school<br />
programm<strong>in</strong>g dur<strong>in</strong>g the afternoon or<br />
early even<strong>in</strong>g hours. Even if this were<br />
the case, if the school does not provide<br />
transportation to the provider’s<br />
home, Reg<strong>in</strong>a will need to f<strong>in</strong>d a<br />
provider who can pick up her daughter<br />
from school or f<strong>in</strong>d someone reliable<br />
to help her <strong>child</strong> get to the provider’s<br />
home, a responsibility sometimes left<br />
to an older <strong>child</strong>.<br />
capacity has been grow<strong>in</strong>g. Between<br />
2003 and 2006, the total number of<br />
even<strong>in</strong>g slots <strong>in</strong> licensed <strong>child</strong> <strong>care</strong><br />
centers rose 57 percent from 428 to<br />
672. Dur<strong>in</strong>g the same period, even<strong>in</strong>g<br />
slots <strong>in</strong> licensed homes rose 130<br />
percent, from 3,820 to 8,840 slots.<br />
Despite growth <strong>in</strong> the amount of <strong>care</strong><br />
provided dur<strong>in</strong>g non-traditional hours,<br />
families look<strong>in</strong>g <strong>for</strong> <strong>child</strong> <strong>care</strong> dur<strong>in</strong>g<br />
these times have a greatly reduced<br />
pool of center and licensed home<br />
slots available to them compared<br />
with families need<strong>in</strong>g weekday, daytime<br />
<strong>care</strong>. S<strong>in</strong>ce non-traditional work<br />
schedules often go hand <strong>in</strong> hand<br />
with low-<strong>in</strong>come jobs, families seek<strong>in</strong>g<br />
<strong>child</strong> <strong>care</strong> dur<strong>in</strong>g non-traditional<br />
hours are often challenged with<br />
af<strong>for</strong>dability issues as well. It is not<br />
surpris<strong>in</strong>g, then, that many parents<br />
22<br />
turn to relatives, friends and neighbors<br />
to <strong>care</strong> <strong>for</strong> their <strong>child</strong>ren.<br />
These providers often offer a more<br />
flexible and af<strong>for</strong>dable alternative.<br />
B.<br />
R E F E R R A L S G I V E N T O<br />
P A R E N T S I N N E E D O F<br />
N O N - T R A D I T I O N A L<br />
H O U R S O F C H I L D C A R E<br />
Parents sought referrals <strong>for</strong> 20,640<br />
<strong>child</strong>ren through Ill<strong>in</strong>ois <strong>Action</strong> <strong>for</strong><br />
<strong>Children</strong> <strong>in</strong> 2006. Fifteen percent of<br />
these <strong>child</strong>ren needed <strong>care</strong> dur<strong>in</strong>g<br />
even<strong>in</strong>g hours or overnight, and<br />
seven percent needed <strong>child</strong> <strong>care</strong><br />
dur<strong>in</strong>g weekend hours. Figure III-1<br />
gives the number of <strong>child</strong>ren <strong>in</strong> need<br />
of even<strong>in</strong>g, overnight and weekend<br />
<strong>care</strong> <strong>for</strong> both Chicago and suburban<br />
Cook County.
IV. Family Dilemma: F<strong>in</strong>d<strong>in</strong>g<br />
the Right Provider<br />
The story of parents’ search <strong>for</strong><br />
<strong>child</strong> <strong>care</strong> goes well beyond critical<br />
questions of the parents’ work<br />
schedules, the region where the<br />
parents live or work, the <strong>child</strong>’s age<br />
and the type of <strong>child</strong> <strong>care</strong> sett<strong>in</strong>g<br />
that parents want <strong>for</strong> their <strong>child</strong>.<br />
Each <strong>child</strong> is a specific <strong>in</strong>dividual<br />
and has <strong>in</strong>dividual needs that parents<br />
hope the right provider can meet.<br />
A .<br />
WHAT DO CHILDREN NEED?<br />
We have little hard data on the<br />
<strong>in</strong>dividual needs that parents most<br />
seek to accommodate. One good<br />
piece of <strong>in</strong><strong>for</strong>mation about what parents<br />
look <strong>for</strong> <strong>in</strong> a provider comes<br />
from a survey of parents who use<br />
the Ill<strong>in</strong>ois <strong>Action</strong> <strong>for</strong> <strong>Children</strong><br />
Resource and Referral program.<br />
Parents surveyed were asked to<br />
check the top three reasons why<br />
they chose their new <strong>child</strong> <strong>care</strong><br />
provider. Figure IV-1 shows the top<br />
reasons of the 1,337 respondents.<br />
These were location, schedule, a<br />
clean and safe environment and a<br />
warm and car<strong>in</strong>g environment.<br />
There are some noticeable, though<br />
not surpris<strong>in</strong>g, variances among age<br />
groups. Parents with <strong>in</strong>fants and<br />
toddlers more frequently based their<br />
choice on “warm and car<strong>in</strong>g environment,”<br />
“clean and safe environment”<br />
and “small group size” than<br />
parents of older age groups, while<br />
parents of school-age <strong>child</strong>ren were<br />
more likely to report that “educational<br />
environment” was a top reason<br />
they chose the <strong>care</strong> they did.<br />
B.<br />
S P E C I A L N E E D S<br />
In addition to every <strong>child</strong>’s <strong>in</strong>dividual<br />
needs, some <strong>child</strong>ren have special<br />
needs. In 2006, parents requested<br />
referrals from Ill<strong>in</strong>ois <strong>Action</strong> <strong>for</strong><br />
<strong>Children</strong> <strong>for</strong> 779 <strong>child</strong>ren with one<br />
or more special needs. Of all <strong>child</strong>ren<br />
with a special need, 31 percent<br />
had a developmental delay and<br />
27 percent had asthma or severe<br />
allergies. Figure IV-2 shows the<br />
number of <strong>child</strong>ren with each type<br />
of need.<br />
Like all parents, those who have<br />
<strong>child</strong>ren with special needs were<br />
asked to complete a follow up survey<br />
about their experience <strong>in</strong> f<strong>in</strong>d<strong>in</strong>g<br />
<strong>child</strong> <strong>care</strong>. Of the 316 parents of<br />
<strong>child</strong>ren with special needs who responded,<br />
28 percent said they were<br />
still <strong>in</strong> search of a <strong>child</strong> <strong>care</strong> provider.<br />
This is slightly smaller than the 32<br />
percent of total respondents with or<br />
without <strong>child</strong>ren with special needs<br />
who were still search<strong>in</strong>g <strong>for</strong> <strong>care</strong>.<br />
23
The 2006 Report of Child Care <strong>in</strong> Cook County<br />
Figure IV-1. Reasons Parents Chose Their New Provider, by Child Age<br />
Source: Ill<strong>in</strong>ois <strong>Action</strong> <strong>for</strong> <strong>Children</strong> Resource and Referral Program, 2006<br />
■ Birth to 2 ■ 3 to 5 School Age<br />
80%<br />
63% 64%<br />
59%<br />
40%<br />
26% 23% 24%<br />
41% 38% 35%<br />
19% 15%<br />
24%<br />
18% 22% 15%<br />
44% 42% 45% 44% 40%<br />
31%<br />
15% 11%<br />
6%<br />
20% 16% 17%<br />
0%<br />
Af<strong>for</strong>dability Clean and Educational Experienced Location Schedule Warm & Car<strong>in</strong>g Small Group Other<br />
Safe Environment Caregiver Environment Size<br />
Environment<br />
Figure IV-2. Type of Special Needs Requests<br />
Source: Ill<strong>in</strong>ois <strong>Action</strong> <strong>for</strong> <strong>Children</strong> Resource and Referral Program, 2006<br />
300<br />
200<br />
100<br />
242<br />
214<br />
72<br />
116 110<br />
93<br />
144<br />
0<br />
Developmental Asthma/ Autism Physical Emotional/ Special Other<br />
Delays Severe Behavioral Health<br />
Allergies<br />
Needs<br />
24
V. Public Dilemma: Who Needs Child<br />
Care? Who Needs Support?<br />
Sections I through IV present<br />
dilemmas that families may face <strong>in</strong><br />
seek<strong>in</strong>g and obta<strong>in</strong><strong>in</strong>g <strong>child</strong> <strong>care</strong>:<br />
f<strong>in</strong>d<strong>in</strong>g <strong>care</strong> that is af<strong>for</strong>dable, locat<strong>in</strong>g<br />
open slots, obta<strong>in</strong><strong>in</strong>g <strong>care</strong> dur<strong>in</strong>g the<br />
hours needed, and f<strong>in</strong>d<strong>in</strong>g the best<br />
provider <strong>for</strong> a <strong>child</strong>’s specific needs.<br />
This section is about basic questions<br />
the public faces <strong>in</strong> these matters.<br />
The public sector <strong>in</strong> Ill<strong>in</strong>ois is<br />
actively <strong>in</strong>volved <strong>in</strong> help<strong>in</strong>g families<br />
address their <strong>child</strong> <strong>care</strong> needs.<br />
Yet the public sector faces its own<br />
dilemmas. In particular the public<br />
sector must decide how many<br />
resources it should devote to solv<strong>in</strong>g<br />
families’ <strong>child</strong> <strong>care</strong> problems,<br />
especially compared to apply<strong>in</strong>g<br />
resources to address other public<br />
needs. In th<strong>in</strong>k<strong>in</strong>g about this issue,<br />
the public has to decide who needs<br />
<strong>child</strong> <strong>care</strong>, how much the public<br />
should support <strong>child</strong> <strong>care</strong>, what k<strong>in</strong>d<br />
of <strong>care</strong> to support and who needs<br />
support pay<strong>in</strong>g <strong>for</strong> <strong>child</strong> <strong>care</strong>. In this<br />
section we discuss some of the<br />
ways of th<strong>in</strong>k<strong>in</strong>g about who needs<br />
<strong>child</strong> <strong>care</strong> and who might deserve<br />
public support.<br />
Table V-1. <strong>Children</strong> <strong>in</strong> Cook County, 2000 Census<br />
<strong>Children</strong> Chicago Total Suburban Cook Total Total Cook County<br />
Under 3 Years 131,472 101,662 233,134<br />
Ages 3 through 5 129,764 108,764 238,528<br />
Ages 6 through 12 302,221 260,216 562,437<br />
Totals 563,457 470,642 1,034,099<br />
Under 3, In Poverty 36,522 8,873 45,395<br />
% of Age Group <strong>in</strong> Poverty 28% 9% 19%<br />
Ages 3-5, In Poverty 37,557 9,773 47,330<br />
% of Age Group <strong>in</strong> Poverty 29% 9% 20%<br />
Ages 6-12, In Poverty 88,077 22,868 110,945<br />
% of Age Group <strong>in</strong> Poverty 29% 9% 20%<br />
Under 3, Income Eligible* 65,267 21,923 87,190<br />
% of Age Group Eligible* 50% 22% 37%<br />
Ages 3-5, Income Eligible * 66,689 23,871 90,560<br />
% of Age Group Eligible* 51% 22% 38%<br />
Ages 6-12, Income Eligible 156,743 55,147 211,891<br />
% of Age Group Eligible* 52% 21% 38%<br />
* Income-eligible <strong>for</strong> Ill<strong>in</strong>ois Child Care Assistance. The <strong>in</strong>come limit is 50% of state median <strong>in</strong>come, or<br />
approximately 185% of the federal poverty level, depend<strong>in</strong>g upon family size. The work requirement <strong>for</strong><br />
Ill<strong>in</strong>ois Child Care Assistance is not factored <strong>in</strong> here. Ages of <strong>child</strong>ren both <strong>in</strong> poverty and <strong>in</strong>come-eligible<br />
are calculated from the proportions of all <strong>child</strong>ren <strong>in</strong> different age groups.<br />
A . C H I L D P O P U L AT I O N ,<br />
P O V E RT Y A N D<br />
LOW INCOME<br />
Over one million <strong>child</strong>ren ages 12<br />
and under reside <strong>in</strong> Cook County.<br />
The first four rows of Table V-1<br />
enumerate <strong>child</strong>ren <strong>in</strong> Chicago<br />
and suburban Cook County by age<br />
groups based on the U.S. Census<br />
2000. As the table shows, over<br />
54 percent of the <strong>child</strong>ren <strong>in</strong> Cook<br />
County <strong>in</strong> 2000 resided <strong>in</strong> Chicago.<br />
Potentially all of the <strong>child</strong>ren age five<br />
years old and under need <strong>child</strong> <strong>care</strong><br />
or early education. It is unrealistic,<br />
however, to suppose that the parents<br />
of all these <strong>child</strong>ren actually seek<br />
<strong>care</strong>. Similarly, many older <strong>child</strong>ren<br />
ages six through twelve need<br />
be<strong>for</strong>e- or after-school <strong>care</strong>.<br />
The next six rows of Table V-1 show<br />
levels of poverty among <strong>child</strong>ren <strong>in</strong><br />
Cook County. Many of these <strong>child</strong>ren<br />
<strong>in</strong> poverty have parents <strong>in</strong> the<br />
labor <strong>for</strong>ce earn<strong>in</strong>g poverty-level<br />
<strong>in</strong>comes, but others do not. One<br />
way that the public sector supports<br />
some poor families is through support<strong>in</strong>g<br />
early <strong>care</strong> and education<br />
opportunities <strong>for</strong> poor <strong>child</strong>ren,<br />
especially as a way to prepare them<br />
to succeed <strong>in</strong> school. The table<br />
shows that up to 29 percent of the<br />
<strong>child</strong>ren <strong>in</strong> Chicago were poor <strong>in</strong><br />
25
The 2006 Report of Child Care <strong>in</strong> Cook County<br />
Table V–2. <strong>Children</strong> <strong>in</strong> Cook County by Region, 2000 Census<br />
N & NW West S & SW<br />
N & NW C & W S & SW Suburban Suburban Suburban<br />
<strong>Children</strong> Chicago Chicago Chicago Cook Cook Cook<br />
Under 3 Years 44,551 31,292 55,629 47,193 22,465 32,004<br />
Ages 3 through 5 39,172 30,806 59,786 49,475 24,174 35,115<br />
Ages 6 through 12 87,102 71,408 143,711 117,634 53,412 89,170<br />
Under 3, In Poverty 7,331 11,887 17,304 2,569 2,562 3,742<br />
and % <strong>in</strong> Poverty 16% 38% 31% 5% 11% 12%<br />
Ages 3-5, In Poverty 6,729 12,142 18,686 2,676 2,886 4,211<br />
and % <strong>in</strong> Poverty 17% 39% 31% 5% 12% 12%<br />
Ages 6-12, In Poverty 15,682 27,800 44,595 6,475 5,671 10,722<br />
and % <strong>in</strong> Poverty 18% 39% 31% 6% 11% 12%<br />
Under 3, Income Eligible 16,556 19,090 29,621 7,215 6,443 8,265<br />
& % Eligible* 37% 61% 53% 15% 29% 26%<br />
Ages 3-5, Income Eligible 15,420 19,327 31,942 7,582 7,057 9,232<br />
& % Eligible* 39% 63% 53% 15% 29% 26%<br />
Ages 6-12, Income Eligible 35,369 45,621 75,753 17,626 14,988 22,534<br />
& % Eligible* 41% 64% 53% 15% 28% 25%<br />
* Income-eligible <strong>for</strong> Ill<strong>in</strong>ois Child Care Assistance. The <strong>in</strong>come limit is 50% of state median <strong>in</strong>come, or approximately 185% of the federal poverty level, depend<strong>in</strong>g<br />
upon family size. The work requirement <strong>for</strong> Ill<strong>in</strong>ois Child Care Assistance is not factored <strong>in</strong> here. Ages of <strong>child</strong>ren both <strong>in</strong> poverty and <strong>in</strong>come-eligible are<br />
calculated from the proportions of all <strong>child</strong>ren <strong>in</strong> different age groups.<br />
2000. Chicago <strong>child</strong>ren were over<br />
three times more likely to be poor<br />
than other Cook County <strong>child</strong>ren.<br />
Because poverty rates have risen<br />
s<strong>in</strong>ce 2000, the rates <strong>for</strong> both<br />
regions are now probably higher<br />
than the table <strong>in</strong>dicates.<br />
The f<strong>in</strong>al six rows of Table V-1 present<br />
the number of <strong>child</strong>ren liv<strong>in</strong>g <strong>in</strong><br />
families whose <strong>in</strong>comes make them<br />
eligible <strong>in</strong> 2006 <strong>for</strong> Ill<strong>in</strong>ois Child Care<br />
Assistance. In Ill<strong>in</strong>ois, a family’s<br />
<strong>in</strong>come can rise approximately 85<br />
percent above the federal poverty<br />
level be<strong>for</strong>e the family is no longer<br />
eligible <strong>for</strong> such assistance. Under<br />
this standard, about half of Chicago<br />
<strong>child</strong>ren under 13 and about onefifth<br />
of suburban <strong>child</strong>ren <strong>in</strong> Cook<br />
County are <strong>in</strong>come-eligible <strong>for</strong><br />
Ill<strong>in</strong>ois Child Care Assistance. Note<br />
that <strong>in</strong> addition to the <strong>in</strong>come requirement,<br />
the Ill<strong>in</strong>ois Child Care Assistance<br />
Program also requires that all<br />
parents present <strong>in</strong> the family be <strong>in</strong><br />
the labor <strong>for</strong>ce or <strong>in</strong> education or<br />
tra<strong>in</strong><strong>in</strong>g programs. Work<strong>in</strong>g parents<br />
are discussed <strong>in</strong> section B below.<br />
Table V-2 breaks down the same<br />
<strong>in</strong><strong>for</strong>mation on <strong>child</strong> population,<br />
poverty and low <strong>in</strong>come <strong>for</strong> the six<br />
regions of the <strong>county</strong>. Families <strong>in</strong><br />
poverty and families with low <strong>in</strong>comes<br />
tend to concentrate <strong>in</strong> the western<br />
and southern parts of Chicago. The<br />
southern and western parts of suburban<br />
Cook County also have more<br />
poverty and more families eligible<br />
<strong>for</strong> Child Care Assistance than the<br />
<strong>county</strong>’s North and Northwest<br />
regions. 18<br />
Up to 39 percent of <strong>child</strong>ren liv<strong>in</strong>g <strong>in</strong><br />
a Cook County region are officially<br />
26<br />
poor. With respect to <strong>in</strong>comes that<br />
make families eligible <strong>for</strong> Ill<strong>in</strong>ois<br />
Child Care Assistance, <strong>in</strong> the six<br />
regions as few as fifteen percent<br />
and as many as 64 percent of <strong>child</strong>ren<br />
<strong>in</strong> different age groups live <strong>in</strong><br />
families eligible <strong>for</strong> Assistance.<br />
B.<br />
C H I L D R E N W I T H<br />
W O R K I N G PA R E N T S<br />
Public policy often supports work<strong>in</strong>g<br />
families <strong>in</strong> particular. To estimate the<br />
demand <strong>for</strong> <strong>child</strong> <strong>care</strong> <strong>in</strong> a region<br />
such as Cook County, researchers<br />
often start with the number of families<br />
with every parent work<strong>in</strong>g outside<br />
of the home and ignore families<br />
with at least one parent not <strong>in</strong> the<br />
labor <strong>for</strong>ce. This approach neglects<br />
the fact that substantial numbers of
Introduction<br />
Table V–3. <strong>Children</strong> With All Parents <strong>in</strong> the Household <strong>in</strong> Labor Force 2000 Census<br />
N & NW West S & SW<br />
N & NW C & W S & SW Suburban Suburban Suburban<br />
<strong>Children</strong> Chicago Chicago Chicago Cook Cook Cook<br />
<strong>Children</strong> Under 6 Years 41,778 26,678 56,394 51,614 23,105 38,386<br />
53% 49% 56% 55% 53% 61%<br />
Table V-4. Estimate of Unserved Childre n<br />
<strong>Children</strong> Eligible <strong>for</strong> Child Care Assistance But Not Receiv<strong>in</strong>g It<br />
Calculated from 2000 Census and Ill<strong>in</strong>ois Child Care Assistance Program 2006 data<br />
N & NW West S & SW<br />
N & NW C & W S & SW Suburban Suburban Suburban<br />
<strong>Children</strong> Chicago Chicago Chicago Cook Cook Cook<br />
Cook County Total: 107,590<br />
Under 3 Years 6,378 5,285 7,457 2,854 1,491 1,171<br />
Ages 3 through 5 5,096 4,218 6,268 2,677 1,313 610<br />
Ages 6 through 12 15,982 16,658 28,689 9,747 5,469 7,769<br />
Total: 27,456 26,161 42,414 15,279 8,273 9,550<br />
parents who are not <strong>in</strong> the labor<br />
<strong>for</strong>ce still seek <strong>child</strong> <strong>care</strong> <strong>in</strong> order to<br />
attend school or <strong>for</strong> other reasons<br />
such as a disability or illness. This<br />
approach also assumes that all families<br />
with every parent <strong>in</strong> the labor<br />
<strong>for</strong>ce must turn to external sources<br />
<strong>for</strong> <strong>child</strong> <strong>care</strong>, neglect<strong>in</strong>g the fact<br />
that families might have other relatives<br />
available to <strong>care</strong> <strong>for</strong> the <strong>child</strong>ren<br />
and that many parents stagger<br />
their work schedules so one parent<br />
is always available to provide <strong>care</strong>.<br />
It is important to keep these complexities<br />
<strong>in</strong> m<strong>in</strong>d when review<strong>in</strong>g the<br />
data that follow on families with all<br />
present parents work<strong>in</strong>g.<br />
Of the approximately 472,000<br />
<strong>child</strong>ren under age six <strong>in</strong> Cook<br />
County <strong>in</strong> 2000, about 50 percent,<br />
or 238,000 <strong>child</strong>ren, lived <strong>in</strong> families<br />
<strong>in</strong> which all parents present <strong>in</strong> the<br />
home were <strong>in</strong> the labor <strong>for</strong>ce. This<br />
means either the s<strong>in</strong>gle parent <strong>in</strong> a<br />
s<strong>in</strong>gle-parent family or both parents<br />
<strong>in</strong> a two-parent family were <strong>in</strong> the<br />
labor <strong>for</strong>ce. 19 The percentage of<br />
<strong>child</strong>ren <strong>in</strong> these families <strong>in</strong> suburban<br />
Cook County is 56 percent while <strong>in</strong><br />
Chicago it is 53 percent. Table V-3<br />
presents the number of such <strong>child</strong>ren<br />
<strong>in</strong> the six regions of Cook County.<br />
C. CHILDREN ELIGIBLE<br />
F O R B U T W I T H O U T C H I L D<br />
C A R E A S S I S TANCE<br />
For a family to be eligible <strong>for</strong> Ill<strong>in</strong>ois<br />
Child Care Assistance, every parent<br />
present <strong>in</strong> the home needs to be<br />
work<strong>in</strong>g, 20 and family <strong>in</strong>come can be<br />
no higher than 50 percent of the<br />
state median <strong>in</strong>come (roughly 185%<br />
of poverty level) <strong>for</strong> a family of its<br />
27<br />
size. We’ve looked at <strong>child</strong>ren <strong>in</strong><br />
families that are <strong>in</strong>come-eligible <strong>in</strong><br />
Tables V-1 and V-2 above, as well<br />
as <strong>child</strong>ren under 6 with all present<br />
parents <strong>in</strong> the labor <strong>for</strong>ce <strong>in</strong> Table<br />
V-3 above. This section takes the<br />
analysis to its next step: comb<strong>in</strong><strong>in</strong>g<br />
the two to estimate the number of<br />
<strong>child</strong>ren <strong>in</strong> the six regions of Cook<br />
County who are eligible <strong>for</strong> Ill<strong>in</strong>ois<br />
Child Care Assistance but do not<br />
receive it. 21<br />
Table V-4 presents these estimates<br />
<strong>for</strong> the different age groups and<br />
regions. We estimate that <strong>in</strong> any<br />
given month, 12 percent of Cook<br />
County <strong>child</strong>ren ages 12 and under,<br />
some 129,133 <strong>child</strong>ren, live <strong>in</strong> families<br />
that are eligible <strong>for</strong> but do not<br />
receive Ill<strong>in</strong>ois Child Care Assistance.<br />
About 17 percent of Chicago<br />
<strong>child</strong>ren are <strong>in</strong> this group of unserved
The 2006 Report of Child Care <strong>in</strong> Cook County<br />
<strong>child</strong>ren, while the suburban Cook<br />
County portion is 7 percent.<br />
Do all of these <strong>child</strong>ren have unmet<br />
need <strong>for</strong> <strong>child</strong> <strong>care</strong>? We cannot<br />
suppose that the parents of every<br />
eligible <strong>child</strong> would choose to use<br />
Ill<strong>in</strong>ois Child Care Assistance even<br />
if it were offered to them. Some<br />
might prefer to have a relative <strong>care</strong><br />
<strong>for</strong> the <strong>child</strong> (with little or no payment).<br />
Some parents might not be<br />
able to f<strong>in</strong>d a <strong>child</strong> <strong>care</strong> provider to<br />
match their off-hour or chang<strong>in</strong>g<br />
work schedules. Others might not<br />
be able to af<strong>for</strong>d to pay a provider<br />
even if they receive Assistance.<br />
Some parents stagger their work<br />
schedules <strong>in</strong> order to share car<strong>in</strong>g<br />
<strong>for</strong> their <strong>child</strong>ren. Others may have<br />
enrolled <strong>child</strong>ren <strong>in</strong> an educational<br />
program such as Head Start or<br />
Ill<strong>in</strong>ois Pre-K and are satisfied with<br />
those hours of <strong>care</strong>.<br />
The figures <strong>in</strong> Table V-4, then,<br />
should be seen as an upper end<br />
of a range rather than an on-target<br />
estimate of unmet need <strong>for</strong> Ill<strong>in</strong>ois<br />
Child Care Assistance. 22 We can<br />
say that as many as 129,133 <strong>child</strong>ren<br />
<strong>in</strong> Cook County eligible <strong>for</strong><br />
Ill<strong>in</strong>ois Child Care Assistance are<br />
not us<strong>in</strong>g it.<br />
P U B L I C D I L E M M A S<br />
The State of Ill<strong>in</strong>ois recently expanded the number of families eligible <strong>for</strong><br />
Ill<strong>in</strong>ois Child Care Assistance and has room to expand further under the<br />
federal <strong>child</strong> <strong>care</strong> block grant. Yet the work<strong>in</strong>g family of Denise and Ivan<br />
Williams, <strong>in</strong>troduced earlier <strong>in</strong> this report, rema<strong>in</strong>s <strong>in</strong>eligible.<br />
Most work<strong>in</strong>g families <strong>in</strong> Ill<strong>in</strong>ois earn more than the $32,500 that the<br />
Williamses earn annually. If this family earned $2,131 less ($30,369),<br />
they would be eligible <strong>for</strong> Child Care Assistance.<br />
Denise and Ivan pay $5,000 annually <strong>for</strong> <strong>child</strong> <strong>care</strong>, over 15 percent of<br />
their <strong>in</strong>come, while the national average spent on <strong>child</strong> <strong>care</strong> is about 7<br />
percent.* Do they deserve additional <strong>child</strong> <strong>care</strong> support? If so, do they<br />
deserve as much as the $2,600 that would reduce their <strong>child</strong> <strong>care</strong><br />
expenditure to 7 percent of their <strong>in</strong>come?<br />
Ill<strong>in</strong>ois policy makers, of course, feel they face a dilemma <strong>in</strong> balanc<strong>in</strong>g<br />
fund<strong>in</strong>g <strong>for</strong> Child Care Assistance with fund<strong>in</strong>g <strong>for</strong> other items, such as<br />
improv<strong>in</strong>g education and health <strong>in</strong>surance <strong>for</strong> <strong>child</strong>ren. And with<strong>in</strong> the<br />
Child Care Assistance Program, the State must also balance two goals:<br />
<strong>in</strong>creas<strong>in</strong>g the number of families that receive Child Care Assistance and<br />
<strong>in</strong>creas<strong>in</strong>g the amount of Assistance that goes to <strong>in</strong>dividual families<br />
already <strong>in</strong> the program.**<br />
While others may disagree, most <strong>child</strong> <strong>care</strong> advocates believe that the<br />
State of Ill<strong>in</strong>ois can contribute more to both sides of the balance without<br />
threaten<strong>in</strong>g the public treasury.<br />
** Like many work<strong>in</strong>g families they may also be eligible <strong>for</strong> a very modest <strong>child</strong> <strong>care</strong> <strong>in</strong>come tax credit.<br />
** Either way, an <strong>in</strong>crease would go directly to a <strong>child</strong> <strong>care</strong> provider and affect the quality of <strong>care</strong> that<br />
provider can offer.<br />
We should note that this estimate<br />
has important limitations. The estimate<br />
is based on 2000 Census<br />
data on families and <strong>child</strong>ren. It<br />
does not capture changes <strong>in</strong> <strong>child</strong><br />
population and family <strong>in</strong>come (that<br />
is, changes <strong>in</strong> eligibility <strong>for</strong> Child<br />
Care Assistance) over the last six<br />
years, nor does it reflect the expansion<br />
<strong>in</strong> the number of <strong>child</strong>ren eligible<br />
<strong>for</strong> Ill<strong>in</strong>ois Child Care Assistance<br />
s<strong>in</strong>ce new eligibility rules <strong>in</strong> 2004.<br />
28
VI. Child Care Choices of<br />
Cook County Families<br />
There is only limited <strong>in</strong><strong>for</strong>mation on<br />
the type of <strong>child</strong> <strong>care</strong> used by families<br />
<strong>in</strong> Cook County and the reasons<br />
beh<strong>in</strong>d parents’ choices. Much of<br />
what we do know comes from data<br />
from the Ill<strong>in</strong>ois Child Care Assistance<br />
Program and from families<br />
us<strong>in</strong>g Ill<strong>in</strong>ois <strong>Action</strong> <strong>for</strong> <strong>Children</strong>’s<br />
Resource and Referral program.<br />
The results presented <strong>in</strong> this section,<br />
however, cannot be generalized to<br />
the entire population.<br />
Figure VI-1 shows the types of <strong>care</strong><br />
used by Cook County families with<br />
Ill<strong>in</strong>ois Child Care Assistance<br />
accord<strong>in</strong>g to the age of the <strong>child</strong>ren<br />
<strong>in</strong> <strong>care</strong>. In each age group, the use<br />
of home <strong>care</strong> predom<strong>in</strong>ates over<br />
center <strong>care</strong>. The use of licenseexempt<br />
home <strong>care</strong> is especially high<br />
<strong>for</strong> school-age <strong>child</strong>ren. Sixty-eight<br />
percent of 6- to 13-year-olds and<br />
88 percent of <strong>child</strong>ren over 13 with<br />
special needs use license-exempt<br />
home <strong>care</strong>. <strong>Children</strong> under age 2<br />
are also more likely to use licenseexempt<br />
home <strong>care</strong> than center or<br />
licensed home <strong>care</strong>.<br />
The biggest use of center <strong>care</strong> is<br />
by three- through five-year-olds.<br />
This is not surpris<strong>in</strong>g consider<strong>in</strong>g<br />
there are more center slots available<br />
<strong>for</strong> this age group. Also, center <strong>care</strong><br />
is more af<strong>for</strong>dable <strong>for</strong> this age than<br />
<strong>for</strong> younger ages, and many parents<br />
wish to expose their preschool-age<br />
<strong>child</strong>ren to more <strong>for</strong>mal social<br />
sett<strong>in</strong>gs to prepare them <strong>for</strong><br />
k<strong>in</strong>dergarten.<br />
Figure VI-1. Type of Care Used by Child Age:<br />
Cook County Families With Child Care Assistance<br />
Source: Ill<strong>in</strong>ois Child Care Assistance Program data, June 2006<br />
100%<br />
50%<br />
0%<br />
22% 28%<br />
49%<br />
36%<br />
24%<br />
41% 43%<br />
16%<br />
Under Age 2 Age 2 Ages 3 to 5 Ages 6 to 13 Over 13<br />
(special needs)<br />
40%<br />
19% 13%<br />
68%<br />
11%<br />
1%<br />
■ Center Care ■ Licensed Home Care Exempt Home Care<br />
Figure VI-2. Type of Care Used by Region:<br />
Cook County Families with Child Care Assistance<br />
Source: Ill<strong>in</strong>ois Child Care Assistance data, June 2006<br />
100%<br />
50%<br />
0%<br />
54%<br />
23% 31%<br />
23% 21%<br />
63%<br />
33%<br />
20%<br />
57%<br />
84%<br />
7% 15%<br />
24% 31%<br />
N & NW C & W S & SW N & NW West S & SW<br />
Chicago Chicago Chicago Suburban Suburban Suburban<br />
Cook Cook Cook<br />
56%<br />
■ Center Care ■ Licensed Home Care Exempt Home Care<br />
88%<br />
55%<br />
18%<br />
37%<br />
29
The 2006 Report of Child Care <strong>in</strong> Cook County<br />
Figure VI-3. Follow Up Survey: Ability to F<strong>in</strong>d Child Care<br />
Source: Ill<strong>in</strong>ois <strong>Action</strong> <strong>for</strong> <strong>Children</strong> Resource and Referral Program, 2006<br />
1,500<br />
750<br />
0<br />
223<br />
1,050<br />
Figure VI-2 presents differences <strong>in</strong><br />
use of center <strong>care</strong>, licensed home<br />
<strong>care</strong> and license-exempt home <strong>care</strong><br />
<strong>for</strong> the six regions of Cook County. 23<br />
In the North and Northwest suburban<br />
region, an overwhelm<strong>in</strong>g number of<br />
families with Child Care Assistance,<br />
84 percent, use center <strong>care</strong>. The<br />
rema<strong>in</strong><strong>in</strong>g suburban regions as well<br />
as the North and Northwest Chicago<br />
region use center and home <strong>care</strong> <strong>in</strong><br />
roughly equal proportions. Families<br />
<strong>in</strong> the South and Southwest Chicago<br />
region and the Central and West<br />
Chicago region have the highest<br />
use of license-exempt home <strong>care</strong><br />
and the lowest use of center <strong>care</strong>.<br />
1,585<br />
Keep<strong>in</strong>g Did Not F<strong>in</strong>d Found No Decided Not<br />
Former Care, Still Care Decision to Use<br />
Care Look<strong>in</strong>g Child Care<br />
302<br />
153<br />
Another source of <strong>in</strong><strong>for</strong>mation on<br />
parents’ <strong>child</strong> <strong>care</strong> decisions comes<br />
from the Ill<strong>in</strong>ois <strong>Action</strong> <strong>for</strong> <strong>Children</strong><br />
Resource and Referral program.<br />
Parents use this service because<br />
they want or need to f<strong>in</strong>d a <strong>care</strong>giver<br />
beyond or <strong>in</strong> addition to a relative or<br />
friend they already know. Data from<br />
this program represent parents who<br />
seek ma<strong>in</strong>ly licensed home <strong>care</strong> or<br />
center <strong>care</strong>, though these parents<br />
may ultimately decide to use<br />
license-exempt home <strong>care</strong>.<br />
Ill<strong>in</strong>ois <strong>Action</strong> <strong>for</strong> <strong>Children</strong> asks all<br />
parents who seek <strong>child</strong> <strong>care</strong> referrals<br />
to complete a follow up survey<br />
on their search experience. In 2006,<br />
twenty-three percent of families<br />
responded to the survey.<br />
Did parents have success <strong>in</strong> f<strong>in</strong>d<strong>in</strong>g<br />
<strong>child</strong> <strong>care</strong>? Forty-eight percent of<br />
respondents said that they had<br />
<strong>in</strong>deed found <strong>child</strong> <strong>care</strong>, though we<br />
do not have a sense of their overall<br />
satisfaction with the <strong>care</strong> they<br />
found. Another 32 percent said they<br />
were still look<strong>in</strong>g <strong>for</strong> <strong>care</strong>. Figure<br />
VI-3 shows the complete breakdown<br />
of responses.<br />
F<strong>in</strong>ally we asked parents what<br />
problems they encountered while<br />
search<strong>in</strong>g <strong>for</strong> <strong>child</strong> <strong>care</strong>. Fifty-five<br />
percent of families stated they<br />
had no problems f<strong>in</strong>d<strong>in</strong>g <strong>care</strong>. Of<br />
families report<strong>in</strong>g one or more problems,<br />
the top issues they encountered<br />
were no open<strong>in</strong>gs, problems<br />
with the location of <strong>care</strong> and schedule<br />
and cost problems. Of course,<br />
many of these problems are <strong>in</strong>terrelated—a<br />
parent might f<strong>in</strong>d no open<strong>in</strong>gs<br />
at the cost they can af<strong>for</strong>d <strong>in</strong><br />
the areas <strong>in</strong> which they are search<strong>in</strong>g.<br />
Figure VI-4 shows the frequency<br />
of problems encountered.<br />
Figure VI-4.<br />
Problems Encountered<br />
When Seek<strong>in</strong>g Child Care<br />
Source: Ill<strong>in</strong>ois <strong>Action</strong> <strong>for</strong> <strong>Children</strong> Resource<br />
and Referral Program, 2006<br />
Quality<br />
9%<br />
Location 15%<br />
Other<br />
9%<br />
14%<br />
Cost<br />
9%<br />
Type of Care<br />
Curriculum 2%<br />
Schedule<br />
14% 27%<br />
No Open<strong>in</strong>gs<br />
30
Footnotes<br />
1 Consumer prices as measured by CPI-U by U.S.<br />
Department of Labor, Bureau of Labor Statistics;<br />
http://data.bls.gov/cgi-b<strong>in</strong>/surveymost, accessed<br />
November 8, 2006.<br />
2 2005 American Community Survey, U.S. Census<br />
Bureau. This is the last year available at the time of<br />
writ<strong>in</strong>g. The Census does not present data on suburban<br />
Cook County as we do.<br />
3 Average annual tuition and fees paid <strong>for</strong> a 4-year<br />
public <strong>in</strong>stitution <strong>in</strong> Ill<strong>in</strong>ois <strong>for</strong> the 2006-2007<br />
school year, from www.collegeill<strong>in</strong>ois.com.<br />
4 See <strong>for</strong> example, the National Child Care Survey,<br />
1990 and Child Care Expenses of American<br />
Families, Urban Institute, 1997. The Census<br />
Bureau f<strong>in</strong>ds that <strong>child</strong> <strong>care</strong> payments average<br />
6.9 percent <strong>for</strong> families with mothers and with<br />
<strong>child</strong>ren under 15, and average 7.2 percent if the<br />
mother has a job. Hav<strong>in</strong>g more <strong>child</strong>ren or lower<br />
<strong>in</strong>comes raises the percentages. Who’s M<strong>in</strong>d<strong>in</strong>g<br />
the Kids? Child Care Arrangements: W<strong>in</strong>ter 2002,<br />
U.S. Bureau of the Census, Oct. 2005, Table 6.<br />
5 If we used 6 percent as a rule of thumb, these<br />
<strong>in</strong>comes must be at least $151,700 and $267,500<br />
respectively <strong>in</strong> Chicago and $185,800 and<br />
$320,800 <strong>in</strong> suburban Cook County.<br />
6 For details, see the follow<strong>in</strong>g:<br />
http://www.act<strong>for</strong><strong>child</strong>ren.org/_uploads/<br />
documents/live/Cost_of_Care_1Child_Family_of_4<br />
_FY07.pdf.<br />
7 In some cases, the parent(s) can be <strong>in</strong> school<br />
<strong>in</strong>stead of work<strong>in</strong>g. The chart assumes that parents<br />
receiv<strong>in</strong>g Child Care Assistance pay their assigned<br />
co-payment as well as the difference between the<br />
price their <strong>child</strong> <strong>care</strong> provider charges and the rate<br />
their provider is reimbursed by the Child Care<br />
Assistance Program.<br />
8 In this and the next bullet, centers that are Pre-K or<br />
Head Start-only programs are not <strong>in</strong>cluded <strong>in</strong> the<br />
percentage.<br />
9 Even when the number of slots is known, it is<br />
only an estimate of the number of <strong>child</strong>ren served.<br />
Some providers might have empty slots, <strong>in</strong> which<br />
case the number of slots exceeds the number of<br />
<strong>child</strong>ren <strong>in</strong> the <strong>care</strong> of these providers. On the<br />
other hand, two or more part-time <strong>child</strong>ren might<br />
fill some slots, <strong>in</strong> which case the number of <strong>child</strong>ren<br />
<strong>in</strong> <strong>care</strong> exceeds the number of slots.<br />
10 A home’s operator might not want to provide <strong>care</strong><br />
<strong>for</strong> the home’s full legal or licensed capacity.<br />
11 The number of participat<strong>in</strong>g providers fluctuates<br />
from month to month just as the number of participat<strong>in</strong>g<br />
families fluctuates. In October, 2005, <strong>for</strong><br />
<strong>in</strong>stance, there were 25,328 participat<strong>in</strong>g licenseexempt<br />
home providers.<br />
12 If the <strong>child</strong>ren are all related, the provider can <strong>care</strong><br />
<strong>for</strong> more than three at one time.<br />
13 The fact that many, though not all, license-exempt<br />
homes do not strictly offer slots but have more<br />
personal and variable enrollment creates enormous<br />
problems <strong>for</strong> estimat<strong>in</strong>g <strong>child</strong> <strong>care</strong> supply and<br />
demand. A related but smaller problem is that<br />
while centers and homes are legally licensed <strong>for</strong><br />
a certa<strong>in</strong> number of <strong>child</strong>ren, some restrict their<br />
actual enrollment to a smaller number.<br />
14 These are slots <strong>for</strong> which an age is specifically<br />
mentioned. There may be some double count<strong>in</strong>g<br />
<strong>in</strong> as much as a center might offer a slot to either<br />
four-year-olds or five-year-olds. About 11,000 slots<br />
have no age attached.<br />
15 Work<strong>in</strong>g Later In Ill<strong>in</strong>ois: Work Schedules, Incomes<br />
and Parents’ Access To Child Care, Ill<strong>in</strong>ois <strong>Action</strong><br />
<strong>for</strong> <strong>Children</strong>, 2006.<br />
16 Ibid.<br />
17 Here even<strong>in</strong>g <strong>care</strong> is def<strong>in</strong>ed as <strong>care</strong> provided<br />
between 7 p.m. and 2 a.m., while overnight <strong>care</strong><br />
is <strong>care</strong> provided between 2 a.m. and 5 a.m.<br />
18 Here low <strong>in</strong>come means below 185 percent of the<br />
federal poverty level. Of course, a closer look at<br />
each region would f<strong>in</strong>d that some smaller areas<br />
with<strong>in</strong> a region have more heavily concentrated<br />
poverty and lower <strong>in</strong>comes than others.<br />
19 Technically the labor <strong>for</strong>ce <strong>in</strong>cludes unemployed<br />
people look<strong>in</strong>g <strong>for</strong> work. We count these, s<strong>in</strong>ce<br />
parents look<strong>in</strong>g <strong>for</strong> work need <strong>child</strong> <strong>care</strong>. Another<br />
27 percent of <strong>child</strong>ren live <strong>in</strong> two-parent families<br />
that have only one parent <strong>in</strong> the labor <strong>for</strong>ce.<br />
20 In Ill<strong>in</strong>ois, parents may be <strong>in</strong> tra<strong>in</strong><strong>in</strong>g or school,<br />
but <strong>in</strong> practice relatively few parents get approval<br />
unless they work outside of the home.<br />
21 To arrive at the measure of <strong>child</strong>ren with a possible<br />
unmet need <strong>for</strong> <strong>child</strong> <strong>care</strong> assistance, we (1) comb<strong>in</strong>e<br />
<strong>in</strong><strong>for</strong>mation on <strong>in</strong>come-eligibility and workeligibility<br />
to estimate the number of <strong>child</strong>ren who<br />
are eligible <strong>for</strong> Ill<strong>in</strong>ois Child Care Assistance and<br />
(2) from this number, subtract the number of <strong>child</strong>ren<br />
who actually received that assistance <strong>in</strong> a<br />
recent month (June 2006).<br />
22 Of course, some parents who are currently<br />
<strong>in</strong>eligible because they have higher <strong>in</strong>comes or<br />
who are <strong>in</strong> tra<strong>in</strong><strong>in</strong>g or <strong>in</strong> school might have a need<br />
<strong>for</strong> <strong>child</strong> <strong>care</strong> assistance and would use it if they<br />
were eligible. In this sense, our estimate undercounts<br />
some need.<br />
23 S<strong>in</strong>ce some parents use more than one type of<br />
<strong>child</strong> <strong>care</strong> while their case is active, percentages<br />
can exceed 100 percent.<br />
31
Conclusion<br />
F<strong>in</strong>d<strong>in</strong>g the right <strong>child</strong> <strong>care</strong> is one<br />
of the most important decisions<br />
that a parent faces, and with more<br />
options, the likelihood is greater that<br />
parents will succeed <strong>in</strong> f<strong>in</strong>d<strong>in</strong>g the<br />
provider best suited <strong>for</strong> their <strong>child</strong>.<br />
But costs, schedules and availability<br />
limit parents’ choices, this is especially<br />
true <strong>for</strong> low <strong>in</strong>come parents.<br />
Each <strong>in</strong>dividual <strong>child</strong> <strong>care</strong> program<br />
has characteristics that parents may<br />
f<strong>in</strong>d attractive—perhaps an especially<br />
warm and experienced <strong>care</strong>giver,<br />
a well-developed curriculum, a <strong>care</strong>giver<br />
with experience with a particular<br />
disability, or a colorful, <strong>in</strong>vit<strong>in</strong>g facility.<br />
Ideally a family’s ultimate decision<br />
would be based on the program’s<br />
quality and ability to meet the <strong>child</strong>’s<br />
<strong>in</strong>dividual needs.<br />
Un<strong>for</strong>tunately, limit<strong>in</strong>g factors play a<br />
role <strong>in</strong> the decision-mak<strong>in</strong>g process,<br />
particularly <strong>for</strong> middle and low-<strong>in</strong>come<br />
families. Most significantly, the high<br />
cost of center or licensed home<br />
programs can prohibit families from<br />
us<strong>in</strong>g these types of <strong>care</strong>. While the<br />
Ill<strong>in</strong>ois Child Care Assistance program<br />
helps some families access<br />
these services, not all families who<br />
need assistance qualify <strong>for</strong> it, and<br />
sometimes even with assistance,<br />
these <strong>child</strong> <strong>care</strong> sett<strong>in</strong>gs still can be<br />
too costly.<br />
Families are also limited by the number<br />
of <strong>child</strong> <strong>care</strong> open<strong>in</strong>gs <strong>in</strong> their<br />
community. We f<strong>in</strong>d this particularly<br />
the case <strong>for</strong> parents seek<strong>in</strong>g <strong>in</strong>fant<br />
<strong>care</strong>. Other families f<strong>in</strong>d that it is<br />
not just about f<strong>in</strong>d<strong>in</strong>g open<strong>in</strong>gs, but<br />
f<strong>in</strong>d<strong>in</strong>g them at the right times. A<br />
grow<strong>in</strong>g number of families work<br />
outside the traditional Monday<br />
through Friday daytime schedule,<br />
yet most center and licensed home<br />
sett<strong>in</strong>gs do not offer <strong>care</strong> <strong>in</strong> the<br />
even<strong>in</strong>gs, overnight or on weekends.<br />
While many types of <strong>child</strong> <strong>care</strong><br />
exist, the reality is that many families<br />
do not have options. We hope this<br />
report will provide <strong>in</strong>sight <strong>in</strong>to the<br />
realities faced by work<strong>in</strong>g families<br />
and the types of support that these<br />
families and their <strong>child</strong> <strong>care</strong><br />
providers need.<br />
We hope these data on <strong>child</strong> <strong>care</strong><br />
supply and demand can guide<br />
advocates and policy makers as<br />
they work to improve the accessibility<br />
of quality <strong>child</strong> <strong>care</strong> <strong>for</strong> all families<br />
who seek it <strong>in</strong> Cook County and the<br />
State of Ill<strong>in</strong>ois.<br />
33
A P P E N D I X 1<br />
The Six Cook County Regions<br />
Chicago and Suburban Cook Regions<br />
Throughout this Report we divide<br />
Cook County <strong>in</strong>to six geographical<br />
regions: three <strong>in</strong> Chicago and three<br />
<strong>in</strong> suburban Cook County. The map<br />
and tables on the next two pages of<br />
this Appendix def<strong>in</strong>e the six regions.<br />
The most recognizable <strong>for</strong>m of<br />
Chicago geographical units are the<br />
Chicago Community Areas, which<br />
correspond to city neighborhoods.<br />
This Appendix places the seventyseven<br />
Chicago Community Areas<br />
<strong>in</strong>to three Chicago regions: North<br />
and Northwest Chicago; Central<br />
and West Chicago; and South and<br />
Southwest Chicago.<br />
The most recognizable Cook<br />
County geographical units are<br />
municipalities. The Appendix identifies<br />
the three suburban Cook<br />
County regions accord<strong>in</strong>g to the<br />
Cook County municipalities belong<strong>in</strong>g<br />
to each region: North and<br />
Northwest Suburban Cook County;<br />
West Suburban Cook County; and<br />
South and Southwest Suburban<br />
Cook County.<br />
When present<strong>in</strong>g census data <strong>for</strong><br />
Chicago and Cook County <strong>in</strong> this<br />
report, we built our aggregate units<br />
from data <strong>for</strong> the <strong>in</strong>dividual Chicago<br />
Community Areas and municipalities.<br />
Our aggregate data, there<strong>for</strong>e,<br />
may deviate somewhat from aggregate<br />
data provided by the U.S.<br />
Census.<br />
35
The 2006 Report of Child Care <strong>in</strong> Cook County<br />
N O RT H A N D<br />
N O RTHWEST<br />
S U B U R B A N<br />
COOK<br />
Arl<strong>in</strong>gton Heights<br />
Barr<strong>in</strong>gton<br />
Bartlett<br />
Des Pla<strong>in</strong>es<br />
East Dundee<br />
Elg<strong>in</strong><br />
Elk Grove Village<br />
Elmwood Park<br />
Evanston<br />
Frankl<strong>in</strong> Park<br />
Glencoe<br />
Glenview<br />
Golf<br />
Hanover Park<br />
Harwood Heights<br />
Hoffman Estates<br />
Inverness<br />
Kenilworth<br />
L<strong>in</strong>colnwood<br />
Morton Grove<br />
Mount Prospect<br />
Niles<br />
Norridge<br />
Northbrook<br />
Northfield<br />
Northlake<br />
Palat<strong>in</strong>e<br />
Park Ridge<br />
Prospect Heights<br />
River Grove<br />
Roll<strong>in</strong>g Meadows<br />
Rosemont<br />
Schaumburg<br />
Schiller Park<br />
Skokie<br />
South Barr<strong>in</strong>gton<br />
Streamwood<br />
Wheel<strong>in</strong>g<br />
Wilmette<br />
W<strong>in</strong>netka<br />
W E S T<br />
S U B U R B A N<br />
COOK<br />
Bed<strong>for</strong>d Park<br />
Bellwood<br />
Berkeley<br />
Berwyn<br />
Bridgeview<br />
Broadview<br />
Brookfield<br />
Burr Ridge<br />
Cicero<br />
Countryside<br />
Forest Park<br />
Forest View<br />
Hillside<br />
Hodgk<strong>in</strong>s<br />
Indian Head Park<br />
Justice<br />
La Grange<br />
La Grange Park<br />
Lyons<br />
Maywood<br />
McCook<br />
Melrose Park<br />
North Riverside<br />
Oak Park<br />
River Forest<br />
Riverside<br />
Stickney<br />
Stone Park<br />
Summit<br />
Westchester<br />
Western Spr<strong>in</strong>gs<br />
Willow Spr<strong>in</strong>gs<br />
S O U T H A N D<br />
S O U T H W E S T<br />
S U B U R B A N<br />
COOK<br />
Alsip<br />
Blue Island<br />
Burbank<br />
Burnham<br />
Calumet City<br />
Calumet Park<br />
Chicago Heights<br />
Chicago Ridge<br />
Country Club Hills<br />
Crestwood<br />
Dixmoor<br />
Dolton<br />
East Hazel Crest<br />
Evergreen Park<br />
Flossmoor<br />
Ford Heights<br />
Glenwood<br />
Harvey<br />
Hazel Crest<br />
Hickory Hills<br />
Hometown<br />
Homewood<br />
Lans<strong>in</strong>g<br />
Lemont<br />
Lynwood<br />
Markham<br />
Matteson<br />
Merrionette Park<br />
Midlothian<br />
Oak Forest<br />
Oak Lawn<br />
Olympia Fields<br />
Orland Hills<br />
Orland Park<br />
Palos Heights<br />
Palos Hills<br />
Palos Park<br />
Park Forest<br />
Phoenix<br />
Posen<br />
Richton Park<br />
Riverdale<br />
Robb<strong>in</strong>s<br />
Sauk Village<br />
South Chicago Heights<br />
South Holland<br />
Steger<br />
Thornton<br />
T<strong>in</strong>ley Park<br />
Worth<br />
N O RT H A N D<br />
N O RTHWEST<br />
CHICAGO<br />
Albany Park<br />
Avondale<br />
Belmont Crag<strong>in</strong><br />
Dunn<strong>in</strong>g<br />
Edgewater<br />
Edison Park<br />
Forest Glen<br />
Hermosa<br />
Irv<strong>in</strong>g Park<br />
Jefferson Park<br />
Lake View<br />
L<strong>in</strong>coln Park<br />
L<strong>in</strong>coln Square<br />
Logan Square<br />
Montclare<br />
North Center<br />
North Park<br />
Norwood Park<br />
O’Hare<br />
Portage Park<br />
Rogers Park<br />
Uptown<br />
West Ridge<br />
C E N T R A L A N D<br />
WEST CHICAGO<br />
Aust<strong>in</strong><br />
East Garfield Park<br />
Humboldt Park<br />
Loop<br />
Lower West Side<br />
Near North Side<br />
Near South Side<br />
Near West Side<br />
North Lawndale<br />
South Lawndale<br />
West Garfield Park<br />
West Town<br />
S O U T H A N D<br />
S O U T H W E S T<br />
CHICAGO<br />
Archer Heights<br />
Armour Square<br />
Ashburn<br />
Auburn Gresham<br />
Avalon Park<br />
Beverly<br />
Bridgeport<br />
Brighton Park<br />
Burnside<br />
Calumet Heights<br />
Chatham<br />
Chicago Lawn<br />
Clear<strong>in</strong>g<br />
Douglas<br />
East Side<br />
Englewood<br />
Fuller Park<br />
Gage Park<br />
Garfield Ridge<br />
Grand Boulevard<br />
Greater Grand Cross<strong>in</strong>g<br />
Hegewisch<br />
Hyde Park<br />
Kenwood<br />
McK<strong>in</strong>ley Park<br />
Morgan Park<br />
Mount Greenwood<br />
New City<br />
Oakland<br />
Pullman<br />
Riverdale<br />
Roseland<br />
South Chicago<br />
South Deer<strong>in</strong>g<br />
South Shore<br />
Wash<strong>in</strong>gton Heights<br />
Wash<strong>in</strong>gton Park<br />
West Elsdon<br />
West Englewood<br />
West Lawn<br />
West Pullman<br />
Woodlawn<br />
36
A P P E N D I X 2<br />
The Demand <strong>for</strong> and Supply of<br />
Child Care—Basic Factors<br />
W H Y D E M A N D A N D<br />
S U P P LY ?<br />
Many analysts believe that understand<strong>in</strong>g<br />
the demand <strong>for</strong> and supply<br />
of <strong>child</strong> <strong>care</strong> is critical. Without<br />
such knowledge, we can never<br />
know whether a region such as<br />
Cook County has enough <strong>child</strong> <strong>care</strong><br />
services. Nor can we understand<br />
why <strong>child</strong> <strong>care</strong> prices are ris<strong>in</strong>g or<br />
what the effects of ris<strong>in</strong>g rates are:<br />
<strong>for</strong> example, whether ris<strong>in</strong>g prices<br />
primarily drive work<strong>in</strong>g parents away<br />
from us<strong>in</strong>g <strong>child</strong> <strong>care</strong> or primarily<br />
encourage <strong>child</strong> <strong>care</strong> providers to<br />
expand and provide higher quality<br />
<strong>care</strong>. F<strong>in</strong>ally, understand<strong>in</strong>g supply<br />
and demand helps us understand<br />
ways to <strong>in</strong>fluence <strong>child</strong> <strong>care</strong> prices,<br />
expand the use of <strong>child</strong> <strong>care</strong> among<br />
work<strong>in</strong>g parents and improve <strong>child</strong><br />
<strong>care</strong> quality. This Appendix discusses<br />
the basic concepts of demand and<br />
supply <strong>in</strong> <strong>child</strong> <strong>care</strong> and shows why<br />
it is so difficult to speak about them<br />
authoritatively.<br />
Demand<br />
Families with <strong>child</strong>ren who want and<br />
can af<strong>for</strong>d to place their <strong>child</strong>ren <strong>in</strong><br />
<strong>child</strong> <strong>care</strong> are the source <strong>for</strong> demand<br />
<strong>for</strong> <strong>child</strong> <strong>care</strong> <strong>in</strong> Cook County. Their<br />
demand is simply how much <strong>child</strong><br />
<strong>care</strong> services they would buy at a<br />
go<strong>in</strong>g price. In general, the size of<br />
this demand depends upon the number<br />
of <strong>child</strong>ren of <strong>child</strong> <strong>care</strong> age <strong>in</strong><br />
those families, from <strong>in</strong>fants to older<br />
<strong>child</strong>ren need<strong>in</strong>g be<strong>for</strong>e- or afterschool<br />
<strong>care</strong>. Demand also has<br />
deeper roots <strong>in</strong>clud<strong>in</strong>g these factors:<br />
• Whether family <strong>in</strong>comes are<br />
sufficient to pay <strong>for</strong> <strong>child</strong> <strong>care</strong>,<br />
especially <strong>in</strong> comparison to the<br />
prices of other necessities the<br />
family buys.<br />
• Whether families have access to<br />
<strong>child</strong> <strong>care</strong> assistance programs<br />
to help pay <strong>for</strong> <strong>child</strong> <strong>care</strong> when<br />
they cannot af<strong>for</strong>d to buy it<br />
directly. For example, work<strong>in</strong>g<br />
families’ access to Ill<strong>in</strong>ois Child<br />
Care Assistance s<strong>in</strong>ce 1997 has<br />
provided a powerful stimulus to<br />
demand <strong>for</strong> <strong>child</strong> <strong>care</strong> <strong>in</strong> Ill<strong>in</strong>ois.<br />
• Whether parents can af<strong>for</strong>d to<br />
stay at home with <strong>child</strong>ren or<br />
receive <strong>in</strong>come from programs<br />
such as the now-term<strong>in</strong>ated Aid<br />
to Families with Dependent<br />
<strong>Children</strong> that allows them to<br />
rema<strong>in</strong> home with <strong>child</strong>ren.<br />
• Whether families have available<br />
substitutes to purchas<strong>in</strong>g <strong>child</strong><br />
<strong>care</strong>, such as these:<br />
• Relatives who can <strong>care</strong> <strong>for</strong><br />
<strong>child</strong>ren while parents work.<br />
• Alternative <strong>care</strong> that is available<br />
and subsidized (Head<br />
Start, state pre-K programs,<br />
and so on).<br />
• Work schedules that allow<br />
parents <strong>in</strong> two-parent families<br />
to share <strong>care</strong>—one car<strong>in</strong>g <strong>for</strong><br />
<strong>child</strong>ren while the other works.<br />
• Parents’ preferences about<br />
lett<strong>in</strong>g others <strong>care</strong> <strong>for</strong> their <strong>child</strong>ren.<br />
This factor beh<strong>in</strong>d parents’<br />
demand often depends on the<br />
<strong>child</strong>’s age.<br />
• Parents’ perceptions of the<br />
quality of <strong>care</strong> available.<br />
How much <strong>child</strong> <strong>care</strong> Cook County<br />
families will want to purchase<br />
depends on all of these factors.<br />
With these factors <strong>in</strong> the background,<br />
the amount of <strong>care</strong> families<br />
actually purchase and use depends<br />
on the price and availability (or<br />
supply) of this <strong>care</strong>.<br />
Supply<br />
Individual providers, educators, nonprofit<br />
enterprises, <strong>for</strong>-profit enterprises<br />
and public agencies supply<br />
<strong>child</strong> <strong>care</strong> services <strong>in</strong> Cook County<br />
by mobiliz<strong>in</strong>g people, facilities and<br />
materials <strong>for</strong> the purpose of car<strong>in</strong>g<br />
<strong>for</strong> <strong>child</strong>ren. As Section II of this<br />
Report demonstrates, <strong>child</strong> <strong>care</strong><br />
takes a variety of shapes across<br />
Cook County, <strong>in</strong>clud<strong>in</strong>g providers <strong>in</strong><br />
their own homes, <strong>care</strong>givers who go<br />
to the <strong>child</strong>ren’s homes, non-profit<br />
and <strong>for</strong>-profit centers, public and<br />
private preschools, after-school programs<br />
and so on. Many <strong>child</strong> <strong>care</strong><br />
program developers and directors<br />
also engage diverse agencies that<br />
f<strong>in</strong>ance, regulate zon<strong>in</strong>g, license<br />
and accredit <strong>child</strong> <strong>care</strong>. F<strong>in</strong>ally they<br />
recruit <strong>in</strong> labor markets <strong>for</strong> the <strong>child</strong><br />
<strong>care</strong> work<strong>for</strong>ce and contract with<br />
suppliers of goods and services,<br />
such as food, build<strong>in</strong>g ma<strong>in</strong>tenance<br />
and books.<br />
Child <strong>care</strong> supply is based upon the<br />
will<strong>in</strong>gness and ability of providers<br />
to br<strong>in</strong>g people and such resources<br />
together given the cost of the<br />
resources they need. Among the<br />
37
The 2006 Report of Child Care <strong>in</strong> Cook County<br />
factors that we expect to <strong>in</strong>fluence<br />
the supply of <strong>child</strong> <strong>care</strong> services <strong>in</strong><br />
Cook County are the follow<strong>in</strong>g:<br />
• The cost of resources such as<br />
facilities, materials, equipment,<br />
supplies, overhead and especially<br />
employees.<br />
• Public, non-profit or donor<br />
subsidies of <strong>child</strong> <strong>care</strong>, <strong>in</strong>clud<strong>in</strong>g<br />
wage supplements if any exist.<br />
For example, if a religious congregation<br />
or a community agency<br />
decides to supply space rent-free<br />
or at a discounted rent, this will<br />
generally <strong>in</strong>crease the supply of<br />
<strong>child</strong> <strong>care</strong> services <strong>in</strong> Cook County.<br />
• Regulatory conditions <strong>in</strong>clud<strong>in</strong>g<br />
bus<strong>in</strong>ess, zon<strong>in</strong>g, <strong>child</strong> <strong>care</strong><br />
accreditation and licens<strong>in</strong>g<br />
restrictions. These change little<br />
from year to year, and so do not<br />
change <strong>child</strong> <strong>care</strong> supply much<br />
from year to year. They can, however,<br />
affect the overall level of<br />
<strong>child</strong> <strong>care</strong> operations. And <strong>in</strong><br />
some localities, zon<strong>in</strong>g changes<br />
have seriously affected providers.<br />
How much <strong>child</strong> <strong>care</strong> providers<br />
want to supply <strong>in</strong> Cook County will<br />
depend on all of these factors. Even<br />
non-profit providers must cover their<br />
basic costs and respect these restrictions<br />
on offer<strong>in</strong>g services. The<br />
amount of <strong>care</strong> that they actually<br />
provide at any given time depends<br />
on the <strong>in</strong>come providers derive from<br />
this <strong>care</strong>.<br />
U S I N G S U P P LY A N D<br />
D E M A N D A N A LY S I S<br />
In economic theory, the price of<br />
<strong>child</strong> <strong>care</strong> services and the amount<br />
actually bought is determ<strong>in</strong>ed by<br />
levels of demand and supply. If the<br />
demand <strong>for</strong> <strong>child</strong> <strong>care</strong> is greater<br />
than the amount supplied, the price<br />
will rise as parents seek scarce<br />
slots <strong>for</strong> their <strong>child</strong>ren. On the other<br />
hand, if supply exceeds demand,<br />
providers may drop their prices to<br />
attract more <strong>child</strong>ren. That is the socalled<br />
law of supply and demand.<br />
To determ<strong>in</strong>e whether or not a <strong>child</strong><br />
<strong>care</strong> market actually works this way<br />
<strong>in</strong> Cook County would require a<br />
special study. The key po<strong>in</strong>t we want<br />
to underscore here is that because<br />
so many factors affect demand and<br />
supply understand<strong>in</strong>g the total effect<br />
will be extremely complex.<br />
Supply and demand analysis must<br />
<strong>in</strong>corporate this complexity <strong>in</strong> order<br />
to be useful. It must first of all be<br />
based on excellent knowledge of<br />
all the factors identified above as<br />
<strong>in</strong>fluenc<strong>in</strong>g <strong>child</strong> <strong>care</strong> demand and<br />
supply. Leav<strong>in</strong>g out any factor could<br />
spoil an analysis. Supply and demand<br />
analysis must, moreover, weigh the<br />
effects of all the factors <strong>in</strong>fluenc<strong>in</strong>g<br />
the <strong>child</strong> <strong>care</strong> market simultaneously.<br />
So complex is supply and demand<br />
analysis, <strong>in</strong> fact, that most economists<br />
rely on sophisticated statistical<br />
and mathematical tools to per<strong>for</strong>m it.<br />
Short of that sophisticated, comprehensive<br />
analysis, supply and<br />
demand analysis will be very partial<br />
or one-sided, and when we use it<br />
we should acknowledge it as such.<br />
For example, suppose we know that<br />
new <strong>child</strong> <strong>care</strong> center licens<strong>in</strong>g<br />
regulations will require <strong>child</strong> <strong>care</strong><br />
teachers to have more education<br />
credits <strong>in</strong> college. We might predict<br />
that salaries of these teachers must<br />
rise to reimburse them <strong>for</strong> obta<strong>in</strong><strong>in</strong>g<br />
the additional credentials, and that<br />
will <strong>in</strong>crease the cost of provid<strong>in</strong>g<br />
<strong>child</strong> <strong>care</strong>. Higher costs of provid<strong>in</strong>g<br />
<strong>child</strong> <strong>care</strong>, <strong>in</strong> turn, will lower the<br />
amount of <strong>child</strong> <strong>care</strong> supplied, as<br />
some providers will leave the bus<strong>in</strong>ess<br />
because they cannot af<strong>for</strong>d to<br />
pay the newly credentialed teachers<br />
what they demand. We can conclude<br />
that if noth<strong>in</strong>g else is chang<strong>in</strong>g <strong>in</strong><br />
the <strong>child</strong> <strong>care</strong> market, lower supply<br />
will drive up the amount parents<br />
need to pay to f<strong>in</strong>d scarcer slots.<br />
Too frequently, however, analysts do<br />
not acknowledge what we just stated<br />
<strong>in</strong> the italics above. They leave the<br />
impression that they have told the<br />
entire story. We should always<br />
acknowledge that other events <strong>in</strong> the<br />
<strong>child</strong> <strong>care</strong> market might outweigh<br />
the factor we are rais<strong>in</strong>g at the<br />
moment. Perhaps teacher salaries<br />
will not rise that much, or the new<br />
credentials will attract enough new<br />
<strong>child</strong>ren to centers to cover the<br />
higher costs. Or perhaps <strong>in</strong> the next<br />
month, <strong>for</strong> example, the State of Ill<strong>in</strong>ois<br />
will greatly <strong>in</strong>crease its subsidies<br />
to <strong>child</strong> <strong>care</strong> providers. That will<br />
lower costs and could even reverse<br />
the impact of higher salaries on<br />
supply—if noth<strong>in</strong>g else is chang<strong>in</strong>g.<br />
38
A P P E N D I X 3<br />
Sources <strong>for</strong> Data on Child Care<br />
Providers <strong>in</strong> Cook County<br />
Our <strong>in</strong><strong>for</strong>mation about <strong>child</strong> <strong>care</strong><br />
providers <strong>in</strong> Cook County comes<br />
from three different sources:<br />
1. The Ill<strong>in</strong>ois <strong>Action</strong> <strong>for</strong> <strong>Children</strong><br />
Resource and Referral Program,<br />
which ma<strong>in</strong>ta<strong>in</strong>s a database of<br />
Cook County <strong>child</strong> <strong>care</strong> providers.<br />
2. The Ill<strong>in</strong>ois Child Care Assistance<br />
Program, which has <strong>in</strong><strong>for</strong>mation<br />
about providers who <strong>care</strong> <strong>for</strong> <strong>child</strong>ren<br />
with <strong>child</strong> <strong>care</strong> assistance.<br />
3. The Ill<strong>in</strong>ois Department of <strong>Children</strong><br />
and Family Services (DCFS),<br />
which lists programs that it has<br />
licensed <strong>in</strong> Cook County.<br />
The first two programs are adm<strong>in</strong>istered<br />
<strong>in</strong> Cook County by Ill<strong>in</strong>ois <strong>Action</strong><br />
<strong>for</strong> <strong>Children</strong> <strong>for</strong> the State of Ill<strong>in</strong>ois.<br />
Ill<strong>in</strong>ois <strong>Action</strong> <strong>for</strong> <strong>Children</strong> has the<br />
best current lists <strong>for</strong> license-exempt<br />
<strong>child</strong> <strong>care</strong> centers and homes, but<br />
because not all centers and homes<br />
participate <strong>in</strong> the State programs,<br />
the lists are <strong>in</strong>complete. The DCFS<br />
list of licensed <strong>child</strong> <strong>care</strong> centers and<br />
homes is the best source of licensed<br />
programs, but conta<strong>in</strong>s no <strong>in</strong><strong>for</strong>mation<br />
on programs without licenses.<br />
These three sources complement<br />
each other well. Even together, however,<br />
they do not <strong>for</strong>m a complete<br />
list<strong>in</strong>g of <strong>child</strong> <strong>care</strong> <strong>in</strong> Cook County.<br />
They do not fully capture the <strong>child</strong><br />
<strong>care</strong> activity <strong>in</strong> Cook County that is<br />
legally exempt from licens<strong>in</strong>g or the<br />
otherwise illegal <strong>care</strong>.<br />
Table A3 provides the source of data<br />
<strong>for</strong> each type of provider as well as<br />
some basic notes on who is <strong>in</strong>cluded<br />
<strong>in</strong> each type. The table covers the<br />
four ma<strong>in</strong> types of <strong>child</strong> <strong>care</strong>: home<br />
and center providers that are either<br />
licensed or license-exempt.<br />
Table A3. Child Care Providers <strong>in</strong> Cook County <strong>in</strong> 2006 Best Sources by Type (All data from June 2006)<br />
Type of Program Source* Notes<br />
Licensed Centers Department of <strong>Children</strong> Includes any center listed with DCFS with a license status<br />
and Family Services<br />
of 1, 2 12 or 14. Preschool, Head Start and be<strong>for</strong>e- and after-school<br />
programs are <strong>in</strong>cluded if they are licensed. Centers with permits<br />
are not <strong>in</strong>cluded.<br />
License-Exempt Centers Ill<strong>in</strong>ois <strong>Action</strong> <strong>for</strong> <strong>Children</strong> License-exempt center counts do not <strong>in</strong>clude summer camp—<br />
Resource and Referral only programs. License-exempt preschools, Head Start and<br />
preK programs, be<strong>for</strong>e- and after-school programs and park<br />
and recreation programs are <strong>in</strong>cluded if they are listed with<br />
Ill<strong>in</strong>ois <strong>Action</strong> <strong>for</strong> <strong>Children</strong>.<br />
Licensed Homes Department of <strong>Children</strong> Includes homes licensed by DCFS with a license status of<br />
and Family Services 1, 2, 12 or 14.<br />
License-Exempt Homes Ill<strong>in</strong>ois Child Care Includes license-exempt home providers participat<strong>in</strong>g <strong>in</strong> the<br />
Assistance Program<br />
Assistance program as of June 2006. Note that the number<br />
of participat<strong>in</strong>g home providers varies from month to month<br />
just as the number of participat<strong>in</strong>g families varies.<br />
39
Glossary of Terms<br />
Chicago Community Areas (CCA).<br />
Seventy-seven <strong>for</strong>mal designations<br />
of Chicago neighborhoods. See<br />
Appendix 1.<br />
Child Care Resource and Referral<br />
Agency (CCR&R). There are 16 agencies<br />
throughout Ill<strong>in</strong>ois whose goal is to<br />
work with parents, bus<strong>in</strong>ess leaders,<br />
government officials and <strong>child</strong> <strong>care</strong><br />
providers to make high quality <strong>child</strong> <strong>care</strong><br />
available to Ill<strong>in</strong>ois families. This <strong>in</strong>cludes<br />
support<strong>in</strong>g <strong>child</strong> <strong>care</strong> providers, prepar<strong>in</strong>g<br />
<strong>in</strong>dividuals to enter the <strong>child</strong> <strong>care</strong><br />
field, and assist<strong>in</strong>g families <strong>in</strong> locat<strong>in</strong>g<br />
<strong>child</strong> <strong>care</strong> and access<strong>in</strong>g the Ill<strong>in</strong>ois<br />
Child Care Assistance Program. Ill<strong>in</strong>ois<br />
<strong>Action</strong> <strong>for</strong> <strong>Children</strong> is a CCR&R.<br />
Family Child Care Homes (FCC).<br />
Child <strong>care</strong> located <strong>in</strong> providers’ homes.<br />
While there are over 20,000 known<br />
license-exempt <strong>child</strong> <strong>care</strong> homes <strong>in</strong><br />
Cook County, sometimes the term FCC<br />
refers solely to the approximately 4,000<br />
licensed <strong>child</strong> <strong>care</strong> homes. In this<br />
report, it refers to both types of <strong>child</strong><br />
<strong>care</strong> homes.<br />
Ill<strong>in</strong>ois Child Care Assistance<br />
Program (ICCAP). Program<br />
established us<strong>in</strong>g the federal Child Care<br />
Block Grant follow<strong>in</strong>g welfare re<strong>for</strong>m to<br />
provide <strong>child</strong> <strong>care</strong> assistance <strong>for</strong> work<strong>in</strong>g<br />
families earn<strong>in</strong>g less than 50 percent<br />
of the state median <strong>in</strong>come.<br />
Ill<strong>in</strong>ois Department of <strong>Children</strong> and<br />
Family Services (DCFS). In this<br />
report: DCFS grants and en<strong>for</strong>ces<br />
licens<strong>in</strong>g of <strong>child</strong> <strong>care</strong> centers and<br />
homes. It also helps pay <strong>for</strong> <strong>child</strong> <strong>care</strong><br />
<strong>for</strong> foster <strong>child</strong>ren.<br />
Ill<strong>in</strong>ois Department of Human<br />
Services (IDHS). Home of the Bureau<br />
of Child Care and Development which<br />
adm<strong>in</strong>isters many of the State’s <strong>child</strong><br />
<strong>care</strong> programs, <strong>in</strong>clud<strong>in</strong>g the Ill<strong>in</strong>ois Child<br />
Care Assistance Program, Child Care<br />
Resource and Referral Agencies and<br />
the Quality Counts program.<br />
Ill<strong>in</strong>ois Network of Child Care<br />
Resource and Referral Agencies<br />
(INCCRRA). A member organization<br />
consist<strong>in</strong>g of 16 regional Child Care<br />
Resource & Referral (CCR&R) agencies<br />
serv<strong>in</strong>g communities throughout the<br />
state of Ill<strong>in</strong>ois. Its goal is to make high<br />
quality and af<strong>for</strong>dable early <strong>care</strong> and<br />
education opportunities available <strong>for</strong><br />
families and <strong>child</strong>ren of Ill<strong>in</strong>ois.<br />
Income-eligible. A family whose<br />
<strong>in</strong>come falls under 50 percent of the<br />
state median <strong>in</strong>come, mak<strong>in</strong>g it <strong>in</strong>comeeligible<br />
<strong>for</strong> the Ill<strong>in</strong>ois Child Care<br />
Assistance Program. Income eligibility <strong>in</strong><br />
Ill<strong>in</strong>ois depends upon family size.<br />
Licensed Child Care Centers.<br />
Centers that have been certified by the<br />
Ill<strong>in</strong>ois Department of <strong>Children</strong> and<br />
Family Services as meet<strong>in</strong>g certa<strong>in</strong><br />
health and safety standards and that<br />
are subject to <strong>in</strong>spection by DCFS.<br />
Licensed Child Care Homes. Homes<br />
that have been certified by the Ill<strong>in</strong>ois<br />
Department of <strong>Children</strong> and Family<br />
Services as meet<strong>in</strong>g certa<strong>in</strong> health and<br />
safety standards and that are subject to<br />
<strong>in</strong>spection by DCFS.<br />
License-exempt Child Care<br />
Centers. The Child Care Act of 1969<br />
excludes some facilities from the<br />
requirement to be licensed. These<br />
exclusions from the licens<strong>in</strong>g requirement<br />
may be found <strong>in</strong> Section 2.09 of<br />
the Child Care Act of 1969 [225 ILCS<br />
10/2.09] and are expla<strong>in</strong>ed <strong>in</strong> Department<br />
rules 89 Ill. Adm. Code 377,<br />
Facilities and Programs Exempt from<br />
Licensure. Centers that are legally<br />
exempt from licens<strong>in</strong>g <strong>in</strong>clude those run<br />
by a religious <strong>in</strong>stitution, government<br />
program, school, college or university.<br />
License-exempt Child Care Homes.<br />
Sometimes called “family, friend and<br />
neighbor <strong>child</strong> <strong>care</strong>” or “kith and k<strong>in</strong><br />
<strong>child</strong> <strong>care</strong>.” Child <strong>care</strong> <strong>in</strong> a home that is<br />
legally exempt from licensure because<br />
the provider <strong>care</strong>s <strong>for</strong> fewer than four<br />
unrelated <strong>child</strong>ren. In the Ill<strong>in</strong>ois Child<br />
Care Assistance Program, the provider<br />
receiv<strong>in</strong>g a payment must complete a<br />
registration process and have passed a<br />
background check.<br />
Non-Traditional Hours of Care.<br />
Hours of <strong>child</strong> <strong>care</strong> that fall outside the<br />
typical Monday through Friday day time<br />
schedule (def<strong>in</strong>ed <strong>in</strong> this report as 5 am<br />
to 7 pm). This <strong>in</strong>cludes even<strong>in</strong>g, overnight<br />
and weekend <strong>care</strong>, as well as days and<br />
times that change from one week to the<br />
next.<br />
Reimbursement Rates. The payment<br />
levels approved <strong>for</strong> centers, licensed<br />
homes and license-exempt homes under<br />
the Ill<strong>in</strong>ois Child Care Assistance<br />
Program. These rates vary across<br />
regions of Ill<strong>in</strong>ois. Parents pay part of the<br />
rate to providers as parent co-payments,<br />
while the Ill<strong>in</strong>ois Child Care Assistance<br />
Program pays the rema<strong>in</strong>der.<br />
State Median Income. The <strong>in</strong>come at<br />
which half of the families <strong>in</strong> Ill<strong>in</strong>ois earn<br />
more and half earn less. The Ill<strong>in</strong>ois<br />
Child Care Assistance Program determ<strong>in</strong>es<br />
a family’s eligibility us<strong>in</strong>g a different<br />
state median <strong>in</strong>come <strong>for</strong> different<br />
family sizes.<br />
Special Needs Child Care. Refers to<br />
a <strong>child</strong> <strong>care</strong> provider with experience or<br />
tra<strong>in</strong><strong>in</strong>g <strong>in</strong> car<strong>in</strong>g <strong>for</strong> a <strong>child</strong> with an<br />
emotional, physical, developmental or<br />
special health need or disability.<br />
40
www.act<strong>for</strong><strong>child</strong>ren.org<br />
ill<strong>in</strong>ois action <strong>for</strong> <strong>child</strong>ren<br />
4753 north broadway<br />
chicago, ill<strong>in</strong>ois 60605<br />
312.823.1100