Research Questions and Hypotheses
Research Questions and Hypotheses
Research Questions and Hypotheses

You also want an ePaper? Increase the reach of your titles
YUMPU automatically turns print PDFs into web optimized ePapers that Google loves.
150 Designing <strong>Research</strong> Quantitative Methods 151<br />
<strong>and</strong> test—retest correlations (are scores stable over time when the instrument<br />
is administered a second time?). Also determine whether there was consistency<br />
in test administration <strong>and</strong> scoring (were errors caused by carelessness<br />
in administration or scoring?; Borg, Gall, & Gall, 1993).<br />
When one modifies an instrument or combines instruments in a<br />
study, the original validity <strong>and</strong> reliability may not hold for the new instrument,<br />
<strong>and</strong> it becomes important to reestablish validity <strong>and</strong> reliability during<br />
data analysis.<br />
Include sample items from the instrument so that readers can see the<br />
actual items used. In an appendix to the proposal, attach sample items or<br />
the entire instrument.<br />
Indicate the major content sections in the instrument, such as the<br />
cover letter (Dillman, 1978, provides a useful list of items to include in<br />
cover letters), the items (e.g., demographics, attitudinal items, behavioral<br />
items, factual items), .<strong>and</strong> the closing instructions. Also mention the type<br />
of scales used to measure the items on the instrument, such as continuous<br />
scales (e.g., strongly agree to strongly disagree) <strong>and</strong> categorical scales (e.g.,<br />
yes/no, rank from highest to lowest importance).<br />
Discuss plans for pilot testing or field testing the survey <strong>and</strong> provide<br />
a rationale for these plans. This testing is important to establish the content<br />
validity of an instrument <strong>and</strong> to improve questions, format, <strong>and</strong><br />
scales. Indicate the number of people who will test the instrument <strong>and</strong> the<br />
plans to incorporate their comments into final instrument revisions.<br />
For a mailed survey, identify steps for administering the survey <strong>and</strong><br />
for following up to ensure a high response rate. Salant <strong>and</strong> Dillman (1994)<br />
suggest a four-phase administration process. The first mail-out is a short<br />
advance-notice letter to all members, of the sample, <strong>and</strong> the second mailout<br />
is the actual mail survey, distributed about 1 week after the advancenotice<br />
letter. The third mail-out consists of a postcard follow-up sent to all<br />
members of the sample 4 to 8 days after the initial questionnaire. The<br />
fourth mail-out, sent to all nonrespondents, consists of a personalized cover<br />
letter with a h<strong>and</strong>written signature, the questionnaire, <strong>and</strong> a preaddressed<br />
return envelope with postage. <strong>Research</strong>ers send this fourth mail-out 3 weeks<br />
after the second mail-out. Thus, in total, the researcher concludes the administration<br />
period 4 weeks after its start, providing the returns meet project<br />
objectives.<br />
Variables in the Study<br />
Although readers of a proposal learn about the variables in purpose statements<br />
<strong>and</strong> research questions/hypotheses sections, it is useful in the method<br />
section to relate the variables to the specific questions or hypotheses on the<br />
instrument. One technique is to relate the variables, the research questions<br />
or hypotheses, <strong>and</strong> items on the survey instrument so that a reader can easily<br />
determine how the researcher will use the questionnaire items. Plan to<br />
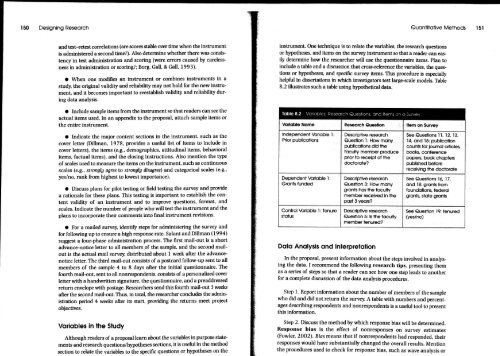
include a table <strong>and</strong> a discussion that cross-reference the variables, the questions<br />
or hypotheses, <strong>and</strong> specific survey items. This procedure is especially<br />
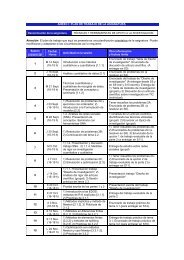
helpful in dissertations in which investigators test large-scale models. Table<br />
8.2 illustrates such a table using hypothetical data.<br />
Table 8.2 Variables, <strong>Research</strong> <strong>Questions</strong>, <strong>and</strong> Ilems on a Survey<br />
Variable Name<br />
Independent Variable :<br />
Prior publications<br />
Dependent Variable :<br />
Grants funded<br />
Control Variable 1: Tenure<br />
status<br />
<strong>Research</strong> Question<br />
Descriptive research<br />
Question 1: How many<br />
publiccrtions did the<br />
faculty member produce<br />
prior to receipt of the<br />
doctorate?<br />
Descriptive research<br />
Question 3: How many<br />
grants has the faculty<br />
member received in the<br />
past 3 years?<br />
Descriptive research<br />
Question 5: Is the faculty<br />
member tenured?<br />
Data Analysis <strong>and</strong> Interpretation<br />
!tem on Survey<br />
See <strong>Questions</strong> 11, 12, 13,<br />
14, <strong>and</strong> 15: publication<br />
counts for journal adietes,<br />
books, conference<br />
papers, book chapters<br />
published before<br />
receiving the doctorate<br />
See <strong>Questions</strong> 16, 17,<br />
<strong>and</strong> 18: grants from<br />
foundations, federal<br />
grants, state grants<br />
See Question 19: tenured<br />
(yes/no)<br />
In the proposal, present information about the steps involved in analyzing<br />
the data. I recommend the following research tips, presenting them<br />
as a series of steps so that a reader can see how one step leads to another<br />
for a complete discussion of the data analysis procedures.<br />
Step 1. Report information about the number of members of the sample<br />
who did <strong>and</strong> did not return the survey. A table with numbers <strong>and</strong> percentages<br />
describing respondents <strong>and</strong> nonrespondents is a useful tool to present<br />
this information.<br />
Step 2. Discuss the method by which response bias will be determined.<br />
Response bias is the effect of nonresponses on survey estimates<br />
(Fowler, 2002). Bias means that if nonrespondents had responded, their<br />
responses would have substantially changed the overall results. Mention<br />
the procedures used to check for response bias, such as wave analysis or