Research Questions and Hypotheses
Research Questions and Hypotheses
Research Questions and Hypotheses

You also want an ePaper? Increase the reach of your titles
YUMPU automatically turns print PDFs into web optimized ePapers that Google loves.
152 Designing <strong>Research</strong> Quantitative Methods 153<br />
a respondent/nonrespondent analysis. In wave analysis, the researcher<br />
examines returns on select items week by week to determine if average<br />
responses change (Leslie, 1972). Based on the assumption that those<br />
who return surveys in the final weeks of the response period are nearly<br />
all nonrespondents, if the responses begin to change, a potential exists<br />
for response bias. An alternative check for response bias is to contact a few<br />
nonrespondents by phone <strong>and</strong> determine if their responses differ substantially<br />
from respondents. This constitutes a respondent-nonrespondent<br />
check for response bias.<br />
Step 3. Discuss a plan to provide a descriptive analysis of data for all<br />
independent <strong>and</strong> dependent variables in the study. This analysis should indicate<br />
the means, st<strong>and</strong>ard deviations, <strong>and</strong> range of scores for these variables.<br />
Step 4. If the proposal contains an instrument with scales or a plan to<br />
develop scales (combining items into scales), identify the statistical procedure<br />
(i.e., factor analysis) for accomplishing this. Also mention reliability<br />
checks for the internal consistency of the scales (i.e., the Cronbach<br />
alpha statistic).<br />
Step 5. Identify the statistics <strong>and</strong> the statistical computer program for<br />
testing the major inferential research questions or hypotheses in the proposed<br />
study. The inferential questions or hypotheses relate variables<br />
or compare groups in terms of variables so that inferences can be drawn<br />
from the sample to a population. Provide a rationale for the choice of statistical<br />
test <strong>and</strong> mention the assumptions associated with the statistic.<br />
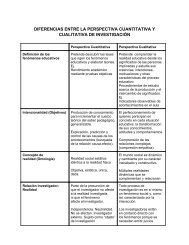
As shown in Table 8.3, base-thi~ice on-the-rrature-of-the-research<br />
question (e.g., relating variables or comparing groups as the most popular),<br />
the number of independent <strong>and</strong> dependent variables, <strong>and</strong> the number<br />
of variables controlled (e.g., see Rudestam & Newton, 2007).<br />
Further, consider whether the variables will be measured on an instrument<br />
as a continuous score (e.g., age, from 18 to 36) or as a categorical<br />
score (e.g., women = 1, men = 2). Finally, consider whether the scores<br />
from the sample might be normally distributed in a bell-shaped curve if<br />
plotted out on a graph or non-normally distributed. There are additional<br />
ways to determine if the scores are normally distributed (see Creswell,<br />
2008). These factors, in combination, enable a researcher to determine<br />
what statistical test will be suited for answering the research question or<br />
hypothesis. In Table 8.3, I show how the factors, in combination, lead to<br />
the selection of a number of common statistical tests. For further types<br />
of statistical tests, readers are referred to statistics methods books, such<br />
as Gravetter <strong>and</strong> Wallnau (2000).<br />
Step 6. A final step in the data analysis is to present the results in tables<br />
or figures <strong>and</strong> interpret the results from the statistical test. An interpretation<br />
of the results means that the researcher draws conclusions from<br />
the results for the research questions, hypotheses, <strong>and</strong> the larger meaning<br />
,-.1* Thic intprnretation involves several stens.<br />
Tab!e 6.3 Criterio for Choosing Select Stotistica! Tests<br />
Nature of<br />
Question<br />
Group<br />
comparison<br />
Group 1 or more<br />
comparison<br />
Group<br />
comparison<br />
Group<br />
comparison<br />
Association<br />
between<br />
groups<br />
Relate<br />
variables<br />
Relate<br />
variables<br />
Relate<br />
variables<br />
Number of<br />
hdependerd<br />
Variables<br />
or more<br />
2 or more 1<br />
Number of Type of Score<br />
Number of Control Independenti<br />
Dependent Variables Dependent Distribution<br />
Variables (covariates) Variables of Scores<br />
or more<br />
o<br />
categorical<br />
Report whether the results of the statistical test were statistically<br />
significant or not, such as "the analysis of variance revealed a statistically<br />
significant difference between men <strong>and</strong> women in terms of attitudes<br />
toward banning smoking in restaurants F (2; 6) = 8.55, p = .001."<br />
Report how these results answered the research question or hypothesis.<br />
Did the results support the hypothesis or did they contradict what<br />
was expected?<br />
Indicate what might explain why the results occurred. This explanation<br />
might refer back to the theory advanced in the proposed study (see<br />
Chapter 3), past literature as reviewed in the literature review (see<br />
Chapter 2), or logical reasoning.<br />
Discuss the implications of the results for practice or for future<br />
research on the topic.<br />
o<br />
o<br />
Contlnuous/ Normal<br />
continuous<br />
Statistical<br />
Test<br />
t-test<br />
Analysis of<br />
variance<br />
Analysis of<br />
covariance<br />
Mann-<br />
Whitney<br />
U test<br />
Chi-square<br />
Pearson<br />
product<br />
moment<br />
correlation<br />
Multiple<br />
regression<br />
'IV' IP Vi<br />
rank-orcier<br />
correlation