STRENGTHENING A BRIDGE DECK WITH HIGH ... - CONTEC ApS
STRENGTHENING A BRIDGE DECK WITH HIGH ... - CONTEC ApS
STRENGTHENING A BRIDGE DECK WITH HIGH ... - CONTEC ApS

You also want an ePaper? Increase the reach of your titles
YUMPU automatically turns print PDFs into web optimized ePapers that Google loves.
Downloaded from:http//:www.ferroplan.com<br />
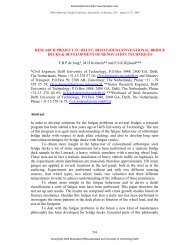
2004 Orthotropic Bridge Conference, Sacramento, California, USA – August 25-27, 2004<br />
<strong>STRENGTHENING</strong> A <strong>BRIDGE</strong> <strong>DECK</strong> <strong>WITH</strong><br />
<strong>HIGH</strong> PERFORMANCE CONCRETE<br />
F.B.P. de Jong* and M.H.Kolstein**<br />
*Civil Engineer, Delft University of Technology, P.O.Box 5048, 2600 GA, Delft,<br />
The Netherlands; Phone +31-15 278 57 16; f.b.p.dejong@citg.tudelft.nl and Ministry<br />
of Transport, P.O.Box 59, 2700 AB, Zoetermeer, The Netherlands; Phone +31 – 79<br />
329 25 19 f.b.p.dejong@bwd.rws.minvenw.nl **Senior Research Engineer, Delft<br />
University of Technology, P.O.Box 5048, 2600 GA, Delft, The Netherlands; Phone<br />
+31-15 278 40 05; m.h.kolstein@citg.tudelft.nl<br />
Abstract<br />
Renovation techniques have been developed both for movable and fixed bridges. A<br />
very effective solution for fixed bridges is the replacement of the mastic asphalt<br />
wearing course, which is 50 mm thick on the majority of the bridges in the<br />
Netherlands, by a layer of 50 mm reinforced high performance concrete. The paper<br />
describes the development of this renovation technique. Attention will be paid to the<br />
FEM calculations and the laboratory static and fatigue tests.<br />
After completion of the development stage this renovation has been applied<br />
on a part the Caland bridge in the harbour area of Rotterdam. The paper describes this<br />
innovative renovation project. In five days in may 2003 the old asphaltic surfacing<br />
has been removed, the fatigue cracks in the steel deck plate have been repaired and<br />
the new surfacing of high performance concrete has been applied.<br />
Stress spectra measurements have been performed on the Caland bridge, both<br />
before and after the application of the concrete surfacing in order to check if the<br />
prediction models based on the FEM simulations and the laboratory test are correct.<br />
In total 18 strain gauges have been applied at different locations at the bridge deck.<br />
The location of the strain gauges is explained in the paper.<br />
The results of these stress spectra measurements are reported in this paper.<br />
The reduction of the local bending stresses in the deck plate due to the replacement of<br />
asphalt with concrete is approximately 70-80 %, which is in accordance with the<br />
expectations.<br />
This stress reduction leads to a significant lifetime enhancement of the deck<br />
plate structure. The papers ends with an interpretation of the measured stress<br />
reductions in relation to the lifetime enhancement of the bridge deck, for two types of<br />
fatigue cracks.<br />
328<br />
©Copyright 2004 Bouwdienst Rijkswaterstaat and University of Technology Delft
Downloaded from:http//:www.ferroplan.com<br />
2004 Orthotropic Bridge Conference, Sacramento, California, USA – August 25-27, 2004<br />
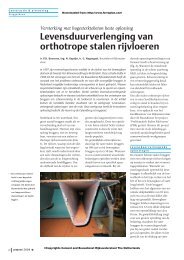
RHPC as renovation technique<br />
Fatigue phenomena are one of the greatest threats for orthotropic steel bridge decks.<br />
Especially on bridges in the Netherlands a lot of cracks have been detected the last<br />
decade. Fatigue cracks that possibly threaten the traffic safety, are cracks in the deck<br />
plate. See figure 1 for this crack type. Research has shown that these cracks arise<br />
under the enormous amount of lorries nowadays on the highways and its heavy axle<br />
loads. (De Jong, 2003, 2004-a)<br />
The heavy axle loads of trucks generate high bending stresses in the deck<br />
plate in transversal direction. These stresses cause fatigue crack growth. For a<br />
detailed description of various crack types in orthotropic bridge decks see (De Jong,<br />
2004-b). There are basically two options to stop or at least to lower the crack growth<br />
rate in existing bridge decks. The first is to lower the axle loads by legislation. The<br />
other is to lower the stress cycles. As lowering axle loads as impossible to achieve,<br />
the stress cycles have to be reduced.<br />
To reduce the stress cycles in the deck plate the stiffness of the deck plate<br />
structure must be enlarged. A developed renovation technique for fixed bridges is a<br />
surfacing of high performance concrete. Fixed bridges in the Netherlands have a<br />
wearing course of approximately 50 mm mastic asphalt, with a low stiffness. It is<br />
possible to replace this with a wearing course with a higher stiffness. Reinforced<br />
High Performance Concrete (RHPC) is a material with this higher stiffness. A<br />
wearing course of reinforced high performance concrete with the same thickness as<br />
the mastic asphalt layer is a good solution to lower the stress cycles. If also a good<br />
intermediate layer between steel and concrete is possible, composite action between<br />
steel and concrete is possible. In that case the total stiffness of the composite deck<br />
plate structure might be enlarged with factors. Then the stress cycles in the steel deck<br />
plate are strongly reduced and subsequently the fatigue life is far better.<br />
The development of the RHPC wearing course started after the fatigue<br />
problems with the Van Brienenoord bridge (Kolstein, 1998). The development is a<br />
cooperation between Contec <strong>ApS</strong> and the civil engineering division of the Dutch<br />
ministry of Transport, Public Works and Water Management. Also several other<br />
partners were involved. The development of this overlay is described extensively by<br />
(Buitelaar, 2004). In figure 2 this surfacing system is visible.<br />
Application phases<br />
Applying an RHPC wearing course on an existing bridge deck with a mastic asphalt<br />
wearing course is divided in several phases. The description of these phases is the<br />
result of several tests. The phases are:<br />
1. Removing the existing mastic asphalt wearing course<br />
2. Visual and ultrasonic inspection of the deck plate structure to find all the cracks in<br />
the deck plate<br />
3. Repair of detected cracks if they are bigger than the repair criterion, for example<br />
by submerged arc welding of the deck plate crack<br />
4. Shot blasting the surface of the steel deck plate to Sa 2.5 to achieve a perfect<br />
bonding between epoxy layer and steel deck plate.<br />
329<br />
©Copyright 2004 Bouwdienst Rijkswaterstaat and University of Technology Delft
Downloaded from:http//:www.ferroplan.com<br />
2004 Orthotropic Bridge Conference, Sacramento, California, USA – August 25-27, 2004<br />
5. Applying an two-component epoxy based surfacing sprinkled in with calcinated<br />
bauxite aggregate (3-6 mm)<br />
6. After hardening of the intermediate epoxy layer, removing the unbonded bauxite<br />
granules, because unbonded granules are weak points in the adhesion between<br />
concrete and epoxy.<br />
7. Apply reinforcement in 3 layers φ8 mm spaced at 50 mm. The direction of the<br />
reinforcement bars in the bottom layer is transversal, the direction of the middle<br />
layer is longitudinal and the direction of the top layer is transversal.<br />
8. Casting the concrete HPC strength class C110, reinforced with steel fibers and<br />
acrylic fibers.<br />
9. Compacting, power floating and curing the surface in order to create a very dense<br />
surface.<br />
10. Shot blasting the surface in order to create skid resistance for the traffic<br />
Testing and development program<br />
Before application on a bridge deck in a highway, this RHPC wearing course system<br />
is subjected to several tests and calculations. The objective of this program was to<br />
develop a system appropriate for application on a highway bridge. Only aspects,<br />
which are difficult to research by calculations and laboratory research, are left for the<br />
first application on a highway bridge.<br />
Bonding layer between steel and concrete. Adhesion tests on small test specimens<br />
have been performed to optimize the epoxy-bonding layer between concrete and<br />
steel. Four types of this interface have been tested. (Buitelaar, 2004):<br />
• Prefab panels glued in-situ on the steel deck using a two-component epoxy paste<br />
adhesive<br />
• Casting the mortar on a wet two-component epoxy paste adhesive<br />
• Casting the mortar on a hardened two-component epoxy paste adhesive sprinkled<br />
in with granite using both reinforced and no-reinforced samples.<br />
Static and fatigue tests turned out that casting the mortar on a hardened epoxy layer<br />
with application of reinforcement bars was the best solution for the interface layer.<br />
Large application tests on a total area of 80 m2. After the first laboratory tests the<br />
RHPC wearing course has been applied on a part of the old and removed bascule<br />
bridge Van Brienenoord. The bascule bridge was renewed in 1998 after detection of<br />
cracks in 1997. The old part is kept for research objectives. An important conclusion<br />
from these tests is that the vibration screed should add sufficient energy to the<br />
concrete in order to ensure a good compaction of the concrete in the interface<br />
between the epoxy layer and the concrete. Without a good compaction in this<br />
interface composite action is not guaranteed. After hardening of these test areas the<br />
concrete layer is shot blasted. Measurements of the skid resistance showed that this is<br />
enough to obtain the required skid resistance for traffic.<br />
Technological and durability tests. Several test have been performed on<br />
technological and durability aspects of the concrete mixture. Aspects which have<br />
330<br />
©Copyright 2004 Bouwdienst Rijkswaterstaat and University of Technology Delft
Downloaded from:http//:www.ferroplan.com<br />
2004 Orthotropic Bridge Conference, Sacramento, California, USA – August 25-27, 2004<br />
been researched are: compressive strength, modulus of elasticity, flexural strength,<br />
short term shrinkage and creep, long term shrinkage and creep, effect of curing and<br />
power floating, frost/thaw resistance, chloride penetration. A description of these<br />
tests is not in the scope of this paper. For further details see (Buitelaar, 2004)<br />
FEM calculations and tests. Several FEM calculations have been made in order to<br />
calculate the peak stress in the steel deck at the location of the deck plate crack. FEmodels<br />
have been made without surfacing, with a mastic surfacing and with a RHPC<br />
surfacing. Besides these models also a model with glued steel plates and a model with<br />
troughs filled with polyurethane have been made. The last two models are for<br />
renovations techniques for movable bridges. The used FEM model is given in figure<br />
3. A wheel load is placed on top of the deck plate centered above the trough profile at<br />
the location of the crossbeam. The calculated reduction of the peak stress at the<br />
location of the crack with a RHPC layer is 4 to 5 compared to a wearing course of<br />
mastic asphalt. (Pover, 2002)<br />
Besides the FEM calculations and the lab tests on small specimens also a test<br />
on a full-scale test specimen has been performed. One of the sections of the old<br />
bascule bridge Van Brienenoord, on which an application test has been performed in<br />
an earlier stage, is subjected to static and fatigue tests. The results of the static tests<br />
on this panel are in accordance with the results of the FEM calculations. After the<br />
static test a fatigue test has been performed. The wheel load (270 * 320 mm, width<br />
*length) is again centered above the trough at the location of the crossbeam. Figure 4<br />
gives a photo of the fatigue test. In total 8.4e6 load cycles have been applied. The<br />
first 4.2e6 with a load range of 105 kN, then 1.4e6 with a range of 137 kN, then 1.4e6<br />
with a range of 168 kN and finally 1.4e6 cycles at a range of 210 kN. Calculations<br />
have shown that this load set up equals 75 years of heavy vehicle traffic on the<br />
Moerdijk bridge, which is the most heavy loaded bridge deck in the Netherlands.<br />
After the fatigue test an ultrasonic inspection has been performed without detecting<br />
any crack in the steel deck plate. The conclusion is that the replacement of the asphalt<br />
surfacing by a RHPC surfacing is a promising solution with respect to the fatigue life<br />
of orthotropic steel bridge decks.<br />
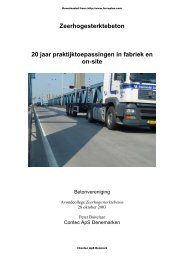
Pilot Project Caland bridge<br />
After the successful full-scale fatigue test the next step in the development of the<br />
RHPC surfacing was application in a real highway bridge. The selected bridge for the<br />
first application was the Caland bridge, a bridge in the harbor area in Rotterdam. This<br />
bridge is one of the bridges with severe fatigue problems and also replacement of the<br />
asphalt surfacing was desirable. This bridge has two fixed spans and a movable part,<br />
see figure 5. One direction of the shortest fixed span (86m) is renovated with a RHPC<br />
surfacing. This direction has two lanes. The area of the RHPC surfacing is<br />
approximately 650 m2, 7.6 m wide by 86 m long. This renovation is done from 29<br />
April 2003 to 4 May 2003.<br />
The phases of this renovation project are described in this paper. In figures 6<br />
to 20 a brief outline of this project is given. At first the mastic asphalt layer is<br />
removed (figure 6 and 7). After the removal of the asphalt a covering is placed over<br />
331<br />
©Copyright 2004 Bouwdienst Rijkswaterstaat and University of Technology Delft
Downloaded from:http//:www.ferroplan.com<br />
2004 Orthotropic Bridge Conference, Sacramento, California, USA – August 25-27, 2004<br />
the whole working area (figure 8) to ensure that rainfall doesn't cause delay or a<br />
worse quality of the concrete surfacing. Subsequently the ultrasonic TOFD inspection<br />
is performed (figure 9). This is a very accurate technique, small cracks with a height<br />
of approximately 2 or 3 mm are found by this technique. The cracks, which are<br />
found, are identified on the top of the steel deck plate (figure 10). Some of these<br />
cracks had to be repaired. These cracks are repaired with the submerged arc welding<br />
procedure (figure 11 and 12). After the repair the new weld is magnetic tested (figure<br />
13). After these repairs the steel deck plate is shot blasted to Sa 2.5 (figure 14) and<br />
immediately the two-component epoxy is applied and sprinkled in with bauxite<br />
(figure 15.) After the hardening of the epoxy layer the unbonded bauxite granules are<br />
removed and the reinforcement is placed (figure 16 and 17). Then the concrete is<br />
casted on the bridge deck and compacted with a vibration screed (figure 18). The<br />
thickness of the concrete layer is 60 mm. T-profiles of 60 mm high at the edges of the<br />
concrete layer are the supports for the screed. With power floating (figure 19) the<br />
surface is made denser in order to prevent for shrinkage cracks in the concrete. The<br />
concrete is shot blasted for skid resistance, the covering is removed and then the<br />
bridge is opened for traffic. The concrete layer is kept wet for one week after opening<br />
for traffic. This was also to minimize the shrinkage (figure 20).<br />
Stress spectra measurements<br />
Objective. Due to the replacement of the asphalt layer by a layer of RHPC the stresses<br />
in the steel deck plate reduce. This reduction is calculated with FEM models and<br />
verified with static measurements on full-scale laboratory tests. To verify these<br />
results stress spectra measurements heave been performed on the Caland bridge.<br />
These measurements are extensively described in (Kolstein, 2003). The stress spectra<br />
have been measured under a conventional mastic asphalt wearing course and under<br />
the RHPC surfacing. Evaluation of the measurements gives a reduction due to the<br />
applied RHPC surfacing.<br />
Instrumentation. In September 2002 strain gauges have been applied at the underside<br />
of the bridge deck structure at the right wheel track of the heavy vehicle lane. The<br />
span of the fixed span is 86 m and the strain gauges have been applied at<br />
approximately 74 to 76 m in traffic direction. Approximately 10 m before lorries are<br />
leaving the bridge. At this location dynamic amplification is limited. A general view<br />
of the measured cross sections is shown in figure 21. At 9 locations a pair of 2 strain<br />
gauges have been attached. These strain gauges are positioned 15 mm from the weld<br />
toe and they are all positioned perpendicular to the longitudinal weld between trough<br />
web and deck plate. This means that the gauges all measure the transversal strain,<br />
figure 22. As shown in figure 23 the strain gauges near the crossbeam are located 20<br />
mm from the crossbeam web. The numbering of the strain gauges is shown in figure<br />
24, 25 and 26. The location of the strain gauges is chosen so that the stress reduction<br />
both for deck plate cracks as well as for cracks in the longitudinal weld between deck<br />
plate and trough web is measured. Besides the strain gauges two temperature sensors<br />
have been applied. One is connected at the bottom side of the steel deck plate and one<br />
is hanging in the free air.<br />
332<br />
©Copyright 2004 Bouwdienst Rijkswaterstaat and University of Technology Delft
Downloaded from:http//:www.ferroplan.com<br />
2004 Orthotropic Bridge Conference, Sacramento, California, USA – August 25-27, 2004<br />
Maximum stress spectra. The induced stress variations at the strain gauge locations<br />
have been measured under normal traffic conditions. Two periods of measurements<br />
have been carried out.<br />
• Week 10-17: Steel deck plate with a conventional mastic asphalt surfacing, before<br />
application RHPC surfacing<br />
• Week 19-31: Steel deck plate with a RHPC surfacing<br />
Each axle of a heavy vehicle that passes the bridge generates a strain signal. Only the<br />
maximum strain is saved. From the measurements only the weeks 14-17 and 19-23<br />
have been analyzed. In week 18 the Caland bridge is renovated.<br />
The results of the measurements are given for the strain gauges at location B.<br />
Because the results at this location mid span between two crossbeams are less<br />
influenced by second order effects. Second order effects influence the results of the<br />
strain gauges at locations A and C. These effects are due to the extra stiffness of the<br />
crossbeam web. This was inevitable because it was impossible to attach the strain<br />
gauges at bottom side of the deck plate at the inner side of the trough profile.<br />
The results are given in frequency curves. These curves give the cumulative<br />
number of stress cycles with a range larger than the given stress range. The results for<br />
the strain gauges at location B are given in figures 27, 28 and 29 for the strain gauges<br />
7, 9 and 11 at the bottom side of the deck plate and in figures 30, 31 and 32 for the<br />
strain gauges at the trough web.<br />
Stress reduction. A strong reduction of the stresses is visible from the figures. Only<br />
at the tails of the curves, a smaller or even no reduction is visible. This is due to the<br />
effect that a passing vehicle not only generates local stresses in deck plate and trough<br />
web, but also more global stresses, e.g. due to the crossbeam behavior. As the<br />
reduction of the local stresses due to RHPC is the main concern the tails of the<br />
frequency curves are neglected in the analysis.<br />
To derive an indication of the stress reduction due the RHPC surfacing the<br />
cumulative numbers of cycles for RHPC are multiplied with a factor 0.8, because the<br />
curves in the figure 27 to 32 comprise data for 4 weeks of mastic asphalt and 5 weeks<br />
of RHPC. Then the stress range from the frequency curve is determined for the<br />
cumulative numbers of 100, 1000, 10000 and 100000 cycles. For mastic asphalt these<br />
values are given in table 1, for RHPC these values are given in table 2. The stress<br />
reduction factor is defined as the stress for mastic asphalt divided by the stress for<br />
RHPC at the same number of cumulative cycles. These factors are given in table 3.<br />
From the figures and the tables becomes clear that a significant stress<br />
reduction is achieved by using a RHPC surfacing. For the strain gauges 11 and 12 a<br />
smaller reduction is achieved. This is due to the fact that these gauges are placed a<br />
little bit outside the wheel track, which means that the global behavior becomes more<br />
visible. The higher stress reduction factors for a cumulative number of 100000 cycles<br />
are also due to this phenomenon. Based on these measured stress spectra, an average<br />
reduction factor for the stress in the deck of 0.2 is derived and an average reduction<br />
factor of 0.4 for the stress in the trough web is derived.<br />
333<br />
©Copyright 2004 Bouwdienst Rijkswaterstaat and University of Technology Delft
Downloaded from:http//:www.ferroplan.com<br />
2004 Orthotropic Bridge Conference, Sacramento, California, USA – August 25-27, 2004<br />
Table 1. Mastic asphalt stress ranges (MPa)<br />
Cycles Gauge 7 Gauge 8 Gauge 9 Gauge 10 Gauge 11 Gauge 12<br />
100 116 146 105 149 62 92<br />
1000 95 117 85 113 46 72<br />
10000 67 75 62 68 29 47<br />
100000 31 36 28 29 11 20<br />
Table 2. RHPC stress ranges (MPa)<br />
Cycles Gauge 7 Gauge 8 Gauge 9 Gauge 10 Gauge 11 Gauge 12<br />
100 15 39 18 42 15 36<br />
1000 13 33 15 34 13 31<br />
10000 9 25 11 26 9 25<br />
100000 4 14 7 17 0 16<br />
Table 3. Stress reduction factor<br />
Cycles Gauge 7 Gauge 8 Gauge 9 Gauge 10 Gauge 11 Gauge 12<br />
100 0,13 0,26 0,17 0,28 0,25 0,40<br />
1000 0,14 0,28 0,17 0,30 0,27 0,43<br />
10000 0,14 0,34 0,18 0,39 0,31 0,53<br />
100000 0,13 0,38 0,26 0,59 0,00 0,79<br />
A simple approach of the lifetime enhancement due to this stress reduction uses the<br />
regular slope m=3 of the fatigue detail curves. The lifetime enhancement factor in this<br />
simple approach is 1/(0.2 3 ) = 125 for fatigue cracks of the deck plate and 1/(0.4 3 ) =<br />
16. This is a conservative approach because a significant part of the stress cycles is in<br />
the region of the slope m=5 or even below the fatigue limit. In a more detailed study<br />
of the lifetime enhancement this should be researched, and also the effects of the<br />
global stresses.<br />
Conclusions<br />
The use of RHPC as bridge deck surfacing is a good alternative for a conventional<br />
asphalt surfacing. The pilot project on the Caland Bridge has shown that it is a good<br />
and workable solution, which can be applied in a few days. Replacement of the<br />
surfacing of mastic asphalt with a RHPC surfacing reduces the stresses in the deck<br />
plate with approximately 80% and the stresses in the longitudinal weld between deck<br />
plate and trough web with approximately 60%. Therefore it might be concluded that<br />
the use of a RHPC surfacing is a very effective solution with respect to the fatigue<br />
behavior of the bridge deck structure.<br />
References<br />
Buitelaar, P., Braam, C.R., Kaptijn, N. (2004), “Reinforced high performance<br />
concrete overlay system for steel bridges”, Conference proceedings 5 th International<br />
CROW-workshop on fundamental modelling of the design and performance of<br />
concrete pavements 1&2 April 2004, Istanbul<br />
334<br />
©Copyright 2004 Bouwdienst Rijkswaterstaat and University of Technology Delft
Downloaded from:http//:www.ferroplan.com<br />
2004 Orthotropic Bridge Conference, Sacramento, California, USA – August 25-27, 2004<br />
Jong, F.B.P. de, Boersma, P.D (2003), “Lifetime calculations for orthotropic steel<br />
bridge decks”, Conference Proceedings 10 th International conference on Structural<br />
Faults and Repair on steel structures, London<br />
Jong, F.B.P. de, Boersma, P.D. (2004-a), “Maintenance philosophy and Systematic<br />
lifetime assessment for decks suffering from fatigue”, Conference proceedings<br />
Orthotropic Bridge Conference, Sacramento, CA<br />
Jong, F.B.P. de (2004-b), “Overview Fatigue phenomenon in orthotropic bridge<br />
decks in the Netherlands”, Conference proceedings Orthotropic Bridge Conference,<br />
Sacramento, CA<br />
Kolstein, M.H., Wardenier, J. (1998), “A new type of fatigue failures in steel<br />
orthotropic bridge decks”, Proceedings of Fifth Pacific Structural Steel Conference,<br />
pp. 483-488, Techno Press, Korea<br />
Kolstein, M.H. (2003), “Strain measurements Calandbridge 2003”, Stevin report 6-<br />
03-13, Delft<br />
Pover, J.P. (2002), “Rapportage mbt uitgevoerde analyses tbv levensduurverlengende<br />
oplossingen in het kader van het PSR-project (Problematiek Stalen Rijdekken)” (in<br />
Dutch), Zoetermeer<br />
335<br />
©Copyright 2004 Bouwdienst Rijkswaterstaat and University of Technology Delft
Downloaded from:http//:www.ferroplan.com<br />
2004 Orthotropic Bridge Conference, Sacramento, California, USA – August 25-27, 2004<br />
Figures<br />
fatigue crack DPS01<br />
deckplate<br />
fatigue crack DPS02<br />
deckplate<br />
crossbeam<br />
trough<br />
trough wall<br />
Figure 1. Deck plate crack<br />
Figure 2. RHPC surfacing<br />
336<br />
©Copyright 2004 Bouwdienst Rijkswaterstaat and University of Technology Delft
Downloaded from:http//:www.ferroplan.com<br />
2004 Orthotropic Bridge Conference, Sacramento, California, USA – August 25-27, 2004<br />
Figure 3. FEM model stress calculation<br />
Figure 4. Full-scale fatigue test RHPC surfacing<br />
337<br />
©Copyright 2004 Bouwdienst Rijkswaterstaat and University of Technology Delft
Downloaded from:http//:www.ferroplan.com<br />
2004 Orthotropic Bridge Conference, Sacramento, California, USA – August 25-27, 2004<br />
Figure 5. Caland bridge<br />
Figure 6. Removing asphalt<br />
Figure 7. Removing asphalt<br />
Figure 8. Placing covering<br />
Figure 9. Ultrasonic TOFD inspection Figure 10. Found crack<br />
338<br />
©Copyright 2004 Bouwdienst Rijkswaterstaat and University of Technology Delft
Downloaded from:http//:www.ferroplan.com<br />
2004 Orthotropic Bridge Conference, Sacramento, California, USA – August 25-27, 2004<br />
Figure 11. Submerged arc welding<br />
Figure 12. Repaired fatigue crack<br />
Figure 13. Magnetic testing<br />
Figure 14. Shot blasting deck plate<br />
Figure 15. Epoxy layer<br />
Figure 16. Reinforcement<br />
339<br />
©Copyright 2004 Bouwdienst Rijkswaterstaat and University of Technology Delft
Downloaded from:http//:www.ferroplan.com<br />
2004 Orthotropic Bridge Conference, Sacramento, California, USA – August 25-27, 2004<br />
Figure 17. Reinforcement<br />
Figure 18. Casting concrete<br />
Figure 19. Power floating<br />
Figure 20. Finished RHPC surfacing<br />
340<br />
©Copyright 2004 Bouwdienst Rijkswaterstaat and University of Technology Delft
Downloaded from:http//:www.ferroplan.com<br />
2004 Orthotropic Bridge Conference, Sacramento, California, USA – August 25-27, 2004<br />
Figure 21. General view of the measured cross sections A, B and C.<br />
Figure 22. Strain gauge positions near the weld at cross section A, B and C<br />
341<br />
©Copyright 2004 Bouwdienst Rijkswaterstaat and University of Technology Delft
Downloaded from:http//:www.ferroplan.com<br />
2004 Orthotropic Bridge Conference, Sacramento, California, USA – August 25-27, 2004<br />
Figure 23. Strain gauge positions near the crossbeams at cross section A and C<br />
Figure 24. Numbering of the strain gauges at cross section A<br />
342<br />
©Copyright 2004 Bouwdienst Rijkswaterstaat and University of Technology Delft
Downloaded from:http//:www.ferroplan.com<br />
2004 Orthotropic Bridge Conference, Sacramento, California, USA – August 25-27, 2004<br />
Figure 25. Numbering of the strain gauges at cross section B<br />
Figure 26. Numbering of the strain gauges at cross section C<br />
343<br />
©Copyright 2004 Bouwdienst Rijkswaterstaat and University of Technology Delft
Downloaded from:http//:www.ferroplan.com<br />
2004 Orthotropic Bridge Conference, Sacramento, California, USA – August 25-27, 2004<br />
Stress range (MPa)<br />
140<br />
120<br />
100<br />
80<br />
60<br />
40<br />
20<br />
Gauge 7 - deck plate<br />
MA 31-03-03 to 27-04-03<br />
RHPC 05-05-03 to 08-06-03<br />
0<br />
1 100 10000 1000000<br />
Cumulative number of cycles<br />
Figure 27. Frequency curves strain gauge 7 at deck plate<br />
Stress range (MPa)<br />
140<br />
120<br />
100<br />
80<br />
60<br />
40<br />
20<br />
Gauge 9 - deck plate<br />
MA 31-03-03 to 27-04-03<br />
RHPC 05-05-03 to 08-06-03<br />
0<br />
1 100 10000 1000000<br />
Cumulative number of cycles<br />
Figure 28. Frequency curves strain gauge 9 at deck plate<br />
Stress range (MPa)<br />
80<br />
70<br />
60<br />
50<br />
40<br />
30<br />
20<br />
10<br />
0<br />
Gauge 11 - deck plate<br />
MA 31-03-03 to 27-04-03<br />
RHPC 05-05-03 to 08-06-03<br />
1 100 10000 1000000<br />
Cumulative number of cycles<br />
Figure 29. Frequency curves strain gauge 11 at deck plate<br />
344<br />
©Copyright 2004 Bouwdienst Rijkswaterstaat and University of Technology Delft
Downloaded from:http//:www.ferroplan.com<br />
2004 Orthotropic Bridge Conference, Sacramento, California, USA – August 25-27, 2004<br />
Stress range (MPa)<br />
200<br />
180<br />
160<br />
140<br />
120<br />
100<br />
80<br />
60<br />
40<br />
20<br />
0<br />
Gauge 8 - trough weld<br />
MA 31-03-03 to 27-04-03<br />
RHPC 05-05-03 to 08-06-03<br />
1 100 10000 1000000<br />
Cumulative number of cycles<br />
Figure 30. Frequency curves strain gauge 8 at trough web<br />
Stress range (MPa)<br />
Gauge 10 - trough weld<br />
200<br />
180<br />
MA 31-03-03 to 27-04-03<br />
160<br />
140<br />
RHPC 05-05-03 to 08-06-03<br />
120<br />
100<br />
80<br />
60<br />
40<br />
20<br />
0<br />
1 100 10000 1000000<br />
Cumulative number of cycles<br />
Figure 31. Frequency curves strain gauge 10 at trough web<br />
Stress range (MPa)<br />
140<br />
120<br />
100<br />
80<br />
60<br />
40<br />
20<br />
Gauge 12 - trough weld<br />
MA 31-03-03 to 27-04-03<br />
RHPC 05-05-03 to 08-06-03<br />
0<br />
1 100 10000 1000000<br />
Cumulative number of cycles<br />
Figure 32. Frequency curves strain gauge 12 at trough web<br />
347<br />
©Copyright 2004 Bouwdienst Rijkswaterstaat and University of Technology Delft