RESEARCH PROJECT TU DELFT; BEHAVIOUR CONVENTIONAL ...
RESEARCH PROJECT TU DELFT; BEHAVIOUR CONVENTIONAL ...
RESEARCH PROJECT TU DELFT; BEHAVIOUR CONVENTIONAL ...

You also want an ePaper? Increase the reach of your titles
YUMPU automatically turns print PDFs into web optimized ePapers that Google loves.
Downloaded from:http//:www.ferroplan.com<br />
2004 Orthotropic Bridge Conference, Sacramento, California, USA – August 25-27, 2004<br />
<strong>RESEARCH</strong> <strong>PROJECT</strong> <strong>TU</strong> <strong>DELFT</strong>; <strong>BEHAVIOUR</strong> <strong>CONVENTIONAL</strong> BRIDGE<br />
DECKS & DEVELOPMENT OF RENOVATION TECHNIQUES<br />
F.B.P.de Jong*, M.H.Kolstein** and F.S.K.Bijlaard***<br />
*Civil Engineer, Delft University of Technology, P.O.Box 5048, 2600 GA, Delft,<br />
The Netherlands; Phone +31-15 278 57 16; f.b.p.dejong@citg.tudelft.nl and Ministry<br />
of Transport, P.O.Box 59, 2700 AB, Zoetermeer, The Netherlands; Phone +31 – 79<br />
329 25 19; f.b.p.dejong@bwd.rws.minvenw.nl **Senior Research Engineer, Delft<br />
University of Technology, P.O.Box 5048, 2600 GA, Delft, The Netherlands; Phone<br />
+31-15 278 40 05; m.h.kolstein@citg.tudelft.nl ***Professor of Steel Structures,<br />
Delft University of Technology, P.O.Box 5048, 2600 GA, Delft, The Netherlands;<br />
Phone +31-15 278 16 75; f.s.k.bijlaard@citg.tudelft.nl<br />
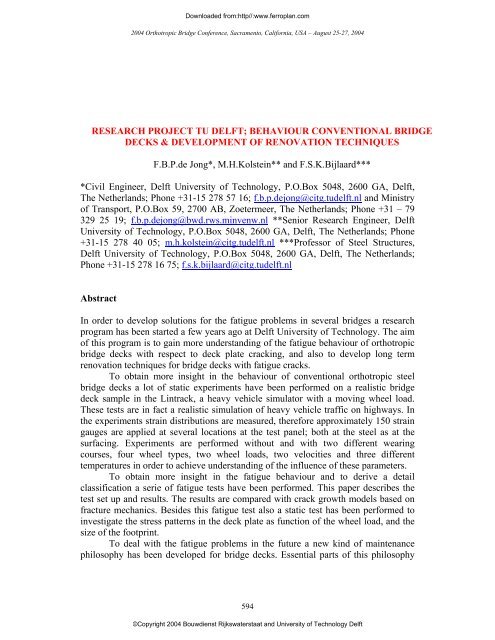
Abstract<br />
In order to develop solutions for the fatigue problems in several bridges a research<br />
program has been started a few years ago at Delft University of Technology. The aim<br />
of this program is to gain more understanding of the fatigue behaviour of orthotropic<br />
bridge decks with respect to deck plate cracking, and also to develop long term<br />
renovation techniques for bridge decks with fatigue cracks.<br />
To obtain more insight in the behaviour of conventional orthotropic steel<br />
bridge decks a lot of static experiments have been performed on a realistic bridge<br />
deck sample in the Lintrack, a heavy vehicle simulator with a moving wheel load.<br />
These tests are in fact a realistic simulation of heavy vehicle traffic on highways. In<br />
the experiments strain distributions are measured, therefore approximately 150 strain<br />
gauges are applied at several locations at the test panel; both at the steel as at the<br />
surfacing. Experiments are performed without and with two different wearing<br />
courses, four wheel types, two wheel loads, two velocities and three different<br />
temperatures in order to achieve understanding of the influence of these parameters.<br />
To obtain more insight in the fatigue behaviour and to derive a detail<br />
classification a serie of fatigue tests have been performed. This paper describes the<br />
test set up and results. The results are compared with crack growth models based on<br />
fracture mechanics. Besides this fatigue test also a static test has been performed to<br />
investigate the stress patterns in the deck plate as function of the wheel load, and the<br />
size of the footprint.<br />
To deal with the fatigue problems in the future a new kind of maintenance<br />
philosophy has been developed for bridge decks. Essential parts of this philosophy<br />
594<br />
©Copyright 2004 Bouwdienst Rijkswaterstaat and University of Technology Delft
Downloaded from:http//:www.ferroplan.com<br />
2004 Orthotropic Bridge Conference, Sacramento, California, USA – August 25-27, 2004<br />
are lifetime calculations, inspection techniques and renovation techniques. The<br />
fundamentals of this philosophy are described in brief.<br />
Outline research program<br />
In the past a lot of orthotropic steel bridge decks have been build. The vast majority<br />
of these bridges in the Netherlands is build up between 1960 en 1980. Figure 1 shows<br />
the construction of this type of bridge, with two frequently observed, fatigue cracks.<br />
Fatigue phenomena are known as one of the most devastating problems for this kind<br />
of bridges in the Netherlands. A well-known example of a bridge suffering from<br />
fatigue is the Bascule Bridge Van Brienenoord in the harbour of Rotterdam (De Jong,<br />
2003-a). Various crack types have already been detected in several bridges. For a<br />
description of these cracks see (Leendertz, 2003) or (De Jong, 2004-b). As the fatigue<br />
cracks are induced by the amount of traffic and the heavy axle loads, fatigue<br />
problems will arise even more in the future. Bridge owners have to expect a lot of<br />
bridges with fatigue cracks in the next future. The cracks occur both in decks with a<br />
thin surfacing and decks with a thick asphaltic surfacing, asphalt only lowers the<br />
crack growth rate (De Jong, 2004-b).<br />
Bridge owners generally want the time spended to maintenance as less as<br />
possible, still remaining the required safety level. The maintenance strategy must be:<br />
maximizing availability, minimizing maintenance. Given this strategy the need for<br />
long term renovation techniques for orthotropic steel bridge decks with fatigue cracks<br />
is obvious. A research program to develop these renovation techniques is started at<br />
Delft University of Technology. The objective of the research is to develop some<br />
long-term renovation techniques, which are able to fulfil another lifetime of<br />
approximately 25 years without serious maintenance activities. The research is split<br />
up into a few parts, which will be revealed in this paragraph.<br />
After the problem definition and determination of the research objectives<br />
several renovation techniques have been designed which might possibly form<br />
solutions for the fatigue problems. Because influencing traffic properties (decreasing<br />
axle loads and traffic flow) is outside the scope of this research and in practice hardly<br />
to achieve, the designed renovation techniques are intended to reduce the stress range<br />
by modifying the construction of the bridge deck.<br />
Examples of designed renovation techniques are replacing the asphaltic<br />
surfacing by high strength concrete, where the concrete is bonded to the original steel<br />
deck plate. This method might be very useful for fixed bridges, because the majority<br />
of fixed bridges is supplied with an asphaltic surfacing. Instead of high strength<br />
concrete an aluminium extrusion profile could be bonded to the original steel deck<br />
plate, also an appropriate method for fixed bridges. In general renovation techniques<br />
can have the same thickness as the asphaltic surfacing that can be removed. Figure 2<br />
shows at the left side a typical cross-section of a steel deck plate with a widely used<br />
mastic asphaltic surfacing. On the right side it shows an aluminium extrusion profile<br />
as an example of a renovation technique. Bonding a second steel plate to the old steel<br />
plate in the heavy vehicle lane is one of the designed techniques for renovation of<br />
movable bridges. Limitation of extra weight due to the renovation is important<br />
because the constructions are not designed for increase of weight in the future.<br />
595<br />
©Copyright 2004 Bouwdienst Rijkswaterstaat and University of Technology Delft
Downloaded from:http//:www.ferroplan.com<br />
2004 Orthotropic Bridge Conference, Sacramento, California, USA – August 25-27, 2004<br />
After completion of the design stage the designed renovation techniques must<br />
be investigated both numerical and experimental. This is necessary to achieve insight<br />
in the mechanical behaviour as well as insight in the fatigue behaviour of the<br />
renovated bridge decks. Within the experimental part of the research program<br />
emphasis will be made on static tests and fatigue tests. The experimental work is<br />
partly done in the laboratory and partly done in the Lintrack, a heavy vehicle<br />
simulator. The experiments in the Lintrack are a major part of the research project<br />
(De Jong, 2002, De Jong, 2004-a ).<br />
In the last phase of the project the designed renovation techniques will be<br />
evaluated, based on the numerical and experimental work. The results of this phase<br />
are design procedures and recommendations for renovations for steel bridge decks.<br />
Behaviour orthotropic bridge decks<br />
Test purpose. Within this research project strain measurements on a realistic bridge<br />
deck panel have been carried out with a heavy vehicle simulator, thus creating test<br />
conditions that are more in accordance with the situation on the motorways as in a<br />
laboratory.<br />
Determination of stress and strain distribution under real moving wheel loads<br />
in deck plate, trough wall and surfacing in conventional orthotropic steel bridge decks<br />
is in general the purpose of the first test serie in the Lintrack. Conventional bridge<br />
decks in the Netherlands have a deck thickness of 10 mm, and the centre-to-centre<br />
distance between the trough webs is usually 300 mm. Furthermore almost every fixed<br />
bridge is supplied with a layer of 50 mm mastic asphalt. The experiments are<br />
performed without and with two different surfacing layers, four wheel types, two<br />
wheel loads and three different temperatures in order to achieve understanding of the<br />
influence of these parameters. The tests are intended to obtain a better insight in the<br />
behaviour of conventional orthotropic steel bridge decks, especially about the strains<br />
at the level of the deck plate.<br />
The reported tests are also called benchmark experiments. At a second<br />
comparable test panel renovation techniques will be applicated thus representing<br />
renovated bridge decks. Identical test as those forming the benchmark experiments<br />
will be conducted at this second renovated test panel, in this way enabling a<br />
comparison between unrenovated and renovated bridge decks. The comparison is<br />
intended to quantify the stress and strain reduction at crack locations due to the<br />
application of the renovation technique. The second test serie is not yet performed.<br />
The tests are performed on a realistic bridge deck sample in the Lintrack, a heavy<br />
vehicle simulator, thus being a realistic simulation of heavy vehicle traffic on<br />
highways.<br />
Test panel. For the benchmark tests in the Lintrack a conventional standard<br />
orthotropic steel deck with a thin steel deck plate of 10 mm was available. The<br />
thickness of 10 mm was chosen because almost every fixed bridge in the Netherlands<br />
has this deck plate thickness. Figure 3 comprises among other things a technical<br />
drawing of the test panels. The distance between the transverse crossbeams is 2 m,<br />
while in practice 4 m is a regular distance. This distance was shortened in the test<br />
596<br />
©Copyright 2004 Bouwdienst Rijkswaterstaat and University of Technology Delft
Downloaded from:http//:www.ferroplan.com<br />
2004 Orthotropic Bridge Conference, Sacramento, California, USA – August 25-27, 2004<br />
specimens to create more crossings between crossbeam and trough profile. The<br />
crossbeams are continuously supported, while in bridges they are only supported by<br />
the main girders. These are two significant differences between the test panels and<br />
real bridges, but for the research reported irrelevant because this is pointed towards<br />
fatigue problems at deck plate level. The sections of the test panel are supplied with<br />
two different surfacings; in section 1 a layer of 50 mm conventional mastic asphalt<br />
and in section 2 a layer of 50 mm ZOK, which is an open graded polymer based<br />
surfacing. ZOK is a new type of surfacing, which is used a few times up to now.<br />
Testing facility. The tests have been conducted in the Lintrack, a heavy vehicle<br />
simulator originally build up for pavement testing (Groenendijk, 1998). The Lintrack<br />
gives the possibility of simulating real traffic on bridge decks. Figure 4 shows a side<br />
view of the Lintrack. Basically it is an apparatus with a moving wheel load. The load<br />
can be varied between 15 en 100 kN, the velocity between 0 en 20 km/h. Different<br />
tyres can be mounted to the axis. Besides the movement in longitudinal direction,<br />
movements in lateral direction are possible to enable the creation of influence<br />
surfaces and gaussian distribution of the wheel loads in pavement testing. The<br />
Lintrack facility is equipped with a heating installation in order to control the<br />
temperature of tested pavement material.<br />
Instrumentation. Approximately 150 strain gauges are applied at several locations at<br />
the test panel, which measure the strain in transverse direction; at the top and bottom<br />
of the steel deck plate, at the web of the trough, at the top of the intermediate layer<br />
between steel deck plate and surfacing layer and at the topside of the surfacing. In<br />
both sections similar sets of gauges are attached to several crossbeams and fields<br />
between the crossbeams. The strain gauge measurements have been done with a<br />
sample rate of 250 Hz. The location of the strain gauges is extensively described in<br />
Stevin Report 6.03.6 (De Jong, 2003-b)<br />
Testing program. The essence of all tests is measuring strains to produce influence<br />
lines and surfaces for the strain gauges. The benchmark experiment is basically a<br />
serie of identical tests, in which a few parameters are varied. These parameters are the<br />
wheel load, the wheel type, the velocity of the wheel, the presence and temperature of<br />
the surfacing. Table 1 summarizes the parameters involved. The wheel types are<br />
according to Eurocode 1991:2-2003, except the super super single. This wheel is a<br />
new developed wheel type with a width of approximately 50 cm.<br />
Table 1. Parameters Lintrack bench mark tests<br />
Wheel load Wheel type Velocity Surfacing<br />
25 kN A - Single 0 km/h No surfacing<br />
50 kN B - Double 2 km/h Surfacing 0° C<br />
C - Super Single 20 km/h Surfacing 15° C<br />
D - Super Super Single<br />
Surfacing 30° C<br />
The influence lines and surfaces are obtained for all reasonable combinations<br />
of the parameters. The experiments are performed before and again after the<br />
597<br />
©Copyright 2004 Bouwdienst Rijkswaterstaat and University of Technology Delft
Downloaded from:http//:www.ferroplan.com<br />
2004 Orthotropic Bridge Conference, Sacramento, California, USA – August 25-27, 2004<br />
application of the surfacings. The testing program is executed both in section 1<br />
(Mastic asphalt) as well as in section 2 (ZOK). The wheel loads have been chosen on<br />
basis of wheel load measurements in Dutch motorways (Vrouwenvelder, 1998, 2000-<br />
a, 2000-b). The two chosen loads cover the part of the axle loads, which produces the<br />
fatigue damage for a large extent. The wheel types are usually tyres for heavy<br />
vehicles, except the super super single.<br />
Test results. Influence surfaces have been created. The aim of the analyses is to draw<br />
conclusions about the influence of wheel type, wheel load, temperature and the<br />
velocity of the wheel on the stress pattern and stress level in the bridge deck<br />
construction; the differences between a bridge without surfacing, a bridge deck with<br />
asphaltic surfacing and a bridge deck with a ZOK surfacing; the composite action<br />
between the steel deck plate and the surfacing layer; the reliability of the<br />
measurements.<br />
The results are presented for two locations. These are detail B, the deck plate at<br />
the intersection trough wall-crossbeam, and detail A, the longitudinal weld between<br />
trough and deck plate. Figures 5 and 6 present two influence surfaces. Information is<br />
in the upper left corner of each influence surface. Both are surfaces for strain gauge<br />
S33 that is mounted at the topside of the deck plate near the location of fatigue detail<br />
B. The longitudinal position is measured from crossbeam 1. The transverse position<br />
varies between –450 and 450 mm. For section 1 (mastic asphalt), 0 mm is the left<br />
web of trough 2, for section 2 (ZOK), 0 mm is the right web of trough 5, see figure 3.<br />
For an extensive description of the test set up and results see (De Jong, 2003-b, De<br />
Jong, 2003-c and De Jong, 2004-a).<br />
With respect to the reduction of the strains due to the two surfacing types at<br />
three different temperatures the reduction percentages of the strains in the steel<br />
construction are derived. The reduction is in comparison with a bridge deck without<br />
surfacing. The reduction percentages are summarized in Table 2. The reduction<br />
percentages are valid for the transversal strains in deck plate (detail B) and trough<br />
wall (detail A) at the location of the longitudinal weld between trough and deck plate.<br />
Table 2. Reduction percentages due to surfacing<br />
Deck plate Trough wall<br />
Detail B Detail A<br />
No surfacing (reference) 0% 0%<br />
Mastic asphalt app. 0 °C 70-80% 50%<br />
Mastic asphalt app. 15 °C 20-30% 20-30%<br />
Mastic asphalt app. 30 °C 0-10% 0-10%<br />
ZOK app. 0 °C 80-90% 50-70%<br />
ZOK app.15 °C 60-70% 40-50%<br />
ZOK app. 30 °C 50% 30-40%<br />
Besides these reductions due to surfacing the following conclusions can be drawn<br />
from the tests at the Lintrack.<br />
598<br />
©Copyright 2004 Bouwdienst Rijkswaterstaat and University of Technology Delft
Downloaded from:http//:www.ferroplan.com<br />
2004 Orthotropic Bridge Conference, Sacramento, California, USA – August 25-27, 2004<br />
1. The strains due to wheel A are approximately the same as the strains due to<br />
wheel C. Strains under wheels B en D are smaller compared to strains under<br />
wheel C. This is the effect of mainly the width of the footprint. The larger the<br />
footprint the smaller the strain at the same load level.<br />
2. Halve the load does not mean halve the strains. Due to a smaller footprint<br />
by a smaller load, the load is more concentrated, causing relatively higher strains.<br />
3. A velocity up to 20 km/h does not significantly influence the strains.<br />
4. Both surfacing materials are sensitive to temperature differences, but mastic<br />
asphalt is more temperature sensitive then ZOK.<br />
5. The strains in the steel deck plate are approximately the same for the cases<br />
no surfacing and mastic asphalt at app. 30°C. This indicates that the usual<br />
modelling with a spread-to-depth ratio is less valid for surfacings.<br />
Static and fatigue behaviour deck plate location<br />
Introduction. Besides the experiments in the heavy vehicle simulator Lintrack, there<br />
are also experiments performed on smaller test panels in the laboratory. The<br />
laboratory experiments are also intended for validation of renovation techniques.<br />
Experimental validation should simulate the application of renovation techniques on<br />
bridges as best as possible. For these reason a few smaller orthotropic test panels are<br />
available for application of the renovation techniques. After application of the<br />
renovation techniques the test panels will be subjected to fatigue tests in order to<br />
determine the behaviour of renovated bridge deck structures.<br />
The research project focuses on deck plate cracks, for two reasons. First, deck plate<br />
cracks are often observed in highway bridges in the Netherlands. Second, this crack<br />
type makes bridge renovation on a large scale necessary. The fatigue tests focus on<br />
deck plate cracks at the intersection trough-crossbeam, the DPS01 crack. This crack<br />
type was for the first time detected at the Van Brienenoord Bridge in 1997 (De Jong,<br />
2003-a).<br />
A laboratory simulation consists of four phases:<br />
1. The unrenovated bridge deck test panel is subjected to a fatigue test in order to<br />
create fatigue cracks in the deck plate<br />
2. The fatigue cracks are repaired if necessary<br />
3. The renovation method is applicated to the bridge test panel<br />
4. The renovated bridge deck test panel is subjected to static and fatigue tests in<br />
order to obtain insight in the behaviour of the renovated structure.<br />
This paper only describes phase 1, the fatigue tests.<br />
Test purpose. The static and fatigue tests on laboratory test panels have four<br />
purposes. 1. Creating deck plate fatigue cracks. 2. Derive a Wöhler detail<br />
classification for the DPS01 crack. 3. Obtaining crack growth information both in<br />
vertical and in longitudinal direction. 4. Determine stress patterns in the deck plate at<br />
the crossing trough-crossbeam.<br />
Creating DPS01 deck plate fatigue cracks is the main purpose in phase 1. This<br />
test is an opportunity to obtain more information about the static and fatigue<br />
behaviour of this detail. Based on this new information a Wöhler classification can be<br />
599<br />
©Copyright 2004 Bouwdienst Rijkswaterstaat and University of Technology Delft
Downloaded from:http//:www.ferroplan.com<br />
2004 Orthotropic Bridge Conference, Sacramento, California, USA – August 25-27, 2004<br />
derived. Moreover the crack growth is monitored, which results in a crack growth<br />
relation, for crack growth in longitudinal direction after the crack is grown through<br />
the deck plate. The test gives also the possibility to determine accurate stress patterns<br />
in the deck plate at the crossing trough-crossbeam.<br />
Realistic simulation of the vertical crack growth is possible. In the phase of<br />
longitudinal crack growth small differences between the situation in the laboratory<br />
and real traffic conditions can occur, because an eccentricity between the location of<br />
the test load and the location of the maximum stress increases when the crack length<br />
grows.<br />
Test panels. Two test panels have been subjected to laboratory tests. Test panel A is<br />
given in figure 7. Test panel B is given in figure 8. Panel A is 2 * 2 m, panel B is B 2<br />
* 4 m and has two crossbeams in stead of one as in panel A. The deck plate thickness<br />
for both panels is 10 mm. Both panels have three trapezoidal trough profiles 2/325/6,<br />
with a centre-to-centre distance of 600 mm. Panel A has one crossbeam, panel B has<br />
two crossbeams. Panel A is initially used for the static test to determine stress<br />
patterns and subsequently for fatigue tests. Panel B is only used for fatigue tests.<br />
Panel A has 6 locations, and panel B has twelve locations where the DPS01 crack is<br />
possible. In total 18 DPS01 cracks have been created.<br />
Testing program. The measurements of the static strain patterns are performed for 11<br />
different footprints on the middle trough of panel A. Each footprint has a different<br />
load. The length and width of these footprints are based on the measured footprint<br />
areas in earlier tests (Kolstein, 2000, De Jong, 2003-c). Table 3 summarizes the width<br />
and length for each test and the load that has been used. Width and length of the<br />
footprint are in transversal and longitudinal direction of the trough profile.<br />
Table 3. Testing program static tests panel A<br />
Test nr. Width (mm) Length (mm) F (kN)<br />
BA1_S1 220 180 31<br />
BA1_S2 220 250 34<br />
BA1_S3 220 320 38<br />
BA1_S4 250 160 35<br />
BA1_S5 250 220 39<br />
BA1_S6 250 270 42<br />
BA1_S7 250 320 45<br />
BA1_S8 270 320 49<br />
BA1_S9 280 180 40<br />
BA1_S10 280 240 44<br />
BA1_S11 430 170 59<br />
Figure 9 gives the strain gauges at the deck plate of trough 2, which are used for the<br />
static tests. All strain gauges measure the strains in transverse direction. The fatigue<br />
tests have been performed with different loads. The applied loads are given in Table<br />
4. The load is applied on a load area of 270 mm by 320 mm. (width * length). During<br />
600<br />
©Copyright 2004 Bouwdienst Rijkswaterstaat and University of Technology Delft
Downloaded from:http//:www.ferroplan.com<br />
2004 Orthotropic Bridge Conference, Sacramento, California, USA – August 25-27, 2004<br />
the fatigue test the strains have continuously been measured with the attached strain<br />
gauges.<br />
Table 4. Applied loads fatigue tests panel A and B<br />
Test nr. Description<br />
Fmin (kN) Fmax (kN) Range (kN) R-ratio<br />
C & B Panel A trough 1 5 68.78 63.78 0.073<br />
E & F Panel A trough 2 5 69.30 64.30 0.072<br />
A & D Panel A trough 3 5 69.01 64.01 0.072<br />
br202 Panel B crossbeam 1 trough 1 5 80.27 75.27 0.062<br />
br203 Panel B crossbeam 1 trough 2 5 80.15 75.15 0.062<br />
br204 Panel B crossbeam 1 trough 3 5 79.97 74.97 0.063<br />
br-08 Panel B crossbeam 2 trough 1 5 93.76 88.76 0.053<br />
br-09 Panel B crossbeam 2 trough 2 5 77.18 72.18 0.065<br />
br-10 Panel B crossbeam 2 trough 3 5 77.19 72.19 0.065<br />
Static test results. For the static tests the measured strain signals have been<br />
graphically presented for various defined lines. The lines are given in figure 9. This is<br />
done for all the footprint sizes. In this paper the graphical results are given for the<br />
lines A-A and G-G, for footprint nr 8. (270 * 320 mm). See figure 10 and 11.<br />
The figures also include analytical results. For the analytical stress<br />
calculation, the deck plate between the two legs of the trough can be modelled as a<br />
simple clamped beam. The span of this beam is 300 mm, the distance between the<br />
trough legs. The clamped beam model is only valid for the position exactly at the<br />
crossbeam. The analytical calculated stresses are significantly higher than the<br />
measured stresses. This is mainly due to the fact that dispersion of the loads in<br />
longitudinal direction is not taken into account.<br />
From the static test became obvious that the width and the length have<br />
influence on the stress. Wider and longer footprints result in lower stresses at the<br />
critical locations. This paper has described the static tests very concise. The static<br />
tests are reported extensively in Stevin Report 6.04.3. (De Jong, 2004-e)<br />
Fatigue test results, introduction. The fatigue tests are also reported very briefly in<br />
this paper. For a more extensive description see Stevin report 6.04.4 (De Jong, 2004-<br />
f). The ranges for test br-08 are in the plastic region. Therefore this test result is<br />
excluded from the further analysis.<br />
During the fatigue tests the bridge deck structure is visually inspected on very<br />
regular basis. Tables 5 and 6 present for test panels A and B, the number of cycles<br />
and the crack length for the first visual crack observation and for the last observation.<br />
The number of cycles before the first visual observation is clearly dependent on the<br />
applied loads. Figures 12 and 13 visualize the crack growth for test panels A and B.<br />
According to usual definitions in the fracture mechanics the crack depth is defined as<br />
a (mm) and the total crack length as 2c (mm), however the dimension 2c is defined at<br />
the top side of the crack, because the observations have been taken place from the top<br />
side of the bridge deck, see figure 14. It is clearly visible from figures 12 and 13 that<br />
601<br />
©Copyright 2004 Bouwdienst Rijkswaterstaat and University of Technology Delft
Downloaded from:http//:www.ferroplan.com<br />
2004 Orthotropic Bridge Conference, Sacramento, California, USA – August 25-27, 2004<br />
the crack growth rate in longitudinal direction, after the crack has been observed at<br />
the topside of the deck plate, is constant for a total crack length up to 200 mm. This is<br />
in accordance with previous measurements, (Kolstein, 2000). The load ranges for test<br />
A are all 64 kN. The load ranges for test B vary from 72 to 75 kN.<br />
Table 5. Cycles and crack length panel A<br />
First Visual Crack<br />
End fatigue test<br />
Nr. N Length (mm) N Length (mm)<br />
Trough 1 C 1310910 36 3055450 165<br />
Trough 1 B 1141172 34 3055450 208<br />
Trough 2 E 1561051 26 3055450 201<br />
Trough 2 F 1650740 23 3055450 136<br />
Trough 3 A 1140605 22 3205000 150<br />
Trough 3 D 1472200 23 3205000 155<br />
Table 6. Cycles and crack length panel B<br />
First Visual Crack<br />
End fatigue test<br />
Nr. N Length (mm) N Length (mm)<br />
Br202 A 875431 5 1036042 40<br />
Br202 B 479221 10 1036042 120<br />
Br203 A 679663 12 1119456 92<br />
Br203 B 1119456 73 1119456 73<br />
Br204 A 477622 10 779815 85<br />
Br204 B 477622 10 779815 74<br />
Br-08 A 166209 25 280345 50<br />
Br-08 B 280345 15 280345 15<br />
Br-09 A 539944 30 901153 90<br />
Br-09 B 869925 8 901153 15<br />
Br-10 A 667255 10 1010108 75<br />
Br-10 B 771073 40 1010108 95<br />
Fatigue test results, crack growth. For both test A and test B a function that<br />
describes the average crack growth rate is derived from a linear regression analysis.<br />
These functions are given in the figures 12 and 13. A strong correlation between the<br />
applied load range and the crack growth rate is obvious from the comparison between<br />
the crack growth rate in test A and B. For test A d2c/dN = 8.1e-5, for test B d2c/dN =<br />
2.6e-4. All the data are presented on a log-log scale, and a linear regression analysis<br />
is executed. This is done to obtain a formula for d2c/dN as a function of ∆σ, where<br />
∆σ is the stress range in transversal direction at the crack location. This is the<br />
maximum in line A-A, see figure 9. This formula is:<br />
d2c<br />
log = logC 0 − m0<br />
⋅ log ∆σ<br />
dN<br />
602<br />
©Copyright 2004 Bouwdienst Rijkswaterstaat and University of Technology Delft
Downloaded from:http//:www.ferroplan.com<br />
2004 Orthotropic Bridge Conference, Sacramento, California, USA – August 25-27, 2004<br />
In which:<br />
m 0 = 2.70<br />
log C 0 = -10.50<br />
See figure 15 for a graphical presentation of this analysis.<br />
Fatigue test results, detail classification. The test data are used to derive<br />
characteristic fatigue detail classifications. For fatigue design these characteristic<br />
values should be divided by a factor γ m . The characteristic values are calculated for<br />
95% survival probability on a two-sided confidence level of 75% of the mean. These<br />
values are the same as the values on which the detail classifications in Eurocode 3 are<br />
based. The classification values are at 2e6 cycles.<br />
To derive a fatigue detail classification it is essential to decide which crack<br />
length is considered as failure of the deck plate. It is obvious that cracks in the deck<br />
plate do not threaten the structural integrity when they are short; up to 200 mm. As<br />
fatigue design calculations are intended to guarantee that no structural failure occurs<br />
during the service life of a structure, a crack length of 200 mm could possibly be<br />
defined as crack length at which the fatigue detail classification is chosen.<br />
The test performed however are ended when the crack length at the top side is<br />
approximately 100 to 150 mm. Based on the performed tests detail classifications for<br />
four cracks sizes have been defined.<br />
1. Crack length top side deck plate = 0 mm<br />
2. First visual crack = 23 mm (average for test A and B)<br />
3. Crack length top side deck plate = 50 mm<br />
4. Crack length top side deck plate = 100 mm<br />
Deriving the detail classification at all four definitions enables the designer in fact to<br />
calculate crack growth rates in an easy way.<br />
The number of cycles at 0, 50 and 100 mm crack length is derived from the<br />
visual observations. Because of the frequent observations during the tests, reliable<br />
estimations of the numbers of cycles at 0, 50 and 100 mm length have been derived.<br />
In general this is a dataset of 4 * 18 = 72 points. Some data are removed from the set,<br />
because they are unreliable, for several reasons. This leads to a reduced data set.<br />
Based on this reduced dataset the slope m has been derived by a linear regression<br />
analysis. Statistical evaluation of the data sets for the four cracks sizes has led to the<br />
detail classifications given in table 7. Figure 16 gives a figure of the analysis.<br />
In 1998 a detail classification based on fracture mechanics has been derived<br />
(Dijkstra, 1998). The calculated average value was 156 and the calculated design<br />
value 115, also according to the Eurocode format. The experimental results are<br />
somewhat better as the classification based on this crack growth model.<br />
Table 7. Fatigue classifications<br />
Crack length (mm) Design value Average value<br />
0 mm 147 197<br />
23 mm (average f.v.c) 161 211<br />
50 mm 173 223<br />
100 mm 194 251<br />
603<br />
©Copyright 2004 Bouwdienst Rijkswaterstaat and University of Technology Delft
Downloaded from:http//:www.ferroplan.com<br />
2004 Orthotropic Bridge Conference, Sacramento, California, USA – August 25-27, 2004<br />
In 1998 some fatigue tests on this detail have been performed (Kolstein, 1999,<br />
2000). In this tests three cracks, which are grown through the deck plate, have been<br />
observed. The results of Kolstein fit very well with the results of the tests reported in<br />
this paper.<br />
Maintenance Philosophy<br />
Conventional maintenance strategies for orthotropic steel bridge decks are formed by<br />
time-based inspections of the bridge structure and the replacement of parts of the<br />
structure when these parts are at the end of its lifetime. The inspections are intended<br />
to make decisions about replacement of parts of the structure. The left circle of figure<br />
17 gives a model of this kind of maintenance. This kind of maintenance is<br />
appropriate, provided that the time based interval is long and failure of elements<br />
within this interval doesn’t cause structural failure.<br />
In case of the fatigue problems on orthotropic steel bridge decks both<br />
requirements are not met. Experiences on steel bridges in the Netherlands have<br />
shown that monthly visual inspections on the steel bridge deck structure are necessary<br />
on the most heavily loaded bridge structures with fatigue cracks. Besides these<br />
expensive inspections also expensive emergency reparations of the deck structure are<br />
needed in case severe fatigue cracks are observed. Due to the nature of the fatigue<br />
phenomenon we can expect that the number of inspections and reparations will<br />
always increase. The conclusion must be that conventional maintenance is no longer<br />
appropriate, so the maintenance philosophy has to be changed to a risk based strategy<br />
(Boersma, 2003, De Jong 2003-a)<br />
In changing from conventional maintenance to a risk based maintenance<br />
strategy two major changes can be observed. The time based inspection interval has<br />
to be replaced by an interval based on a lifetime calculation. Systematic lifetime<br />
calculations for fatigue cracks are very important for a risk-based strategy. On the<br />
other hand local (emergency) reparations have to be replaced by renovation of the<br />
total bridge deck structure. An example of renovation is the replacement of the<br />
asphalt wearing course by a layer of high performance concrete (De Jong, 2004-d).<br />
References<br />
Boersma, P.D, Jong, F.B.P. de (2003), “Techniques & solutions for rehabilitation of<br />
orthotropic steel bridge decks in the Netherlands”, Conference Proceedings 10 th<br />
International conference on Structural Faults and Repair on steel structures, London<br />
Dijkstra, O.D., Vrouwenvelder, A.C.W.M. (1998), “Vermoeiing verkeersbruggen met<br />
orthotrope dekplaat. Case Brienenoord, TNO-report 98-CON-R0714” (in dutch)<br />
Eurocode 1991:2-2003 (2003), “Eurocode 1; Basis of design and actions on<br />
structures; Part 2: Traffic loads on bridges”<br />
604<br />
©Copyright 2004 Bouwdienst Rijkswaterstaat and University of Technology Delft
Downloaded from:http//:www.ferroplan.com<br />
2004 Orthotropic Bridge Conference, Sacramento, California, USA – August 25-27, 2004<br />
Groenendijk, J. (1998), “Accelarated testing and surface cracking of asphaltic<br />
concrete pavements, chapter 4, Diss. Delft University of Technology, Delft<br />
Jong, F.B.P. de, Kolstein M.H., Bijlaard F.S.K. (2002), “Development of long term<br />
renovation techniques for orthotropic steel bridge decks with fatigue cracks”,<br />
Conference Proceedings 3 rd European conference on steel structures, Eurosteel<br />
2002, vol.2 pp. 769-778, Coimbra<br />
Jong, F.B.P. de, Boersma, P.D (2003-a), “Lifetime calculations for orthotropic steel<br />
bridge decks”, Conference Proceedings 10 th International conference on Structural<br />
Faults and Repair on steel structures, London<br />
Jong, F.B.P. de (2003-b), “Plan Lintrack reference experiments on conventional<br />
orthotropic steel bridge decks with surfacings”, Stevin Report 6.03.6<br />
Jong, F.B.P. de (2003-c), “Data processing & Results Lintrack reference experiments<br />
on conventional orthotropic steel bridge deck with surfacings”, Stevin Report 6.03.7<br />
Jong, F.B.P. de (2004-a), “Strain measurement tests at orthotropic steel bridge decks<br />
with a heavy vehicle simulator, Stresses due to real moving wheel loads in deck plate,<br />
trough wall and surfacing”, Conference proceedings Nordic Steel Construction<br />
Conference, Copenhagen, 401-412<br />
Jong, F.B.P. de (2004-b), “Overview Fatigue phenomenon in orthotropic bridge<br />
decks in the Netherlands”, Conference proceedings Orthotropic Bridge Conference,<br />
Sacramento, CA<br />
Jong, F.B.P. de, Boersma, P.D. (2004-c), “Maintenance philosophy and Systematic<br />
lifetime assessment for decks suffering from fatigue”, Conference proceedings<br />
Orthotropic Bridge Conference, Sacramento, CA<br />
Jong, F.B.P. de, Kolstein, M.H. (2004-d), “Strengthening a bridge deck with high<br />
performance concrete”, Conference proceedings Orthotropic Bridge Conference,<br />
Sacramento, CA<br />
Jong, F.B.P. de (2004-e), “Stress distribution in orthotropic steel bridge decks,<br />
Measurements and calculations for the crossing trough-crossbeam”, Stevin Report<br />
6.04.3<br />
Jong, F.B.P. de (2004-f), “Fatigue tests for deck plate cracks in orthotropic bridge<br />
decks”, Stevin Report 6.04.4<br />
Kolstein, M.H., Wardenier, J. (1999), “Laboratory tests of the deckplate weld at the<br />
intersection of the trough and the crossbeam of steel orthotropic bridge decks”,<br />
Proceedings of the conference Eurosteel 1999, 411-414<br />
605<br />
©Copyright 2004 Bouwdienst Rijkswaterstaat and University of Technology Delft
Downloaded from:http//:www.ferroplan.com<br />
2004 Orthotropic Bridge Conference, Sacramento, California, USA – August 25-27, 2004<br />
Kolstein, M.H. (2000), “Laboratory tests orthotropic deck bascule bridge Van<br />
Brienenoord, Stevin Report 6-98-15<br />
Leendertz, J.S., Jong F.B.P. de (2003), “Fatigue Aspects of Orthotropic Steel Decks”,<br />
Conference Proceedings Lightweight Bridge Decks, European Bridge Engineering<br />
Conference, Paper no. 14, Rotterdam<br />
Vrouwenvelder, A., Dijkstra, O., Waarts, P., Vervuurt, A. (1998), “Basisfilosofie<br />
voor het ontwerpen van verkeersbruggen. Onderdeel Vermoeiing van rijdekken”,<br />
TNO-report 98-CON-R0455 (in dutch)<br />
Vrouwenvelder, A.C.W.M., Waarts, P.H., Wit, S. de (2000-a), “Algemene<br />
veiligheidsbeschouwing en modellering van wegverkeersbelasting voor<br />
brugconstructies”, TNO report 98-CON-R1813 (in dutch)<br />
Vrouwenvelder, A.C.W.M., Dijkstra, O.D., Foeken, R.J.van (2000-b), “Basisfilosofie<br />
voor het ontwerpen van verkeersbruggen, Onderdeel: vermoeiing stalen rijdekken,<br />
Probabilistische ontwerpfilosofie”, TNO report 1999-CON-DYN-R0108 (in dutch)<br />
606<br />
©Copyright 2004 Bouwdienst Rijkswaterstaat and University of Technology Delft
Downloaded from:http//:www.ferroplan.com<br />
2004 Orthotropic Bridge Conference, Sacramento, California, USA – August 25-27, 2004<br />
Figures<br />
Fatigue Detail B – Deck plate<br />
at intersection troughcrossbeam<br />
(DPS01)<br />
Surfacing -<br />
Deck plate<br />
Crossbeam<br />
Longitudinal girder (trough)<br />
Main girder<br />
Fatigue Detail A – Weld<br />
trough-deck plate (TRDPL01)<br />
Fixed bridges: asphalt<br />
Movable bridges: epoxyresin<br />
Figure 1. Isometric view of an orthotropic steel bridge deck with 2 fatigue cracks<br />
Aluminium profile<br />
Steel deck plate<br />
Longitudinal girder<br />
Asphaltic surfacing<br />
Bituminous interface<br />
Steel deck plate<br />
Figure 2. Example of renovation technique<br />
607<br />
©Copyright 2004 Bouwdienst Rijkswaterstaat and University of Technology Delft
Downloaded from:http//:www.ferroplan.com<br />
2004 Orthotropic Bridge Conference, Sacramento, California, USA – August 25-27, 2004<br />
Figure 3. Test panel Lintrack & Locations strain gauges<br />
Figure 4. Lintrack apparatus<br />
608<br />
©Copyright 2004 Bouwdienst Rijkswaterstaat and University of Technology Delft
Downloaded from:http//:www.ferroplan.com<br />
2004 Orthotropic Bridge Conference, Sacramento, California, USA – August 25-27, 2004<br />
Figure 5. Influence surface wheel type B for a strain gauge near location B<br />
Figure 6. Influence surface wheel type C for a strain gauge near location B<br />
609<br />
©Copyright 2004 Bouwdienst Rijkswaterstaat and University of Technology Delft
Downloaded from:http//:www.ferroplan.com<br />
2004 Orthotropic Bridge Conference, Sacramento, California, USA – August 25-27, 2004<br />
Figure 7. Test panel A<br />
Figure 8. Test panel B<br />
610<br />
©Copyright 2004 Bouwdienst Rijkswaterstaat and University of Technology Delft
Downloaded from:http//:www.ferroplan.com<br />
2004 Orthotropic Bridge Conference, Sacramento, California, USA – August 25-27, 2004<br />
Figure 9. Strain gauges deck plate trough 2 panel A<br />
611<br />
©Copyright 2004 Bouwdienst Rijkswaterstaat and University of Technology Delft
Downloaded from:http//:www.ferroplan.com<br />
2004 Orthotropic Bridge Conference, Sacramento, California, USA – August 25-27, 2004<br />
Strain over line A-A - test BA1_S8 & Analytical<br />
1200<br />
1000<br />
800<br />
600<br />
Strain *e-6<br />
400<br />
200<br />
0<br />
-250 -200 -150 -100 -50 0<br />
-200<br />
50 100 150 200 250<br />
-400<br />
-600<br />
Measurement<br />
Analytical<br />
-800<br />
width (mm)<br />
Figure 10. Strain over line A-A footprint 8 270 * 320 mm<br />
Strain over line G-G (left) - test BA1_S8 & analytical<br />
1200<br />
1000<br />
800<br />
Strain *e-6<br />
600<br />
400<br />
Measurement<br />
Analytical<br />
200<br />
0<br />
-200 -100 0 100 200 300 400<br />
length (mm)<br />
Figure 11. Strain over line G-G footprint 8 270 * 320 mm<br />
612<br />
©Copyright 2004 Bouwdienst Rijkswaterstaat and University of Technology Delft
Downloaded from:http//:www.ferroplan.com<br />
2004 Orthotropic Bridge Conference, Sacramento, California, USA – August 25-27, 2004<br />
Crack growth (d2c/dN) panel A<br />
250<br />
2c (mm)<br />
200<br />
150<br />
100<br />
50<br />
A<br />
B<br />
C<br />
D<br />
E<br />
F<br />
Function panel A<br />
Function panel B<br />
0<br />
0 500000 1000000 1500000 2000000 2500000<br />
N after first visual crack<br />
Figure 12. Crack growth panel A<br />
Crack growth (d2c/dN) panel B<br />
2c (mm)<br />
140<br />
120<br />
100<br />
80<br />
60<br />
40<br />
20<br />
0<br />
br202a<br />
br202b<br />
br203a<br />
br204a<br />
br204b<br />
br-09a<br />
br-09b<br />
br-10a<br />
br-10b<br />
br-08a<br />
Function panel B<br />
Function panel A<br />
0 100000 200000 300000 400000 500000 600000<br />
N after first visual crack<br />
Figure 13. Crack growth panel B<br />
613<br />
©Copyright 2004 Bouwdienst Rijkswaterstaat and University of Technology Delft
Downloaded from:http//:www.ferroplan.com<br />
2004 Orthotropic Bridge Conference, Sacramento, California, USA – August 25-27, 2004<br />
c<br />
c<br />
deck plate<br />
crack<br />
deck plate<br />
a<br />
crack<br />
trough inside<br />
trough outside<br />
trough wall<br />
cross- beam web<br />
trough<br />
wall<br />
cross- beam<br />
web<br />
Figure 14. Definition crack sizes<br />
log10 d2c/dN<br />
-3.50<br />
-3.70<br />
-3.80<br />
-3.90<br />
-4.00<br />
-4.10<br />
-4.20<br />
-4.30<br />
-4.40<br />
-4.50<br />
Crack growth curve<br />
-3.60<br />
2.25 2.30 2.35 2.40 2.45 2.50 2.55 2.60 2.65 2.70 2.75<br />
log10 S<br />
Measurement<br />
Analytical model based on<br />
regression analysis<br />
Figure 15. Crack growth function<br />
614<br />
©Copyright 2004 Bouwdienst Rijkswaterstaat and University of Technology Delft
Downloaded from:http//:www.ferroplan.com<br />
2004 Orthotropic Bridge Conference, Sacramento, California, USA – August 25-27, 2004<br />
2.70<br />
S-N Deck plate cracks - Reduced data<br />
Log S<br />
2.60<br />
2.50<br />
2.40<br />
2.30<br />
2.20<br />
2.10<br />
Mean l = 0 mm<br />
Mean f.v.c.<br />
Mean l = 50 mm<br />
Mean l = 100 mm<br />
Data l = 0 mm<br />
Data f.v.c.<br />
Data l = 50 mm<br />
Data l = 100 mm<br />
Design l = 0 mm<br />
Design f.v.c.<br />
Design l = 50 mm<br />
Design l = 100 mm<br />
5.00 5.20 5.40 5.60 5.80 6.00 6.20 6.40<br />
Log N<br />
Figure 16. Fatigue detail classifications<br />
(Emergency)reparation<br />
Inspection<br />
Inspection<br />
Lifetime calculation<br />
A<br />
Time based interval<br />
B<br />
New bridge deck /<br />
Renovation<br />
Figure 17. Maintenance philosophy, conventional maintenance (left red circle),<br />
risk-based maintenance (right green circle)<br />
615<br />
©Copyright 2004 Bouwdienst Rijkswaterstaat and University of Technology Delft