North-West Floods_Summary_June 2013.pdf - Food Security Clusters
North-West Floods_Summary_June 2013.pdf - Food Security Clusters
North-West Floods_Summary_June 2013.pdf - Food Security Clusters

You also want an ePaper? Increase the reach of your titles
YUMPU automatically turns print PDFs into web optimized ePapers that Google loves.
FSC follow-up assessment SUMMARY, <strong>North</strong>-<strong>West</strong> <strong>Floods</strong>, Bangladesh April 2013<br />
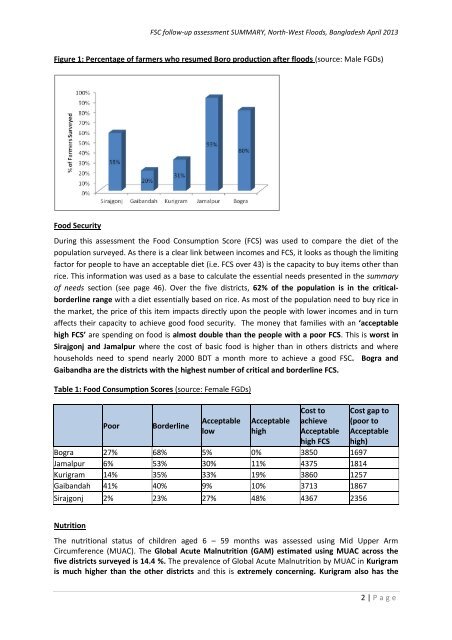
Figure 1: Percentage of farmers who resumed Boro production after floods (source: Male FGDs)<br />
<strong>Food</strong> <strong>Security</strong><br />
During this assessment the <strong>Food</strong> Consumption Score (FCS) was used to compare the diet of the<br />
population surveyed. As there is a clear link between incomes and FCS, it looks as though the limiting<br />
factor for people to have an acceptable diet (i.e. FCS over 43) is the capacity to buy items other than<br />
rice. This information was used as a base to calculate the essential needs presented in the summary<br />
of needs section (see page 46). Over the five districts, 62% of the population is in the criticalborderline<br />
range with a diet essentially based on rice. As most of the population need to buy rice in<br />
the market, the price of this item impacts directly upon the people with lower incomes and in turn<br />
affects their capacity to achieve good food security. The money that families with an ‘acceptable<br />
high FCS’ are spending on food is almost double than the people with a poor FCS. This is worst in<br />
Sirajgonj and Jamalpur where the cost of basic food is higher than in others districts and where<br />
households need to spend nearly 2000 BDT a month more to achieve a good FSC. Bogra and<br />
Gaibandha are the districts with the highest number of critical and borderline FCS.<br />
Table 1: <strong>Food</strong> Consumption Scores (source: Female FGDs)<br />
Poor<br />
Borderline<br />
Acceptable<br />
low<br />
Acceptable<br />
high<br />
Cost to<br />
achieve<br />
Acceptable<br />
high FCS<br />
Bogra 27% 68% 5% 0% 3850 1697<br />
Jamalpur 6% 53% 30% 11% 4375 1814<br />
Kurigram 14% 35% 33% 19% 3860 1257<br />
Gaibandah 41% 40% 9% 10% 3713 1867<br />
Sirajgonj 2% 23% 27% 48% 4367 2356<br />
Cost gap to<br />
(poor to<br />
Acceptable<br />
high)<br />
Nutrition<br />
The nutritional status of children aged 6 – 59 months was assessed using Mid Upper Arm<br />
Circumference (MUAC). The Global Acute Malnutrition (GAM) estimated using MUAC across the<br />
five districts surveyed is 14.4 %. The prevalence of Global Acute Malnutrition by MUAC in Kurigram<br />
is much higher than the other districts and this is extremely concerning. Kurigram also has the<br />
2 | P a g e