4.15 MB - Food Security Clusters
4.15 MB - Food Security Clusters
4.15 MB - Food Security Clusters
- No tags were found...

Create successful ePaper yourself
Turn your PDF publications into a flip-book with our unique Google optimized e-Paper software.
Front page image: Lydia Wamala/WFPACKNOWLEDGEMENTSThe Report on <strong>Food</strong> <strong>Security</strong> and Nutrition in South Sudan was prepared under the overallcoordination of Siemon Hollema and Andrew Odero (WFP). Katy Williams provided writing andediting support. Susana Moreno explored the nutrition data and tested linkages to food security.Astrid Mathiassen derived food security indicators from the household budget survey anddetermined the causal affects. Rogerio Bonifacio provided a risk analysis based on climate and weatherdata and satellite imagery. Oscar Gabatto and Esther Amler prepared the maps presented in this report.Thanks go to all that provided constructive feedback and comments or helped in other ways to preparethis document including, Christina Hobbs, Issa Sanogo, Michelle Iseminger, Anna-Leena Rasanen, YomoLawrence and John Vuga from WFP, Elijah Mukhala, Mtendere Mphatso, Zacchaeus Ndirima and MichaelOyat from FAO, and Poni Rose from <strong>Food</strong> <strong>Security</strong> Technical Secretariat.Special thanks go to the Chairperson of the South Sudan National Bureau of Statistics, H.E. Isaiah Chol,Eliaba Damundu and David Chan, in making available the data of the National Baseline Household Survey(NBHS, 2009), the second Sudan Household Health Survey (SHHS, 2010) and indicators from the fifthSudan Population and Housing Census (2008), as well as to the NBS team for assisting in the analysis ofthese data sets. We acknowledge the support of Mr. Lino Gori of the Ministry of Agriculture and Forestryand Dr. Richard Laku and Ms. Victoria Eluzai of Ministry of the Ministry of Health as well as Hon. Paul DhelGum formerly of RRC.A joint production:For questions or comments concerning any aspect of the food security and vulnerability analysis pleasecontact:WFP Country Office, South SudanAndrew Odero Head of VAM andrew.odero@wfp.orgWFP Headquarters, ItalySiemon Hollema Global Coordinator CFSVA siemon.hollema@wfp.org
KEY MESSAGES• The food security situation in South Sudan is highly precarious. The situationrequires sustained attention to not only foster longer term improvements, but tomitigate the potential for wide spread critical levels of hunger.• 60% of the South Sudanese do not consume sufficient food that provides them anutritious diet: they consume fewer than 2100 kcals per day and/or survive onfood items from fewer than four different food groups. Warrap, Lakes andNorthern Bahr al Ghazal have the highest incidence of severe food insecurity.The three Equatoria states generally fare better.• One in four children under five years old are stunted in South Sudan, one in fiveare wasted and one in three are underweight. There has been limitedimprovement in these indicators in recent years.• The highest prevalence of wasting is in Unity, where the percentage of severelywasted children has increased from 12 percent in 2006 to 13.6 percent in 2010.Lakes saw the biggest increase in the proportion of wasted children with thepercentage of severely wasted more than doubling to 8 percent.• Stagnation in agricultural growth coupled with a significant increase in thepopulation has led the 2012 cereal deficit to hit a record high of almost 475,000tonnes.• The poorest states are in the north. In Northern Bahr El Ghazal more than threequarters live in poverty while in Unity and Warrap the proportion is 68% and64% respectively. The people in these states spend on average less than SDG 1 2a day (about US$0.70) on food compared with up to SDG 3 in the relatively lesspoor states of Western Bahr El Ghazal, Western Equatoria and Central Equatoria.• Poverty and food insecurity are so pervasive that most households are unable toattain their preferred food items and a sufficient level of calorie intake. It is onlythe wealthiest 20% of the population that consume sufficient energy in ruralareas.• There is a stark contrast in food consumption between rural and urban areaswith 19% of rural households having a poor <strong>Food</strong> Consumption Score (FCS)compared with 4% percent of urban. This is similar for food diversity: 18% inurban areas compared with 58% in rural areas.1 The Survey was conducted in 2009 before the new currency was introduced.
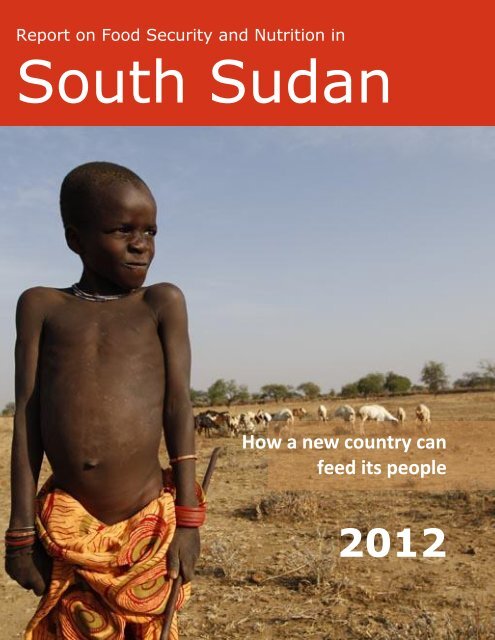
Report on <strong>Food</strong> <strong>Security</strong> and NutritioninSouth SudanHow a new country can feed its people2012
CONTENTSExecutive summaryiList of Maps .................................................................................... iiiList of Figures ................................................................................ iiiList of Tables .................................................................................. iv<strong>Food</strong> <strong>Security</strong> background ............................................................. 1Hunger in South Sudan .................................................................. 4Can South Sudan Feed Itself? ...................................................... 12Widespread poverty ...................................................................... 16An undernourished population .................................................... 26Conflict ........................................................................................... 32Natural disasters ........................................................................... 36Limited road and market infrastructure ....................................... 43How South Sudan can feed its people ......................................... 47Annex 1 – South Sudan <strong>Food</strong> <strong>Security</strong> Country Profile ............. 50ii
MAPS/TABLES/FIGURESList of MapsMap 3.1 – Poverty incidence by county ........................................................................................ 16Map 5.1 – Geographic distribution of conflict (2009-2011) .......................................................... 33Map 6.1 – Average start of growing season .................................................................................. 37Map 6.2 – Average length of the green season which determines and is similarto the agricultural growing period .............................................................................. 37Map 6.3 – Average total seasonal rainfall in South Sudan ............................................................ 38Map 6.4 – Proportion of seasonal rainfall that falls in July to September .................................... 38Map 6.5 – Coefficient of Variation of total seasonal rainfall ........................................................ 39Map 6.6 – Coefficient of Variation (CV) of the seasonal maximum NDVI ..................................... 39Map 6.7 – Flood frequency ........................................................................................................... 42Map 6.8 – Population at risk to flooding ....................................................................................... 42Map 7.1 – Road access .................................................................................................................. 44Map 7.2 – Spatial price inflation.................................................................................................... 45Map 8.1 – Relative food insecurity ................................................................................................ 48List of FiguresFigure 1.2 – <strong>Food</strong> security outcomes by state................................................................................. 6Figure 1.1 – Calorie intake and food diversity ................................................................................. 6Figure 1.3 – Child undernutrition .................................................................................................... 7Figure 1.4 – The Hunger Index by state ........................................................................................... 9Figure 1.5 – Share of calorie source by state ................................................................................ 10Figure 1.9 – <strong>Food</strong> deprivation and poverty ................................................................................... 11Figure 1.10 – Literacy and underweight ........................................................................................ 11Figure 1.11 – Malaria and child mortality ..................................................................................... 11Figure 2.1 – Cereal production and requirements ........................................................................ 12Figure 2.2 – Cereal balances .......................................................................................................... 12Figure 2.3 – Net cereal yields (traditional and mechanized) ......................................................... 13Figure 2.4 – Cereal balances by State ............................................................................................ 14Figure 2.5 – Average yields for all cereals 2001-2011 ................................................................... 15Figure 2.6 – Production and area (traditional farming) ................................................................ 15Figure 3.1 – Share of expenditure on food .................................................................................... 18Figure 3.2 – Calories per capita ..................................................................................................... 18Figure 3.3 – <strong>Food</strong> diversity (number of food groups) ................................................................... 18Figure 3.4 – Calorie intake from different food items by income percentiles,50-quantiles (rural) ................................................................................................. 19Figure 3.5 – Calorie intake from different food items by income percentiles,50-quantiles (urban) ............................................................................................... 19Figure 3.6 – <strong>Food</strong> deprivation and diversity .................................................................................. 20Figure 3.7 – Link between severe food insecurity and poverty .................................................... 20Figure 3.8 – Calories derived from different food groups ............................................................. 21Figure 3.9 – Calorie intake from staple foods ............................................................................... 21Figure 3.10 – Collection of natural resources ............................................................................... 23Figure 3.11 – Aid by state .............................................................................................................. 23Figure 3.12 – Wealth quintiles and livelihoods ............................................................................. 25iii
Figure 3.13 – Livelihoods and food consumption score ................................................................ 25Figure 4.1 – Undernutrition by age ............................................................................................... 26Figure 4.2– Diet variety ................................................................................................................. 27Figure 4.3 – State ranking according to household nutrition prevalence. .................................... 29Figure 5.1 – Seasonal variation in conflict incidents(average number in the period 2009-2011) ............................................................. 34Figure 6.1 – ITF deviation from average (May-Oct) ...................................................................... 36Figure 7.1 – Depreciation and inflation ......................................................................................... 43Figure 8.1 – Relative contribution to food insecurity for counties withrelative high levels of food insecurity .................................................................... 49List of TablesTable 1.1 – <strong>Food</strong> deprivation (consumption of fewer than ............................................................ 41717 kcal per day) ........................................................................................................................... 4Table 1.3 – poor food consumption (% of households) .................................................................. 5Table 1.2 – <strong>Food</strong> consumption ........................................................................................................ 5Table 1.4 – <strong>Food</strong> insecurity.............................................................................................................. 6Table 1.5 – Child under nutrition, 2006 and 2010........................................................................... 8Table 1.7 – Share of calories by source (%) .................................................................................. 10Table 1.8 – Poverty and calorie intake (%) .................................................................................... 10Table 2.1 – Average yields (traditional farming) ........................................................................... 13Table 3.1 – Consumption expenditure .......................................................................................... 17Table 3.2 – Expenditure share on food ......................................................................................... 17Table 3.3 – Share of income from livelihood activities ................................................................. 22Table 3.4 – Livelihood by state ...................................................................................................... 23Table 3.5 – <strong>Food</strong> aid delivery ......................................................................................................... 24Table 4.1 – Access to improved drinking water and sanitation .................................................... 28Table 4.2 – Under nutrition at individual and household level ..................................................... 29Table 4.3 – Underlying factors that correlate with child malnutrition ......................................... 31Table 8.1 – Proxies of food security indicators used for scoring ................................................... 47iv
BACKGROUND<strong>Food</strong> <strong>Security</strong> backgroundFormed from the 10 southern-moststates of former Sudan, South Sudanis a landlocked country of expansivegrassland, swamps and tropical rain foreststraddling the banks of the White Nile. Ithas an ethnically and linguistically diversepeople. It has untapped potential tobecome a major cereal producer in EasternAfrica as agricultural land is in abundance.In addition, the country has an estimated75% of all the former Sudan's oil reserves.In 2005 a Comprehensive Peace Agreement,granted South Sudan regional autonomyalong with guaranteed representation in anational power-sharing government. InJanuary 2011, South Sudan voted in areferendum to secede from Sudan entirely.In the lead-up to independence, more than300,000 south Sudanese who had beenliving in the north returned to the south, inaddition to the more than two million whohad already returned since 2005, often torural communities lacking livelihoods,infrastructure, water, schools and healthfacilities. Southerners continue to return,exacerbating competition over scarceresources.Agriculture and livelihoodsNinety percent of South Sudanesehouseholds depend on crop farming, animalhusbandry, fishing or forestry for theirlivelihoods. Productivity across all thesesectors is minimal. Agricultural yieldsremain low due to limited irrigation, scantuse of certified seeds and fertilizers, limiteduse of modern farming tools and practices,and small plots of land.Its potential is further undermined by anacute lack of economic development,unpredictable rainfall patterns that meanboth droughts and floods devastate cropsand livelihoods and human and livestockdisease epidemics. Rural infrastructureincluding roads, markets and post-harveststorage facilities are pitiful.Stagnation in agricultural growth coupledwith a significant increase in population hasled the 2012 cereal deficit to hit a recordhigh of almost 475,000 tonnes. Thepopulation has grown from 6.4 millionpeople in 2001 to 9.6 million in 2012 – duelargely to the influx of returnees andrefugees.Half the population lives on less than adollar a day. Poverty is so persistent thateven those in the comparatively wealthierquintiles cannot always afford to buyenough food and essential non-food itemssuch as clothing and shelter.InfrastructureThe road grid is severely limited. In one ofthe region’s largest countries, there areonly a handful of all-weather roads, and asingle bridge links the east and west banksof the Nile. Up to 60 percent of remotelocations are inaccessible during the mainrainy season (June-September) and alimited rail system serves only a few townsin two of the ten states of South Sudan.There is no electricity grid and nonationwide energy system. Airports arelimited and there is virtually no civil aviationcapacity.1
Although mobile telephone coverage isimproving, connectivity is already atmaximum capacity. Many areas areinsecure because they are inaccessible, andstate structures, including law enforcement,have little if any capacity to access orintervene when conflict occurs.Social EconomicSome of the worst social indicators globallyare found in South Sudan, particularlyamong women. At least 80 percent of thepopulation is income-poor, living on anequivalent of less than USD 1 per day and20 percent of households cannot supportthemselves. Less than 40 percent of thepopulation has access to any form of healthcare. While some progress has been madein the area of immunization, the proportionof fully immunized children is only 5.8percent. Half of all children do not attendschool. Eighty-five percent of the SouthSudanese population is illiterate 2 .skirmishes and restrictions on the freemovement of people and goods. In January2012, South Sudan shut down its oilproduction due to an ongoing dispute withSudan. Border disputes and otherunresolved post-secession issues remain.The food security of South Sudan remainscrippled by the previous decades of conflict,as well as ongoing violence and insecuritythat included cattle raiding feuds betweenrival ethnic groups and attacks by rebelforces opposed to the SPLM dominatedgovernment.Ongoing violence and tensionThe prolonged conflict between what isnow Sudan and South Sudan has left SouthSudanese society highly militarized,fragmented and characterized by aproliferation of arms and armed groups.Inter-community conflicts are common,resulting in large numbers of casualties andmass displacement. This disproportionatelyaffects women and impairs agriculturalactivities. On-going tensions between theRepublic of Sudan and the Republic ofSouth Sudan have resulted in border2 For more details see: National of Statistics (2012). NationalBaseline Households Survey 2009. Report for South Sudan.National Bureau of Statistics, Juba.2
Measuring<strong>Food</strong> Insecurity inSouth SudanData analysis and sources:The analysis in this report is based on two nationally representative surveys carried out by theSouth Sudan National Bureau of Statistics, namely the National Baseline Household Survey(NBHS, 2009) and the second Sudan Household Health Survey (SHHS, 2010). In addition itmakes use of the latest data available from the fifth Sudan Population and Housing Census(2008). The NBHS surveyed 5,280 households during the period April and May 2009 across all 10states of South Sudan. It provides detailed information on a range of welfare dimensionsincluding expenditure, consumption of food and non-food, asset ownership, education levels,housing conditions, and access to sanitation, water and health care.The SHHS is a stratified cluster sampling survey intended to generate children and women’shealth estimates for urban and rural settings. The total sample consists of 9369 households.Data was collected in April 2010. A food security module was added providing data on incomesources, expenditure and food consumption.Analysis was conducted using SPSS and STATA statistical software packages.3
South Sudan: How a new country can feed its peopleHunger in South Sudan1 HUNGER IN SOUTH SUDANHunger refers to the discomfort(physical and psychological) resultingfrom lack of food. In South Sudan,almost half of the population (47%) consumefewer than FAO’s minimum recommendedintake for the country of 1717 kcal per personper day to live an active and healthy life(Table 1.1). Amongst this population theaverage daily consumption is just 1318 kcalper day, some 400 kilocalories less than theminimum threshold. Consumption falls to anaverage of just 1430 kcal in Unity where 72%are food deprived.Table 1.1 – <strong>Food</strong> deprivation (consumption of fewer than1717 kcal per day)Average dailyenergyconsumption<strong>Food</strong>deprivation (%population)Average dailyenergyconsumption ofthe food deprived(kcal/p/day)South Sudan 1,890 47 1318Upper Nile 1,520 69 1189Jonglei 1,960 48 1261Unity 1,430 72 1165Warrap 1,650 63 1301Northern Bahr El 1,840 44 1375GhazalWestern Bahr El 1,440 74 1190GhazalLakes 1,830 54 1231Western2,490 23 1401EquatoriaCentral Equatoria 2,070 41 1345Eastern Equatoria 2,400 27 1338Sources: NBHS, 2009In this state, those that are food deprivedconsume an average of only 1165 kcal. InWestern Bahr El Ghazal, 74% are fooddeprived and in Upper Nile this is 69%. <strong>Food</strong>insecurity can also cause households toconsume a one-sided and unhealthy diet, sodietary diversity is anotherstrong indicator of it.Hungry people spend aHalf of the Southlarger share, if not all, ofSudanese aretheir food budget on deficient in energy,stomach-filling staples,protein andsuch as sorghum, maize essential vitaminsand millet which provideand minerals.cheap sources of calories,and they forfeit morenutritious items that provide proteins andmicro-nutrients. Therefore the less varied ahousehold’s food intake, the more likely it isto be food insecure.Dietary diversity can be captured by simplymeasuring the number of food groups (out ofseven) a households consumes over areference period of seven days. Poor fooddiversity is defined as consuming fewer thanfour food groups. Overall just over half ofhouseholds (51.3%) have poor food diversitypeaking at nearly 80% in Warrap (Table 1.2).4
South Sudan: How a new country can feed its people<strong>Food</strong> consumption can also becaptured by measuring the foodconsumption score (FCS), whichcombines food diversity, foodfrequency (the number of days eachfood group is consumed) and therelative nutritional importance ofdifferent food groups. The FCS usesstandardized thresholds thatsubsequently divide households intothree groups: poor foodconsumption, borderline foodconsumption and acceptable foodconsumption.Table 1.2 – <strong>Food</strong> consumptionPoor<strong>Food</strong> consumption scorefood diversity Poor Borderline AcceptableSouth Sudan 51.3 16.1 20.8 63.1Upper Nile 34.4 15.4 18.7 65.9Jonglei 57.1 13.9 16.8 69.3Unity 49.1 12.9 15.1 71.9Warrap 79.5 30.4 23.9 45.7Northern Bahr El Ghazal 63.6 27.4 31.6 40.9Western Bahr El Ghazal 45.5 11.6 20.4 68.0Lakes 73.2 18.7 21.8 59.5Western Equatoria 24.2 5.3 15.5 79.2Central Equatoria 35.1 8.3 13.1 78.6Eastern Equatoria 41.4 16.8 30.2 53.0Sources: NBHS, 2009 and SHHS, 2010Nationally, 37% of households have poor orborderline food consumption, i.e. theyconsume limited or insufficient nutritiousfoods to maintain an active and healthy life.Of these, 16% have a poor food consumption,mainly surviving on cereals and consuming noor very few proteins, vegetables and dairyproducts (less than once a week).More than a fifth (20.8%) have borderlinefood consumption, consuming cerealssupplemented with small and infrequentquantities of proteins, vegetables, sugar andoils. Households with an acceptable foodconsumption score (63.1%) have a morevaried food intake, however as can be seenfrom the previous section not all of thesehouseholds necessarily consume sufficientcalories.urban areas with 19% of rural householdshaving a poor FCS compared with 4% ofurban. This is similar for food diversity: 18% inurban areas compared with 58% in rural(Table 1.3).Table 1.3 – poor food consumption (% of households)Urban RuralPoor food consumption 4 19(FCS)Poor diversity 18 58Sources: NBHS, 2009 and SHHS, 2010Warrap, Northern Bahr El Ghazal and Lakeshave the highest incidence of poor foodconsumption, i.e. people have the leastvariety in their daily food intake. In Warrapalmost a third of households have a poor FCScompared with 5.3% in Western Equatoria(Table 1.2).There is also a stark contrast in poor foodconsumption prevalence between rural andPhoto: Lydia Wamala/WFP5
South Sudan: How a new country can feed its peopleA measure of food insecurityWhen households are forced tocompromises their foodconsumption, they can eitherreduce the quantity or the quality of the foodthey consumption.Figure 1.2 shows both food diversity and foodcalorie intake by state and reveals that dietarydiversity and calorie intake do not necessarilygo hand in hand (The reasons for this arefurther explored in Chapter 4), but takentogether indicate which states are consumingthe worst diets and are measures of foodinsecurity. Using these two outcomemeasures of food security, the total numberof food insecure people is approximately 60%i.e., people who consume fewer than 2100kcals per day 3 and/or survive on food itemsfrom fewer than four different food groups.People that meet both thresholds areclassified as food secure while those who areunable to meet either are classified asseverely food insecure (21%). Results by stateare presented in Figure 1.2 and Table 1.4.Warrap, Lakes and Northern Bahr al Ghazalhave the highest incidence of severe foodinsecurity. The three Equatoria states aregenerally slightly better.Figure 1.1 – Calorie intake and food diversitySource: based on calculation from NBHS 2009 dataTable 1.4 – <strong>Food</strong> insecurity<strong>Food</strong>secure<strong>Food</strong>insecureSeverelyfoodinsecureSouth Sudan 40 39 21Upper Nile 18 50 33Jonglei 19 39 41Unity 10 46 44Warrap 7 26 66Northern Bahr El Ghazal 14 36 50Western Bahr El Ghazal 13 47 41Lakes 12 35 53Western Equatoria 48 35 17Central Equatoria 33 38 29Eastern Equatoria 36 40 24Sources: NBHS, 2009Figure 1.2 – <strong>Food</strong> security outcomes by state3 Note that this threshold is different from the 1717 kcalused by FAO. The FAO cut-off cannot be applied athousehold level. 2100 kcal refers to the mean energyrequirement for light physical activity.Source: based on calculation from NBHS 2009 data6
South Sudan: How a new country can feed its peopleUndernutritionInadequate food intake–either in quantityor quality–leads to undernutrition (thoughit can also be caused by poor utilization ofnutrients because of infections or otherillnesses). Often undernutrition is caused bythe combination and interaction of these twofactors. Child undernutrition is measured bythree indicators:• Stunting: low height for one’s age• Wasting: low weight for one’s height• Underweight: low weight for one’s ageStunting reflects chronic lack of energy intake.Wasting is an acute measurement thatreflects sudden weight loss due to hunger orill health. Underweight reflects both. One infour children under the age of five aresuffering from stunting in South Sudan, one infive are wasted and one in three areunderweight.Figure 1.3 and Table 1.5 show the progress inchild global undernutrition (the percentagebelow 2 Standard Deviation (SD)) and severeundernutrition (the percentage below 3 SD)by state in South Sudan since 2006; Table 1.5shows this by state. Although the percentageof stunted and underweighted children hasfallen, acute malnutrition (wasting) hasremained constant at an extremely high levelthat affects one in five children.Figure 1.3 – Child undernutritionstuntingwastingunderweight0Child undernutrition403530252015105Source: SHHS, 2006 and 20102006 2010 2015Chapter 4 explores the reasons why childundernutrition improved in some states anddeteriorated in others. Key factors includeconflict, infectious diseases, poverty and foodinsecurity.With such high rates of severe wastingchildhood morbidity and mortality areendemic (see Table 1.6 for break-down bystate). Undernourished children have lessresistance to illnesses. The reverse also holdssince infectious diseases are often the reasonfor acute weight loss. Unfortunately statelevel data on diarrhea and pneumonia are notavailable.The highest prevalence of wasting is in Unitywhere percentage of severely wasted childrenhas deteriorated from 12% in 2006 to 13.6%in 2010. Lakes saw the biggest increase in theproportion of wasted children with thepercentage of severely wasted more thandoubling to 8%. Western and Northern Bahr ElGhazal states made the biggest progress inreducing child undernutrition with significantimprovements in all three indicators.7
South Sudan: How a new country can feed its peopleTable 1.5 – Child under nutrition, 2006 and 2010Table 1.6 – Under five mortality and morbidityMortality Morbidity(under five per 1000 births) Diarrhoea Pneumonia Fever/malaria2006 2010 % Change 2010 2010 2010South Sudan 135 105 -22.2 32.5Urban 122 33.8 18.4 30.5Rural 94 34.5 19.0 33.1Upper Nile 110 161 46.4 28.2Jonglei 108 69 -36.1 30.6Unity 82 69 -15.9 25.4Warrap 176 105 -40.3 26.6Nothern Bahr El Ghazal 165 170 3.0 29.7Western Bahr El Ghazal 134 116 -13.4 27.6Lakes 114 66 -42.1 33.2Western Equatoria 192 65 -66.1 36.0Central Equatoria 141 153 8.5 40.8Eastern Equatoria 118 198 67.8 45.2Source: SHHS, 2006 and 20108
The hunger indexThe hunger index pioneered by theInternational <strong>Food</strong> Policy ResearchInstitute combines the three aspects ofhunger mentioned above -undernourishment,underweight and mortality- into a single index(See Box 4.1). With an index of 29.3 SouthSudan is among the bottom five of the 122countries for which the hunger index wascalculated by IFPRI in 2010 4 . The hungersituation in most states (Figure 1.4) is -or isclose to- ‘extremely alarming’ with Unityscoring the worst (42.5). Even in the Equatoriastates, which fare relatively better, the hungersituation is still categorized as serious oralarming. 5Undernourishment is the main driving forcefor hunger in South Sudan. However inNorthern Bahr El Ghazal, Jonglei and Unityunderweight and mortality play a great role indefining hunger.Figure 1.4 – The Hunger Index by stateSouth Sudan: How a new country can feed its peopleBox 4.1 – Global Hunger IndexThe Global Hunger Index (GHI) is designed to comprehensivelymeasure and track hunger globally and by country and region. Itis calculated each year by the International <strong>Food</strong> Policy ResearchInstitute (IFPRI).To reflect the multidimensional nature of hunger, the GHIcombines three equally weighted indicators in one indexnumber:1. Undernourishment: the proportion of undernourished as apercentage of the population (reflecting the share of thepopulation with insufficient calorie intake);2. Child underweight: the proportion of children younger than theage of five who are underweight (low weight for age reflectingwasting, stunted growth, or both), which is one indicator ofchild undernutrition; and3. Child mortality: the mortality rate of children younger than theage of five (partially reflecting the fatal synergy of inadequatedietary intake and unhealthy environments).The GHI ranks countries on a 100-point scale. Zero is the bestscore (no hunger), and 100 is the worst, although neither ofthese extremes is reached in practice.Excerpt from www.ifpri.org (Global Hunger Index webpage)4The five countries include: South Sudan (29.3), (30.5),Chad (30.9), Eritrea (35.7), Burundi (38.3) and DR Congo(41).9
CaloriesSouth Sudan: How a new country can feed its peopleWhat is driving food insecurityin South Sudan?<strong>Food</strong> insecurity is defined by thequantity and quality of the diet that ahousehold is able to consume. In turn,this depends on the availability of differentfood items in a particular area and during acertain season, and the entitlements that ahousehold has to access these foods throughown production, market purchase orgathering. This section explores the extent towhich diet deficiencies 6 are caused byavailability or access constraints across thedifferent states.<strong>Food</strong> ProductionFigures 1.5 demonstrates the link betweenfood supply and food intake. In those stateswhere calorie intake is relatively high(Western Equatoria and Eastern Equatoria),households tend to be much more reliant ontheir own production for their overall calorieintake. The exception is Central Equatoria,where markets are the predominant sourcebecause much of the population isconcentrated in the capital Juba. Table 1.7shows that households with an average dailyper person calorie intake above 2100 kcal,typically rely more on their own production asa calorie source. The potential for boostingagricultural production will be explored indetail in Chapter 2.Wealth and <strong>Food</strong> <strong>Security</strong>However, boosting food production is not apanacea. The lack of physical and economicaccess to food also drives food insecurity.South Sudan’s market infrastructure andprices will be explored in Chapter 7.With more than half the population classifiedas poor, many simply cannot afford to buysufficient or varied food. Table 1.8 shows thatonly eight percent of the poor in South Sudanhave a calorie intake above 2100 kcalcompared with 24% of the non-poor.But poverty alone does not explaininadequate food intake (see Figure 1.9). Thereare wide discrepancies between poverty ratesand food deprivation in Upper Nile, Unity,Northern and Western Bahr el Ghazal, andWestern and Eastern Equatoria. Therelationship between poverty and foodinsecurity is further explored in Chapter 3.Figure 1.5 – Share of calorie source by state300025002000150010005000Source: based on calculation from NBHS 2009 dataTable 1.7 – Share of calories by source (%)Table 1.8 – Poverty and calorie intake (%)Poor Non-poorLess than 2100 kcal 42 26More than 2100 kcal 8 24South Sudan 50 50Sources: NBHS, 2009away from homeother sourcesown productionpurchasePurchase Own Other OutsideproductionhomeLess than 2100kcal67 20 11 2More than 2100kcal56 28 15 2South Sudan 63 22 12 2Sources: NBHS, 20096 Here a cut-off of 2100 kcal per person per day is used toapproximate the requirement at the household level. The2100 kcal threshold is an approximation of individualneeds without correcting for sex, age and bodyweight.10
Underweight (%)South Sudan: How a new country can feed its peopleFigure 1.9 – <strong>Food</strong> deprivation and povertySource: based on calculation from NBHS 2009 dataEducationEducation is a key factor in food security.Higher education can provide greateropportunity to earn income and supportsenhanced health status, hygiene practices andbasic nutrition awareness all of whichcontribute to the nutrition status ofindividuals. This is demonstrated by a positiverelationship between literacy rates andnutrition wellbeing (Figure 1.10). In Unitywhere just 3.2% of 14-24 year old women areliterate nearly half (49%) of all under-fives areunderweight. By comparison, literacy ratesrise to 27% for women of the same age inCentral Equatoria where the proportion ofunderweight children is 22%.Figure 1.10 – Literacy and underweight60.050.040.030.020.010.0UnityWarrap NBGJongleiEasternEquatoriaLakesWBGWesternEquatoriaR² = 0.5909Upper NileCentralEquatoriaSource: SHHS, 2010Illness and DiseaseFigure 1.11 demonstrates the variations bystate in incidences of fever/malaria and childmortality. While Jonglei, Lakes and WesternEquatoria have high incidences relatively fewchildren die compared with Upper Nile,Northern Bahr El Ghazal and EasternEquatoria. These issues and the linkagesbetween food security and undernutrition willbe further explored in Chapter 4.Conflict and InstabilityAnother important driver of food insecurity inSouth Sudan is the ongoing issue of conflictand instability. Border issues with Sudan(particularly the region of Abyei), intercommunalconflicts and cattle raiding lead toinsufficient investment in land andinfrastructure, destruction of crops andlivestock assets and insecurity. All of whichdirectly impact food insecurity. The impact ofconflict on food security is covered in Chapter5.Natural DisastersIn this fragile operating environment, floodsand droughts exacerbate the situation andcan have grave consequences for foodinsecurity. Seventy one percent of peopleaffected by floods or droughts in 2009consumed fewer than 2100 kcals per persondaily. Natural disasters and the consequencesfor livelihoods and food security will beexplored in Chapter 6.Figure 1.11 – Malaria and child mortality0.00 10 20 30Literacy (young women 14-24 years)Source: SHHS, 201011Source: SHHS, 2010
South Sudan: How a new country can feed its peopleCan South Sudan Feed Itself?2 CAN SOUTH SUDAN FEED ITSELF?The potential for agricultural production inSouth Sudan is huge. Half of the total 82million hectares of agricultural land issuitable for agricultural production with theremaining half composed of marginal arableland, forests and wetlands. Yet currently only4.5% of the available agricultural land is undercultivation (FAO Land Cover Database, 2010).Figure 2.1 – Cereal production and requirements12000001000000800000600000The diverse fertile soil types spread across thecountry provide options for multiple food andcash crops production such as sorghum, maize,groundnuts, cassava, rice, coffee, sugarcane,tea, palm, nuts, vegetables and fruit plants.The intricate system of rivers, streams, swampsand lakes provides an environment to exploitirrigation and fishing potential.4000002000000production (net)requirements2001 2002 2003 2004 2005 2006 2007 2008 2009 2010 2011 2012Source: FAO/WFP CFSAM 2001 – 2012Figure 2.2 – Cereal balancesProduction and shortfalls1000002001During the period 2001 to 2008, netagricultural production more thandoubled from a little above 400 000tons in 2001/02 to a million tons in 2008/09.However, in 2009/10 the country sufferedsevere drought and production declined to anestimated 700 000 tons in 2010/11. The netcereal production declined even further in2011/12 to as low as 560 000 tons (Figure 2.1).0-100000-200000-300000-400000-5000002001 2002 2003 2004 2005 2006 2007 2008 2009 2010 2011 201220022003200420052006200720082009201020112012Source: FAO/WFP CFSAM 2001 – 201212
1997199819992000200120022003200420052006200720082009201020112012ton/haSouth Sudan: How a new country can feed its peopleCereal output has not kept pace withconsumption requirements. The surge inpopulation from 6.4 million in 2001 to morethan 9.6 million in 2012, partly attributable tothe influx of returnees and refugees, hasincreased the annual cereal requirement toabout one million tons.Over the last decade, South Sudan has only producedsufficient staple foods in two years (2004/05 and2008/09) and this was thanks to favourable weatherconditions (see Chapter 6). Generally, food shortagesare becoming more acute each year, resulting in arecord high deficit of almost 475 000 tons in 2012(Figure 2.2).Figure 2.3 – Net cereal yields (traditional and mechanized)1.41.210.80.60.40.2Traditional0MechanizedA series of graphs presented in Figure 2.4 showthe cereal balances by state. Eastern Equatoria,Unity, Northern Bahr el Ghazal and Jongleiconsistently produce less than theirrequirement levels. Western Equatoria,considered as the bread basket of South Sudan,was the only surplus producing state in the lasttwo years. Central Equatoria, Warrap and Lakesstates were surplus producing areas until2009/10 but now have negative cereal balancesbecause of conflict and drought.YieldsYields are low, and the average of allcereals is generally below one ton perhectare. With limited areas irrigated,yields are weather-dependent and fluctuateaccording to good or bad rainfall years. While2008/09 registered record average yields above1.2 tons per hectare the average dropped to halfof that the following years because of theimpact of drought (Figure 2.3).In fact net yields have increased little over thepast 15 years – up from 0.69 tons per hectarebetween 1996-2000 to 0.87 tons per hectarebetween 2006-2011 (Table 2.1).Source: FAO/WFP CFSAM 2001 – 2012Table 2.1 – Average yields (traditional farming)PeriodYield1996 – 2000 0.692001 – 2005 0.792006 – 2011 0.87Source: FAO/WFP CFSAM 2001 – 2012Yields on mechanized farms, which areconcentrated in Renk in the Upper Nile state,are also very low and often below traditionalfarming practices. But mechanization does allowfarmers to bring more land under cultivation. Inthe traditional farm sector, plots are small withan average of 0.75 hectares cultivated perfarming household in 2012. Age-old farmingpractices, where plots of land are prepared byhand using rudimentary tools, limit the amountof land that a household can farm. In addition,security concerns and the risk of looting detersfarmers from investing in land preparation andseeds and restricts them to cultivating smallplots close to home (see Chapter 5 on conflict).13
South Sudan: How a new country can feed its peopleFigure 2.4 – Cereal balances by StateUpper NileJonglei20,0000-20,000-40,000-60,0002007 2008 2009 2010 2011 20120-20,000-40,000-60,000-80,000-100,0002007 2008 2009 2010 2011 2012-80,000-120,000UnityWarrap0-20,000-40,0002007 2008 2009 2010 2011 201240,00020,0000-20,0002007 2008 2009 2010 2011 2012-60,000-40,000-60,000-80,000-80,000Northern Bahr el GhazalWestern Bahr el Ghazal0-10,0002007 2008 2009 2010 2011 201215,00010,000-20,0005,000-30,000-40,0000-5,0002007 2008 2009 2010 2011 2012-50,000-10,000-60,000-15,000LakesWestern Equatoria40,000150,00020,0000-20,0002007 2008 2009 2010 2011 2012100,00050,000-40,000-60,00002007 2008 2009 2010 2011 2012Central EquatoriaEastern Equatoria50,0000-50,0002007 2008 2009 2010 2011 20120-10,000-20,000-30,000-40,0002007 2008 2009 2010 2011 2012-100,000-50,00014
1996199719981999200020012002200320042005200620072008200920102011South Sudan: How a new country can feed its peopleYields are highest in Western Equatoria, the onlystate where they have averaged more than oneton per hectare over the past decade. EasternEquatoria and Northern Bahr el Ghazal have thelowest yields, averaging about half of whatWestern Equatoria produces (Figure 2.5).As can be seen the increase in production up to2008/09 cannot be accounted for by increase inyield alone but is largely due to additonal landbeing brought under cultivation, from 658 000ha in 2001 to 921 000 ha in 2010/11 (Figure 2.6).South Sudan has an the potential to become amajor cereal producer in Eastern Africa.Agricultural land is in abundance and slightincreases in yields to above a ton per hectarecould make the country a surplus producer withample sufficiency to feed its population manytimes over.A small increase incereal yields toabove a ton perhectare couldmake the country asurplus producer.However, if this newcountry is to take fulladvantage of itsconsiderable agriculturalresource base it needs toovercome many complexobstacles that arecurrently crippling it.With more than half of the population living onless than US$1.00 a day (SDG 73 per month),persistent poverty is severely hampering thecounty’s ability to harness such opportunitiesand the nation is instead facing a severe anddeteriorating food insecurity situation.South Sudan’s potential is further underminedby the effects of decades-long north-south war,the persistent practice of cattle rustling andraiding, the current inter- and intra-communalconflicts and insecurity. In addition, SouthSudan is increasingly suffering from naturaldisasters and needs to develop strategies tocope with the devastating impacts of floods,drought and livestock disease epidemics.Figure 2.5 – Average yields for all cereals 2001-20111.41.210.80.60.40.20Source: FAO/WFP CFSAM 2001 – 2012Figure 2.6 – Production and area (traditional farming)120010008006004002000Source: FAO/WFP CFSAM 2001 – 2012Area ('000 ha)Improvements to rural infrastructure are alsorequired, including roads, markets and postharveststorage facilities. Farmer trainingschools and irrigation are urgently needed aswell as an overhaul of outdated farmingtechniques.These obstacles to obtaining food security arediscussed in detail the subsequent chapters.Net Production ('000 t)15
South Sudan: How a new country can feed its peopleWidespread poverty3 WIDESPREAD POVERTYEnsuring sufficient food supplies does notguarantee that everyone can afford toaccess it. For instance, Western Equatoriaproduces a surplus of maize and sorghum, buthunger still affects 23% of the population(measured in terms of deficient calorie intake –see Table 1.1).To ensure food security for all, the ability ofhouseholds to buy sufficient food to meet theirown production gaps needs to be supported byincreasing incomes and purchasing power,securing livelihoods, improving markets andaccess to them and stimulating choice.Poverty in South Sudan is persistent (Map 3.1).Consequently even those in the wealthierquintiles cannot always afford to buy food thatis sufficiently varied or calorific for an active andhealthy life.Map 3.1 – Poverty incidence by countySource: NBHS, 200916
South Sudan: How a new country can feed its peoplePoverty and consumptionEvery other person in South Sudan is poor,50.6% of the population lives below thenational poverty line of SDG 73 permonth which equates to approximately US$1.00per person per day using current exchangerates 7 .This means that more than half the populationlacks the necessary means to acquire sufficientfood, essential clothing, health care and shelter.Poor households face stark choices from oneday to the next as they are continuallycompelled to make compromises in how theyspend their limited available money.Poor householdsface an averageshortfall of SDG 34per person permonth to meet theirminimum food andnon-food needs.(NBHS, 2009)Households’ totalexpenditure averagesSDG 100 (US$37) perperson per monthranging from a low ofSDG 60 in NorthernBahr El Ghazal to SDG144 in Upper Nile(Table 3.1). A poorhousehold spends on average only SDG 39 perperson per month, a shortfall of SDG 34 permonth needed to meet minimum food and nonfoodrequirements. On average 79% of the totalhousehold expenditure goes on food, a sharethat rises marginally to 81% for rural areas anddrops to 69% for urban areas (Table 3.2).The poorest states are in the north. In NorthernBahr El Ghazal more than three quarters live inpoverty while in Unity and Warrap theproportion is 68% and 64% respectively. Thesestates spend less than SDG 2 a day (aboutUS$0.70) on food compared with up to SDG 3 inthe relatively less poor states of Western Bahr ElGhazal, Western Equatoria and CentralEquatoria, where still over 40% live in poverty(Map 3.1). The Upper Nile stands out with arelatively lower poverty incidence of 25.7%.Table 3.1 – Consumption expenditureConsumption per personper month (SDG)Total <strong>Food</strong> Non-foodSouth Sudan 100 79 21Urban 168 109 59Rural 88 73 15Upper Nile 144 102 42Jonglei 98 88 10Unity 72 55 17Warrap 67 58 9Northern Bahr El Ghazal 60 49 11Western Bahr El Ghazal 114 90 24Lakes 110 92 18Western Equatoria 104 86 18Central Equatoria 127 80 47Eastern Equatoria 103 86 17Source: NBHS, 2009Table 3.2 – Expenditure share on foodPercentage of expenditure onfoodAll Non-poor PoorSouth Sudan 79 80 79Urban 69 68 73Rural 81 84 79Upper Nile 73 72 76Jonglei 86 91 81Unity 80 78 82Warrap 83 88 80Northern Bahr El 85 83 86GhazalWestern Bahr El Ghazal 82 81 83Lakes 80 84 75Western Equatoria 82 83 79Central Equatoria 64 67 61Eastern Equatoria 84 85 84Source: NBHS, 2009While the per capita share of expenditure onfood falls markedly with each wealth quintile inurban areas, there’s a significant increase in theproportion spent on food between the first andsecond quintile in rural areas (Figure 3.1). Thereare a couple of likely explanations for this.Firstly, with low market penetration in ruralareas, non-food items and services are in limitedsupply or simply not available, so any additionalincome is generally spent on food.7 June 201217
South Sudan: How a new country can feed its peopleSecondly, with consumption expenditureroughly a quarter of that of the non-poor, thepoor cannot buy the amount of food they needand probably would buy if they had the moneyto do so. When money becomes slightly lesstight they spend it on additional food andgreater variety. Figures 3.2 and 3.3 show thatthe poor have a significantly lower calorie intakeand less varied diet, consisting mainly of staples(see also Figure 3.4 and 3.5 on next page).Calorie intake and variety increases with eachwealth group.Even so, poverty is so severe that manyhouseholds in even the higher wealth quintiles(3 and 4) are unable to attain their preferredfood items and calorie intake (indicating thatthe national poverty line, which is based on anaverage consumption basket of the poorest 60%of the population, is perhaps set too low). In factit is only the wealthiest 20% of the population(5 th quintile) that are consuming on averagemore than 2100 kcals a day in rural areas.Across states, poverty, food deprivation (lack ofcalorie intake) and lack of diversity (number offood groups consumed) do not always go handin hand. The scattergram (Fig. 3.6) shows ageneral linear relationship across statesbetween food deprivation and diversity, exceptin Western Bahr el Ghazal and Upper Nile. Thesestates have the highest levels of fooddeprivation (in terms of percentage of thepopulation being food energy deficient) but theyare not so lacking in food diversity. These twostates also have relatively lower levels ofpoverty.Figure 3.1 – Share of expenditure on food0.900.850.80Source: Calculated based on data from NBHS, 20090.750.700.650.60Urban0.55Rural0.501 quintile 2 quintile 3 quintile 4 quintile 5 quintileSource: NBHS, 2009Figure 3.2 – Calories per capita3500Urban3000Rural2500Source: Calculated based on data from NBHS, 200920001500100050001 quintile 2 quintile 3 quintile 4 quintile 5 quintileSource: NBHS, 2009Figure 3.3 – <strong>Food</strong> diversity (number of food groups)7.00Urban6.00Rural5.004.003.002.001.00-1 quintile 2 quintile 3 quintile 4 quintile 5 quintileSource: NBHS, 200918
CaloriesCaloriesSouth Sudan: How a new country can feed its peopleFigure 3.4 – Calorie intake from different food items by income percentiles, 50-quantiles (rural)400035003000drinksoil2500200015001000500milkmeat fish eggfruitsvegetablespulses nutssugarstaplesSource: NBHS, 200901 3 5 7 9 11 13 15 17 19 21 23 25 27 29 31 33 35 37 39 41 43 45 47Figure 3.5 – Calorie intake from different food items by income percentiles, 50-quantiles (urban)4000350030002500200015001000drinksoilmilkmeat fish eggfruitsvegetablespulses nutssugarstaples5000Source: NBHS, 20091 3 5 7 9 11 13 15 17 19 21 23 25 27 29 31 33 35 37 39 41 43 45 4719
Severely food insecureDiversity deprivationSouth Sudan: How a new country can feed its peopleThis can be explained by the fact that peopletend to consume relative fewer staples withcalories derived from more expensive fooditems such oil, meat and fish. Further analysisshows that people in Upper Nile tend to eatmore expensive staples such as bread (seeFigures 3.8 and 3.9).In Warrap, Northern Bahr el Ghazal, Lakes andUnity high levels of poverty most gravely reflecta serious food security crisis shown by acombination of low energy intake and poordiversity (See Figure 3.7 which plots the povertyagainst the incidence of severely food insecureas defined in Chapter 1, at individual and statelevel).Figure 3.6 – <strong>Food</strong> deprivation and diversity9080706050403020100UnityNBGEasternEquatoriaWesternEquatoriaSource: based on data from NBHS, 2009WarrapLakesJongleiCentralEquatoriaWBGUpper Nile0 20 40 60 80<strong>Food</strong> deprivationIn states with higher than average energyconsumption, people tend to rely on morethan one major staple. For example in Jonglei,Lakes and Eastern Equatoria maize and dura(sorghum) are staples while in WesternEquatoria cassava is widely consumedalongside dura and maize. The exception isNorthern Bahr el Ghazal where dura makes up90% of the cereal food intake (Figure 3.9).Figure 3.7 – Link between severe food insecurity and poverty70Warrap60NBGLakes50WBG Jonglei Unity40302010Upper NileCentralEquatoria EasternEquatoriaWesternEquatoria00 20 40 60 80PovertySource: based on data from NBHS, 200920
CaloriesCaloriesSouth Sudan: How a new country can feed its peopleFigure 3.8 – Calories derived from different food groups25002000150010005000oilmeat fish eggspulsessugarstaplesSource: based on data from NBHS, 2009Figure 3.9 – Calorie intake from staple foods180016001400120010008006004002000Other CerealBreadCassavaMaizeDuraSource: based on data from NBHS, 200921
South Sudan: How a new country can feed its peopleLivelihoodsTo ensure food security for all in SouthSudan, consumer demand needs to becreated by making livelihoods moresecure thereby increasing incomes andpurchasing power.Agriculture is the most common livelihood withnearly a fifth of the population dependent on itfor more than 50% of their income. In WesternEquatoria, Lakes, Jonglei and Upper Nileagriculture is the principal livelihood for roughlya quarter of the population. Pastoralism, thethird most practiced livelihood overall, is mostcommon in Eastern Equatoria, Lakes andWarrap (Annex 1).Almost 19% of households rely on the collectionand sale of natural resources (charcoal making,collecting of fire wood, grass, water, wild foodsetc.) for the major part of their householdincome. Such practices, which are traditionallyused only in times of distress to complementfarming and livestock rearing, are notsustainable in the long-term and contributedirectly to environmental degradation.Box 3.1 Livelihood clusteringUsing data on share of income generated from thedifferent activities members of a householdundertake, eight principle livelihood strategieswere derived using a cluster analysis based on theSHHS data.Table 3.3 defines these livelihood groups andpresents the average share of income derivedfrom different activities. For example, a householdwith a livelihood based on agriculture (i.e. morethan 50% of its income) derives on average 72%of its income from this activity, 9% from thecollection and sale of natural resources, 5% fromlivestock farming, 5% from alcohol sales etc. Otherlivelihoods are defined in similar ways.The NBHS data differs from SHHS data. It uses adifferent livelihood classification and is based onhouseholds reporting of their main livelihoodinstead of the percentage of income share derivedfrom these activities. In this section SHHS data isused. The food security profiles in Annex I includesNBHS derived livelihoods and their relationship tofood security indicators.Table 3.3 – Share of income from livelihood activitiesAgricultureCollectionof naturalresources Pastoralism SalariesSale ofalcoholCasuallabourTradeAid, giftsandremittancesAgriculture 72.1 5.8 6.8 2.2 6.5 4.4 1.9 6.8Collection ofnaturalresources9.3 77.6 8.7 2.1 8.9 7.2 2.5 9.5Pastoralism 4.7 3.4 70.0 0.8 2.1 2.2 0.8 4.0Salaries 1.4 1.3 1.3 85.7 2.5 2.2 1.6 2.8Sale of alcohol 4.9 4.2 6.8 3.3 71.2 3.5 2.6 5.8Casual labour 3.3 3.1 2.1 1.7 3.6 76.0 2.0 3.9Trade 2.1 2.6 2.1 3.0 2.8 2.5 86.9 3.1Aid, gifts andremittances% ofhouseholdsSource: SHHS, 20102.2 1.9 2.2 1.2 2.5 1.9 1.7 64.219.7 18.7 14.9 11.2 11.0 10.1 8.0 6.322
South Sudan: How a new country can feed its peopleTable 3.4 – Livelihood by stateAgricultureCollectionof naturalresources Pastoralism SalariesSale ofalcoholCasuallabourTradeAid, giftsandremittancesUpper Nile 25.2% 14.0% 9.8% 19.1% 2.5% 17.5% 6.9% 5.0%Jonglei 26.1% 21.2% 16.7% 5.4% 7.1% 3.8% 4.5% 15.2%Unity 19.1% 30.2% 18.7% 6.4% 8.5% 5.9% 8.1% 3.1%Warrap 18.9% 10.3% 25.6% 7.0% 15.4% 4.0% 11.8% 7.0%Northern Bahr El Ghazal 19.4% 23.2% 13.1% 6.4% 12.4% 12.5% 5.7% 7.4%Western Bahr El Ghazal 10.6% 33.7% 2.1% 15.8% 8.5% 12.9% 9.3% 7.1%Lakes 23.3% 5.7% 29.1% 13.0% 9.9% 10.1% 3.9% 4.9%Western Equatoria 29.7% 15.7% 3.2% 9.1% 19.8% 10.2% 7.9% 4.4%Central Equatoria 12.7% 15.8% 6.8% 22.8% 5.6% 16.2% 15.4% 4.6%Eastern Equatoria 12.3% 18.5% 25.4% 6.5% 19.6% 7.4% 6.3% 4.0%South Sudan 19.7% 18.7% 14.9% 11.2% 11.0% 10.1% 8.0% 6.3%Source: SHHS, 2010Figure 3.10 – Collection of natural resources2006 201032.4%32.6%20.1%9.0% 8.8%14.7%1.8%12.0%7.8%12.5%24.3%11.0%6.9%5.0%21.4%15.7% 15.2%9.6%21.9%19.5% 19.2%11.6%Jonglei Upper Nile Unity Warrap NorthernBahr ElGazalWesternBahr ElGazalLakesWesternEquatoriaCentralEquatoriaEasternEquatoriaSouth SudanFigure 3.11 – Aid by State2006 201029.6%9.4%13.2%8.5% 7.9%6.6%3.0% 2.3%16.0%5.3% 5.1% 6.1%20.0%9.6%8.6% 9.1%3.9% 3.1% 4.1% 3.3%11.2%4.7%Jonglei Upper Nile Unity Warrap NorthernBahr ElGazalWesternBahr ElGazalLakesWesternEquatoriaCentralEquatoriaEasternEquatoriaSouth SudanSource: SHHS, 201023
South Sudan: How a new country can feed its peopleBut the percentage deriving more than 50% oftheir income from natural resources has jumpedfrom 12% in 2006 to 19% in 2011 (Figure 3.10).The proportion is especially high in the poorestand conflict affected states such as Jonglei,Unity and Northern and Western Bahr El Ghazalwhere up to a third of the population isdependent on this method (Table 3.4).The increasing use of these unsustainableincome-generating activities could furtherjeopardize household food security in the longtermby damaging the country’s naturalresources and undermining the sustainablelivelihood system in many areas.In contrast with the increasing use ofunsustainable livelihood practices, external aidas a dominant income source for householdshas fallen by more than half, from 11% in 2006to 5% in 2010 (Figure 3.11). The state of Jongleiremains the main recipient of aid with 15% ofhouseholds deriving (on average) 64% of theirincome from aid and gifts (Table 3.3 and Table3.4). Table 3.5 gives further insight on deliveryof food aid according to NBHS data.Table 3.5 – <strong>Food</strong> aid deliveryReceivedcash/goodsfrom foodaid programsSouthern Sudan 3.8Place ofUrban 4.1residenceRural 3.8Sex of household Male 3.5headFemale 4.5Quintiles of monthlyper capita expenditure1 1.72 3.23 4.24 4.75 4.8Poor Non poor 4.9Poor 2.6Source: NBHS, 2009points out that the better off are more likely toreceive food assistance as compared to thepoorest and most vulnerable.Using a wealth index as defined by the SHHSsurvey, households living in extreme poverty (asdefined by the lowest wealth quintile) can befound in each livelihood group. However, asubstantially higher percentage of extreme poorhouseholds can be found among pastoralistswith 40% identified as extremely poor. Around afifth of agriculturalists and those relying on thesale of natural resources, aid, gifts andremittances and alcohol sales live in extremepoverty (Figure 3.12). In contrast, more thanhalf of those dependent on salaries are in thehighest wealth quintile.In terms of food insecurity, Figure 3.13 showsthat pastoralist have the highest incidence ofpoor food consumption.Targeted programmes to alleviate poverty andsupport sustainable livelihoods may enable thepoorest (e.g. pastoralists, widows, andreturnees) to buy a greater variety and volumeof food.It is clear that poverty reduction is no cure-allfor hunger in a country as complex as SouthSudan, but must go hand-in-hand with, forexample, disaster preparedness, conflictresolution, female education programmes andimprovements in crop yields. These issues willbe further analyzed in the next chapters.The percentage of food aid receiving householdsin South Sudan is almost 4%. 8 The data however,8 WFP’s coverage peaks in June-July during the lean season,so the percentage is likely to be higher as this data wascollected in April-May 2009.24
Figure 3.12 – Wealth quintiles and livelihoodsSalaries4.8%9.6%10.1%25.1%50.3%Casual labour13.3%17.1%19.4%25.9%24.2%Petty trade15.8%19.6%20.1%20.2%24.3%Aid, gifts, remittances18.3%25.1%22.7%20.7%13.2%Agriculture18.8%23.7%23.7%24.7%9.1%Collection of natural resources18.9%26.8%24.9%21.4%8.0%Alcohol sales20.0%19.4%24.0%25.4%11.3%Pastoralism39.1%26.9%18.4%12.1%3.5%0% 10% 20% 30% 40% 50% 60% 70% 80% 90% 100%Poorest Second Middle Fourth RichestSource: SHHS, 2010Figure 3.13 – Livelihoods and food consumption scoresalaries8.3%13.7%78.0%casual labourers13.2%19.6%67.2%aid, gifts, remittances16.3%24.3%59.4%alcohol sales16.4%23.5%60.2%agriculturist17.3%20.5%62.2%collection of natural resources17.4%24.0%58.6%petty traders17.7%20.4%61.9%pastoralists19.2%20.6%60.2%0% 10% 20% 30% 40% 50% 60% 70% 80% 90% 100%Poor Consumption Borderline AcceptableSource: SHHS, 201025
South Sudan: How a new country can feed its peopleAn undernourished population4 AN UNDERNOURISHED POPULATIONSouth Sudan needs to improve theavailability of food and household accessto food, but also needs to concentrate onensuring that households are consuming theright food and that people are able to utilize thefood they are consuming. A diverse diet isrequired providing all essential macro andmicro-nutrients. Health care needs to be readilyaccessible and hygiene practices adequate.Care-givers need to be educated about feeding,nutrition and caring practices to ensure they aregiving their children the best start in life.Figure 4.1 – Undernutrition by age40.035.030.025.020.015.010.05.0UnderweightStuntingWastingFigure 4.1 provides an indication of childundernutrition by age group, however thesefigures should be considered with caution (asdiscussed below). The critical period is the firstthousand days of a child’s life. During this periodstunting rates more than triples. When deprivedof nutritious food in the first 1000 days, a child’sphysical development is impaired. And he or shematures into an adult who is less likely to reachhis or her potential and is more prone todisease. This adult will be less productive with afar greater likelihood and therefore greaterchance of being stuck in poverty, therebyperpetuating the cycle of food insecurity andmalnutrition..00-5 6-11 12-23 24-35 36-47 48-59AgeSource: SHHS, 2010The fact that a quarter of the children in SouthSudan are stunted in their growth exemplifies26
South Sudan: How a new country can feed its peoplethe far reaching consequences of chronic foodinsecurity.The statistics for factors underlying nutrition inSouth Sudan are not encouraging. Diet variety islow and an astonishingly large share of thepopulation do not regularly consume fruits andvegetables (35%), sources of protein such asmeat, eggs, fish, milk, pulses and nuts (14%) andoils and fats (36%).The worst performing statesinclude Warrap, NBS, Lakes and Jonglei (Figure4.2).SHHS data shows that 46 percent of childrenbetween the age of 12 and 23 months havenever been vaccinated against any childhooddiseases. More than a third of children sufferfrom diarrhoea with little variation across statesand wealth groups. In addition, in South Sudan acommon ‘treatment’ for a diarrhoea episode isgiving the child less fluids, which has lifethreateningconsequences. Only about half aretreated with ORS 9 or increased fluid intake.More than a third of children suffer frommalaria or high fever and only about half ofhouseholds possess a mosquito net.Almost one third of the population in SouthSudan does not have access to improved watersources. The most important improved sourcefor drinking water is the water pump (49%). Inthe Upper Nile filtered water provides drinkingwater to about one fifth of households. Pipedwater or public taps are only used by 9 percentof households. Although the majority of thepopulation may get their drinking water fromimproved sources this does not mean that thewater is safe to drink. The water is seldom ornot at all treated by households. Only 11percent of households apply some form ofwater treatment, either by adding bleach orchlorine (7%), filtering (3%) or boiling (1%). It israre for households to have direct access to9 oral rehydration solutiondrinking water on their premises. More than 95percent do not treat their drinking water and ifthey do they are almost all located in urbancenters. It is the adult women whose task it is tocollect drinking water and for one third ofFigure 4.2– Diet varietySouth SudanWesternEquatoriaCentral EquatoriaEastern EquatoriaWestern Bahr ElGhazalUnityUpper NileJongleiLakesNorthern Bahr ElGhazalWarrapSource: NBHS, 2009Oils & Fats0.0% 20.0% 40.0% 60.0% 80.0%households the water source is more than 30minutes away.Vegetables & FruitsProtein sourcesCerealsAccess to adequate sanitation is limited. Only7.4 percent have access to improved facilities. Inrural areas this is less than 5 percent. Opendefecation is the most common practice withalmost three quarters of the populationpracticing this. Open defection, especially whennear habitats, poses serious health threats andas a consequence affects nutrition outcomes.Less than 6 percent of household benefit fromboth improved sources of drinking water andsanitation. Most are in Western Equatoria (Table4.1).27
South Sudan: How a new country can feed its peopleTable 4.1 – Access to improved drinking water and sanitationPercentage of households using:Sources of drinking waterSanitation facilitiesImproveddrinking watersources andImproved Unimproved ImprovedUnimprovedfacilitiesOpendefecationimprovedsanitationSouth Sudan 68.7 31.3 7.4 28.5 64.1 5.6Upper Nile 61.8 38.2 7.8 20.6 71.5 7.2Jonglei 77.8 22.2 6.2 23.1 70.7 5.8Unity 62.7 37.3 9.8 18.9 71.3 7.0Warrap 60.7 39.3 1.0 23.1 75.9 1.0Northern Bahr El Ghazal 68.9 31.1 1.5 26.1 72.4 1.3Western Bahr El Ghazal 52.2 47.8 9.6 22.6 67.8 7.0Lakes 92.0 8.0 4.0 35.2 60.8 3.8Western Equatoria 61.3 38.7 22.5 62.1 15.3 12.6Central Equatoria 58.8 41.2 12.7 38.1 49.2 8.2Eastern Equatoria 83.9 16.1 4.5 20.8 74.7 4.3Source: SHHS, 2010There is little knowledge among the populationregarding appropriate feeding practices of babiesand infants. Only 45 percent of infants less than 5months of age are exclusively breastfed. From 6months to 23 months, only 26 percent receive breastmilk supplemented by solid or semi-solid foods. Thepercentage of infants appropriately breastfed isabout 30 percent with little difference between girlsand boys.These underlying factors explain the high level ofunder nutrition in South Sudan. Table 4.2 comparesthe likelihood that an individual is malnourished vs.the likelihood that a household has a malnourishedchild. The prevalence at household level is lowerthan the individual prevalence because householdsmay have more than one child under the age of fiveand they are more likely to be malnourished if theirsibling is also malnourished as they are exposed tosimilar conditions. In states with a higher number ofchildren per household there is subsequently agreater disparity between household and individualmalnutrition prevalence as the risk of malnutrition ishigher in households having more children under theage of five.28
South Sudan: How a new country can feed its peopleTable 4.2 – Under nutrition at individual and household levelStuntingHAZ < -2SDIndividual(%)Household(%)WastingWHZ < - 2SDIndividual(%)Household(%)UnderweightWAZ < - 2SDIndividual(%)Household(%)South Sudan 25.0 16.9 20.9 12.0 30.3 14.3Upper Nile 27.1 16.0 21.5 11.8 24.2 13.1Jonglei 27.8 15.9 31.2 17.5 29.3 14.8Unity 40.4 18.2 35.4 14.7 46.1 19.0Warrap 29.4 15.7 31.9 14.0 35.0 16.8Northern Bahr El Ghazal 27.6 20.1 26.7 19.4 29.7 22.5Western Bahr El Ghazal 26.9 16.8 16.4 9.8 22.3 13.3Lakes 35.4 18.8 27.9 12.3 29.9 13.9Western Equatoria 34.5 17.3 11.8 6.3 18.2 9.1Central Equatoria 31.1 12.1 11.0 4.9 17.0 6.7Eastern Equatoria 37.2 20.7 11.8 6.3 29.2 15.8Source: SHHS, 2010Figures of malnutrition need to be considered withcaution. Analyzing malnutrition in South Sudan isfraught with difficulty. The prevalence ofmalnutrition varies widely according to theindicator used (MUAC, weight/height etc.) andbecause there is such a wide range of bodytypes/shapes across the ethnic groups. For example,pastoralists, characterized by longer legs, tend tohave higher wasting prevalence (lower weight forheight) than stockier farmers.Figure 4.3 – State ranking according to householdnutrition prevalence.Northern Bahr El GhazalUnityJongleiWarrapLakesWhat’s more, many of the individual measurementstaken were flagged using WHO criteria as beingimplausible 10 . This raises questions about thereliability of the nutrition estimates. Householdprevalence of malnutrition is perhaps a more reliableindicator of the nutritional status across the country,but even these estimates need to be viewed withcaution. Figure 4.3 ranks the states according tohousehold nutrition prevalence.Eastern EquatoriaUpper NileWestern Bahr El GhazalWestern EquatoriaCentral EquatoriaSouth SudanSource: SHHS, 2010StuntingWastingUnderweight0 10 20 30 40 50 60 7010 For example in the states of Unity, Warrap and Lakes more than40% of individual measurements taken were flagged.29
South Sudan: How a new country can feed its peopleWhat causes malnutrition in SouthSudan?In states where the underlying factors thatdetermine the nutrition outcome, i.e. foodinsecurity, caring and feeding practices and diseasesare worst, under nutrition of children is at its worse.But it is generally extremely difficult to pinpointmalnutrition on any specific factor or factors. Forexample malnutrition does not always go hand inhand with food insecurity or poor food consumption,which is the case in Unity state where dietarydiversity is not so poor as in other states, butmalnutrition is high (calorie consumption is low asare literacy rates and caring practices and childfeeding practices are generally poorer than average).Malnutrition is caused by an interplay of multiplecauses and this varies from state to state.Take Lakes state as an example. It has seen thesteepest downward spiral in childhood wasting andunderweight prevalence since 2006. Wasting is up bysome 43% to 19% while the proportion with severewasting has more than doubled to 8%. Similarly theproportion of underweight under-fives has leapt by47% to 28% and there’s been a 77% rise in severeunderweight prevalence. It is impossible to pin downthis change to one factor: more likely the factors arenumerous, complex and interlinked.One explanation is that the state has become adeficit area because of the escalation in intercommunalfighting (the links between conflict andfood insecurity are explored in the next chapter).Households spend very little on healthcare and ahigher than average number fail to vaccinate,provide pneumonia treatment, give vitamin Asupplementation, treat diarrhea with ORS or arecommended fluid, while care practices such asbreastfeeding, antenatal care for women andproviding the minimum number of meals forchildren are all too often below par. Thedependency ratio is the highest after NorthernBahr el Ghazal.It is the state with the highest proportion ofhouseholds dependent on risky sources of incomesuch as selling alcohol and livestock, which correlatewith malnutrition. Lakes households spend a veryhigh proportion of their expenditure on food,especially cereals, so a way to cope with food pricehikes may be to cut spending on vegetables, fruit, oiland protein (dietary diversity is lowest afterWarrap). All these factors correlate strongly withchildhood malnutrition.Western and Central Equatoria have the lowestprevalence of malnutrition in the country, but thepercentage of wasted children has risen dramaticallysince 2006 in both states. In Central Equatoria severewasting has increased by 152% and is now 3.5%while severe underweight has increased by 67% to9%. Fever/malaria, which is very high in CentralEquatoria (41%), is the most likely cause. The statealso has the second highest incidence of diarrhea.Mortality rates have risen by 8.5% since 2006.Meanwhile Eastern Equatoria has seen a muchbigger increase in child mortality (up 68% to 198 in1000, making it the worst in the country) withfever/malaria cases the highest in the country at45% and suspected pneumonia the second highest.The fact that malnutrition has not worsened (thoughremains worse than the other two Equatoria states)implies a situation where factors increasingmalnutrition in Western and Central Equatoria maybe causing infant deaths in Eastern Equatoria.What may explain this? Again, an interplay of manyfactors. Here health expenditure is the lowest of allstates despite the high morbidity prevalence. <strong>Food</strong>access and security is among the lowest. It is one ofthe poorest states with low per capita expenditure,high percentage of overall expenditure on food, verylow consumption of protein and high dependency onrisky sources of income (alcohol and livestock sales).Table 4.3 presents the factors that have a significantimpact on the likelihood of a household having amalnourished child.30
South Sudan: How a new country can feed its peopleTable 4.3 – Underlying factors that correlate with child malnutritionUnderlying factorHouseholds with malnourishedchildren:Number of dependent Tend to be more crowded - with more women and under fiveshousehold members Have significantly fewer men aged between 15 and 49 years oldPoverty Have poor wealth index scoresStatus of head ofhousehold Are more likely to be headed by someone who never attended school or doesn’tknow how to read or write. The young mothers are less likely to be literate Are more likely to be headed by a womanSources of food Are more likely to source their food from hunting and gathering, fishing orborrowing<strong>Food</strong> insecurity Are more likely to be classified as food insecure or severely food insecureLivelihoods Are more likely to have risky sources of income such as selling grass, livestock,livestock products and alcoholPer capita expenditure Have lower per capita expenditure Spend a higher share on cereals (more than half their food expenditure)Feeding practices andsupplements Are less likely to provide children with the minimum number of daily meals (theaverage is just 9.5% of households in rural South Sudan but even less in Warrap,Northern Bahr El Ghazal, Unity, Lakes Are less likely to have supplied 6-23 month old breast-fed children withappropriate or any complementary feeding (Northern Bahr El Ghazal, Upper Nile,Lakes, Jonglei, Warrap, Unity) Are less likely to have breast-fed up to two years (Northern Bahr El Ghazal, UpperNile, Lakes, Jonglei, Warrap, Unity) Are less likely to have given children vitamin A supplementation in the last sixmonths (Only 10% give vitamin A supplement in rural South Sudan. It’s even less inWarrap, Northern Bahr El Ghazal, Lakes, Jonglei)<strong>Food</strong> consumption Eat less cassava, fresh vegetables, fruits and groundnuts/ pulsesVaccination Are less likely to have vaccinated 12-23 month old children against childhooddiseases (Warrap, Northern Bahr El Ghazal, Unity, Lakes, Jonglei) Mothers are less likely to have been vaccinated against tetanus during their lastpregnancy (Warrap, Jonglei, Unity Northern Bahr El Ghazal, Upper Nile, Lakes)Care practices Mothers are less likely to have received antenatal care (Warrap, Jonglei, Unity)Are less likely to treat diarrhoea with ORS or recommended fluid (Lakes, Warrap,Unity, Northern Bahr El Ghazal, Jonglei)Are less likely to have had treatment for malaria or antibiotics for suspectedpneumonia (Warrap, Northern Bahr El Ghazal, Unity)Household with wasted children are less likely to have mosquito nets (Warrap,Unity, Jonglei) and take malarial drugs on the same or next day (Warrap, Lakes,Northern Bahr El Ghazal, Jonglei, Unity)31
South Sudan: How a new country can feed its peopleConflict5 CONFLICTThe two North-South civil wars, whichdirectly and indirectly caused over 2.5million (mainly civilian) deaths over abouthalf a century of fighting, have posed thegravest threat to food security and livelihoods.The war represents Africa’s longest running civilwar, and flooded the country with land mines,illegal weapons and stripped it of itsdevelopment potential by destroying livelihoodassets, institutions (physical, social and financial)and governance systems.In a country so scarred by war,civil insecurity is rife. Armedcattle rustling, border disputeswith Sudan, inter and intracommunalconflict and militiaattacks continue to hamper thecountry’s production capacity,severely limiting the potentialexpansion of cropped areas inmany parts of the country, aswell as hindering access tomarkets for farming inputs and food and tohealth centres and schools.It’s difficult to disentangle the causes from theeffects of violence. While conflict is oftencaused by under-development it can also be aconsequence of it, especially in situations whenconflicts are resource/livelihood-based. Forinstance, limited access to grazing and waterresources in pastoral areas leads to clustering oflivestock in small areas, increasing the risk oftransmission of livestock diseases and puttingpressure on grazing and water resources,meaning animals are less likely to thrive.Conflict may cause scarcity of grazing and waterbecause herdsmen/pastoralists do not want tostray far from a limited ‘safe’ area - or thescarcity may contribute towards conflict.Refugees and returneesThe large number of refugees created byconflict, and post conflict returnees, putgreat strain on the food supplies andresources of their hosts, and riskprompting further unrest/violence. As ofNovember 2011, South Sudan hadreceived about 841 thousand returneesfollowing the referendum and subsequentdeclaration of independence in July 2011.In 2012 the arrival of an additional half amillion people is expected. All needfeeding, shelter, jobs and security. A WFPfood security assessment in February 2011found very high levels of food insecurityamong returnees and a shift in theirpredominant livelihood from wage-basedto dependence on collection of naturalresources.32
South Sudan: How a new country can feed its peopleEffects of conflictConflict disrupts all aspects of the ruraleconomy and affects everyone,irrespective of their socio-economicstatus. Its multi-dimensional effect onlivelihoods and food security cannot be overemphasized:• People displaced to other areas by conflictcannot cultivate their crops or carry outtheir normal work• Seasonal cultivation is disrupted as fear ofattacks prevent farmers from tending orinvesting in crops• Fear restricts the mobility of people,preventing them from accessing healthcentres, schools, food markets etc. Besides,such institutions cannot function properlyor at all• Loss of livestock, destruction of homes andassets plunge people into greater poverty• Fear limits food supply by disruptingseasonal activities such as gathering desertdates and other wild food, fishing, huntingor bartering of livestock for sorghum ormaize by travelling herdsmen• Fear impedes access to potable water• Lack of access to healthcare, safe drinkingwater and food fuels disease outbreaks andmalnutrition• Trade routes are disrupted, promptinggreater food scarcity and market price rises• Humanitarian access is blocked• Opportunities for private sectorentrepreneurs to operate and contribute tooverall economic development areminimized• In general conflict-prone areas remain themost physically inaccessible, which has aknock-on-effect on food prices, health andeducation accessMap 5.1 – Geographic distribution of conflict (2009-2011)Source: UNDSS <strong>Security</strong> Incident database33
JanFebMarAprMayJunJulAugSepOctNovDecSouth Sudan: How a new country can feed its peopleOf course figures regarding the numbers ofconflicts vary. Map 5.1 provides insight into therisk of conflict based on data collected byUNDSS between January 2009 and June 2011.Based on the frequency, intensity and severityof the reported security incidences a compositeindex was created which categorizes a countyinto low, medium or high conflict risk (for detailssee Annual Needs and Livelihood AnalysisReport, 2012). States most affected by conflictare Warrap, Lakes and Jonglei. In Warrap, themost impacted counties include Twic, Tonj East,North and Gogrial East, mostly caused by intercommunalfighting. In Lakes, the main countieswith high risk of conflict include Rumbek Eastand Centre, Cuiebet, and East and West Yirol.Inter-communal fighting based on ongoingrivalries between Agar and Atuot (sub-clan ofDinka), conflict between pastoralist and agropastoralistand cattle rustling cause thesesecurity incidences. In Jonglei, the counties ofPibor, Pochalla, Uror and Khorflus are mostaffected. Militia attacks, cattle rustling andinter-communal fighting are the main causes.A seasonal analysis of incidents shows that mostconflicts (cattle raiding and armed skirmishes)occur between the period March to June (Figure5.1). This is when competition for water andpasture is at its highest which acts as a triggerfor unresolved inter-communal conflicts. It isalso when households are facing depleted foodstocks and have to rely on the market to meettheir food needs.Conflicts clearly shape livelihood strategies andhave clear impacts on food security andnutrition. For instance, conflict-affected areas inparts of Western Equatoria, have undergonedramatic livelihood changes from surplus areasto low surplus areas because of the constantfear of looting and illegal harvesting of crops bythe LRA. Lakes and Warrap have become deficitareas because of the escalation in intercommunalfighting. It appears Warrap and Lakessee the fiercest fighting with an average of 12and eight deaths a month respectively. In bothstates well over half the population is foodenergy deficient and dietary diversity isgenerally worryingly low: 73% have low dietarydiversity in Lakes and some 80% in Warrap. Theuse of unsustainable livelihoods sources such asforaging for firewood and other naturalresources has increased to almost one fifth ofhouseholds relying on them (Chapter 3) forsustenance.Figure 5.1 – Seasonal variation in conflict incidents(average number in the period 2009-2011)121086420LRASource: UNDSS <strong>Security</strong> incident database, 2009-2011Cattle raidingArmed skirmishesCattle raidingTribal fightingsCattle are a social symbol of wealth and statusand have been used for dowry payments anddispute settlement for generations, so raiding isreinforced by the high socio-cultural valueattached to cattle. Cattle raiding is consideredan easy but illegal way of acquiring wealth andthe practice has been fueled in the past fewyears by the proliferation of small arms. The lackof livelihood diversification and engrainedpoverty may also drive the surge in armed cattlerustling.While a number of cattle owners have sold offtheir stock to escape the threat of rustling,others are moving their livestock close to urbancentres, which intensifies pressure on pasture34
South Sudan: How a new country can feed its peopleand increases the potential for the continuationof conflicts over grazing rights (Crop and <strong>Food</strong><strong>Security</strong> Assessment Mission Report, 2012).Armed skirmishesArmed skirmishes increased significantly inUnity and Jonglei states in 2010 after the firstelections for South Sudan, suggesting thatmilitia has been used as a tool to gain politicalrecognition and influence. The significantcorrelation between cattle raiding and armedskirmishes, which have both increased innumber over the last two years, suggests thatthe illegal acquisition of weapons by pastoraliststo protect against cattle raiding is fueling casesof armed skirmishes.Inter-communal hostilities and borderdisputesDiverse tensions caused by long-held andunresolved tribal and historical issues have beena main source of inter-communal fights. Thesehave hampered agricultural production bytriggering a contraction in the area cultivated insome counties, notably in Jonglei with farmersopting only to cultivate land immediatelyadjacent to their homesteads. (As we have seenabove half of Jonglei’s population is deficient infood energy and 57% of households have lowdietary diversity).The main border row concerns the lack ofagreement on the border demarcation betweenSudan and South Sudan as well as over theborder region of Abyei, where a referendum forthe residents to decide whether to join south ornorth has been delayed over voter eligibility.The conflict is rooted in a dispute over landbetween farmers of the pro-South Sudan DinkaNgok people and cattle-herding Misseriya Arabtribesmen.Another border conflict zone is the NubaMountains region of Sudan's South Kordofanstate and Unity State, where large oil reservesare located and where violence continuesbetween the largely Christian and pro-SPLANuba people and Sudan armed forces.Resource/livelihood-based conflictsCompetition for basic resources such as waterand pastures has been a source of insecurityespecially in the border areas of Lakes, Unityand Warrap states. Seasonal migration of theMisseriya tribe from Abyei and South Kordofanhas been a perennial source of insecurity innorthern parts of Unity state (Mayom andAbiemnom). In addition, the seasonalmovements of cattle have been at the heart ofisolated but serious livelihood conflicts whenpastoralists’ animals destroy agriculturalists’crops. Some examples include Jurbelagriculturalists and Dinka agropastoralists inWullu and Mvolo counties of Lakes and WesternEquatoria states respectively as well asMisseriya nomads and their Dinka hosts(Western Bahr El Ghazal), Bari and Mundari inJuba county (Central Equatoria state).The Lord’s Resistance Army (LRA) andother militia attacksThe LRA has increasingly posed a major threat toregional security. The May 2010 signing by USpresident Barack Obama of the LRADisarmament and Northern Ugandan RecoveryAct and the November 2010 release of the LRADisarmament Strategy clearly recognize themagnitude of the threat. LRA attacks havemainly been concentrated in Western Equatoriabut also reported in Western Bahr el Ghazal.Such assaults continue to undermine localagricultural production, which is the pillar foreconomic growth and transformation.The unprecedented upsurge of militia activitieswitnessed in 2010 after the gubernatorialelections has abated. Currently there are threemilitia groups: SSLA in northern Unity,Olony/Ogat groups in western Bank areas ofUpper Nil and White Army in Nasser.35
South Sudan: How a new country can feed its peopleNatural disasters6 NATURAL DISASTERSCrop production largely depends on theavailability of water. In South Sudan,the quantity of water at any givenplace and time is determined by the monsoonrainfall cycle and the large river network formedby the Nile River and its tributaries (Sobat, BahrEl Ghazal, and many others). The firstdetermines the timing and length of the growingseason and the amount of rainfall available forcrop and pasture development. Thesecond supports permanent vegetationin large wetland areas (known as theSudd),) which constitutes a majorlivelihood resource for a significantproportion of South Sudan’spopulation.The rainfall cycle and large rivernetwork also determine the frequencyand intensity of droughts and floods.In addition, in La Niña years, rainfall is typicallyerratic and below normal while in El Niño years,rainfall is often above normal. Figure 6.1 showsthe average deviation from the mean ITFposition since 1990, clearly indicating thedrought years of 2001, 2004, 2009 and 2011.Figure 6.1 – ITF deviation from average (May-Oct)DroughtsIn South Sudan, variations in seasonal rainfalland the timing of it, are caused bydisturbances in a large scale monsoonrainfall mechanism that brings widespreadrainfall to the country in a South to Northmovement starting from April-May onwardsuntil October-November.The northernmost boundary of the rainfall isknown as the Inter Tropical Convergence Zoneor Inter Tropical Front (see Box 6.1). Seasonswhen the Intertropical Front (ITF) northwardmovement is delayed or weakened tend tocause delays in the start of the growing seasonand overall rainfall deficits.Negative numbers indicate seasons when the ITF waspersistently south of its usual position and vice-versa forpositive numbersThis rainfall pattern largely determines the startand length of the growing period, which is oneof the main determinants of agriculturalpotential. Maps 6.1 and 6.2 show the spatialpatterns in the start and length of growingperiod derived from NDVI calculations. 1111 Normalized Deviation Vegetation Index (NDVI). An indexthat measures variation in vegetation development.36
South Sudan: How a new country can feed its peopleMap 6.1 – Average start of growing seasonMap 6.2 – Average length of the green season which determines and is similarto the agricultural growing periodThe earliest dates for planting occur in the south west of WesternEquatoria (Greenbelt region) between late February and late March.Planting happens later as one moves further north. By May, most ofSouth Sudan is green with the exception of Upper Nile, which does notgreen up until June-July, while crop development in the mechanizedfarming regions of Renk in northernmost Upper Nile State peaks aroundmid-August (Maps 6.1 and 6.2).The growing season varies from justover nine months in the Greenbeltand Nile wetlands (which have longerseasons than the surroundingregions) down to just three to fourmonths in Renk and the eastern partof Eastern Equatoria.A long growing period provides alonger period for cropping andunderscores the potential foragricultural development; it allowsfor crop diversification, including cashcrops and different cereal varietieswith short, medium and longdevelopment cycles. <strong>Food</strong> securityindicators perform relatively better inthese areas.The Greenbelt and especially, theSudd wetlands provide reservoirs ofpasture and water during the dryseason, which can support largenumbers of livestock. However,occasional scarcity of these waterand pasture resources due to lowrainfall within the catchment areas ofthe Nile and its tributaries can act asa trigger for conflict (See Chapter 5).Changes in the start and length of thegrowing season are a directconsequence of changes in the timingof the northwards movement of themonsoon. It should be noted that theend of the rainfall season is much lessvariable than the start, so that adelay in the start of the seasonusually implies a shorter growingseason.37
South Sudan: How a new country can feed its peopleBox 6.1 - Rainfall patterns in South SudanSouth Sudan’s climate is dominated by an annual monsoon movement that enters the country from thesouth in late February – early March and progresses steadily northwards. These humid air masses pushagainst warmer and drier air of the Sahara desert, forming the Inter-Tropical Convergence Zone or Inter-Tropical Front (ITCZ or ITF). By early June, rainfall usually covers the whole of South Sudan. By mid to lateAugust, rainfall reaches its northernmost extent near the deserts of northern Sudan and starts retreatingsouthwards. The northern regions of South Sudan see the last rains in mid-October and by late Decemberthere is little if any rainfall in the country.Map 6.3 – Average total seasonal rainfall in South SudanAs a result of this seasonal cycle,rainfall starts increasingly laterand ends increasingly earlier asyou go north and hence largerseasonal amounts occur in thesouthwest of the country. Inmore northern regions of SouthSudan most rainfall occursbetween July and September (seeMap 6.3) while the southernregions benefit from rainfallduring most of the year due to amore complex intra-seasonalrainfall cycle.Map 6.4 – Proportion of seasonal rainfall that falls in July to SeptemberSoutheast regions (EasternEquatoria and southeast Jonglei)have a rainfall regime moresimilar to that of Kenya andsouthern Ethiopia: a bimodaldistribution with a main peakaround April and a second peakin October separated by a drierperiod from July to September.This is reflected in the lowproportion of the total rainfallthat comes in July-September asseen in Map 6.4. These regionsare also the drier areas of thecountry.Southwest regions have a long rainy season and the July-September contribution to the seasonal total isnaturally smaller. Here there is some influence of more southerly rainfall regimes, with April usually beingthe wettest month and a period of lower rainfall in August.38
South Sudan: How a new country can feed its peopleMap 6.5 – Coefficient of Variation of total seasonal rainfallMap 6.6 – Coefficient of Variation (CV) of the seasonal maximum NDVI When the season is normalor early, farmers usually plantadditional fields away from thesurroundings of the homestead(“far fields”). When the season isdelayed and early rainfall poor,farmers tend to give up on these farfields, and therefore householdcrop production is lower in years ofdelayed rainfall. In many areas, varieties ofsorghum with long developmentcycles are favoured and in case thestart of the season is delayed, theremay not be enough time for thecrop to advance to full maturity. Livestock and herdersremain for longer in the dry seasongrazing areas and near water points.As pastoral resources becomescarcer, livestock health is affected,and the risk of conflict betweendifferent users increases.These problems are compounded ifthe rainfall during the main rainfallseason (June-September) isdeficient. There is a higherlikelihood that rainfall will be poor ifthe onset of the season is delayed.There are many implications of late orinsufficient rains that result in a worsened stateof food security. This includes:The planting of crops, including the shortcycle cereal varieties, is delayed, whichaffects the first crop of the season resultingin prolonged lean season. Farmers mayswitch to varieties with shorterdevelopment periods; while this maximisesthe chances of a successful crop, theresulting yields are lower than those of thelonger varieties. This tends to be the casein the more northern states where growingperiods are shorterSouth Sudan’s drought prone areasare concentrated in the southeastbut also affect areas in the Upper Nile andJonglei. Figures 6.5 and 6.6 identify thesedrought prone areas by calculating thecoefficient of variation 12 of the seasonal rainfall,i.e., the inter-annual variation in the seasonalrainfall amount within the 1996 to 2010 period(source: USGS-FEWS NET), and the coefficient ofvariation of the maximum seasonal NDVI values,indicating the variability in seasonal vegetationperformance.12 Standard deviation of the seasonal rainfall divided by theaverage seasonal rainfall39
South Sudan: How a new country can feed its peopleThis drought risk pattern is linked to the climateregime of northern Kenya. The regions of SouthSudan where the ITF related rainfall regimedominates have far more reliable seasonalrainfall. As expected, the southwest regionsspanning the Greenbelt have the least variabilityin rainfall.FloodsFlooding is a common natural phenomenain South Sudan and is essential for manylivelihoods. Flood water increases the fishcatch and enriches the soil. Traditionally,communities move to higher grounds whenlowlands are inundated and practice recessioncultivation in the productive flooded fertilefields once the rainy season is over. Recedingfloods create good dry-season grazing areascalled toic. However, excessive flooding can alsocause significant hazards.Flooding becomes hazardous when it exceedswhat is commonly considered as normal interms of frequency, intensity, scale and spatialspread. In the context of South Sudan there aretwo types of flooding:1. Large scale riverine flooding which resultsfrom heavy rainfall in the catchment areasof the major river systems and dependenton rainfall patterns outside of South Sudan,including Central African Republic andDemocratic Republic of Congo for riversfeeding into the Bahr el Ghazal (Juur, Lol),Uganda (Nile) and Ethiopia (Sobat).2. Localized flooding as a consequence of veryheavy and continuing downpours,particularly in areas where soil type andtopography lend themselves toaccumulation of water.These two types of flooding are notindependent: heavy rainfall is more likely inwetter than average seasons and these tend tobe more spread out spatially. Therefore onereinforces the other.The area flooded by overflowing of rivers isdetermined by the broad hydrological riversystem in the country. Localized floods have aless deterministic spatial pattern. Riverineseasonal flooding tends to occur at a slower ratethan the more sudden heavy rainfall floodevents.The situation worsens when the heavy rains inSouth Sudan or neighbouring countries comeearlier than usual when communities are notprepared to move to higher grounds or whenthey come at a critical stage of cropdevelopment, destroying crops such as maize,sorghum, groundnuts and vegetables.Flood hazards become disasters when acommunity’s coping capacities are not able towithstand the impact. Community level copingstrategies include moving people and livestockto higher ground, relocating to friends orrelatives in nearby villages or building dykes andmounds around houses to divert water flow.Many start to rely on fishing and gathering wildfoods or on food they have saved for anemergency or they share food and non-foodresources through traditional networks.<strong>Food</strong> insecurity indicators generally worsenparticularly among the vulnerable members ofthe community and returnees and IDPs. Manysuffer water-borne diseases after drinkingcontaminated flood water while incidences ofdiarrhoea, upper respiratory diseases andmalaria all increase.Access becomes nearly impossible in floodedareas impacting food, medicines and fuelsupplies. Social services including education,40
South Sudan: How a new country can feed its peoplehealth, transport and markets are cut and lackof adequate information from many of the floodaffected areas prevents humanitarian partnersfrom responding effectively. As a consequenceacute malnutrition rates increase sharply inflood affected areas.Mapping the risk of localized floods wouldrequire an analysis of the spatial distribution ofextreme rainfall amounts from daily recordsover the long term from a sufficient number ofrainfall stations. This does not exist for SouthSudan. The risk of seasonal floods is easier tomap with the lowland plains being most proneto flooding. Results are presented in Map 6.7Northern Bahr el Ghazal, Unity, Jonglei, UpperNile and Lakes are the states most at risk offlooding.Factoring in a population estimate based onLandscan information provides an estimate ofthe flood-exposed population (Map 6.8). Highernumbers of exposed population areconcentrated in the Bahr El Ghazal wetlandswhere rural population densities are higher.These regions provide a very rich naturalresource base and hence would be able tosupport larger population numbers (theinfluence of the proximity to better developedinfrastructure and market links to the northernregions may also play a role).41
South Sudan: How a new country can feed its peopleMap 6.7 – Flood frequencySource: LandscanMap 6.8 – Population at risk to floodingSource: UNEP-GRID PREVIEW Global Risk Data Platform42
South Sudan: How a new country can feed its peopleLimited road and market infrastructure7 LIMITED ROAD AND MARKETINFRASTRUCTURESOuth Sudan is expansive (the same size asKenya, Uganda and Burundi combined)but it has just 4,000 km of roads, whichtranslates into a classified road density of 15 per1000 Km 2 of arable land compared to 101 in EastAfrica 13 . In May, when the rainy season starts,many parts of the country become accessibleonly by air or river. Jonglei, Unity, Warrap andNorthern Bahr el Ghazal are the least connectedstates as shown in Map 7.1.Road is the most important means of transport,with 96 percent of fuel and 83 percent of foodcommodities are transported by road, whilerivers transport 16 percent of food and 4percent of fuel (FEWSNET, May 2011). Trucksare used from December/January up to Maywhen roads become impassable. River barges (ifavailable) are the most inexpensive means oftransport.Malakal) and price differentials have furtherwidened in 2012 (see Map 7.2).The border closure between South Sudan andSudan since May 2011 has curtailed suppliesand increased transaction costs significantly.And due to cumbersome clearance procedures,high transport prices, insecurity, trade fromother neighbouring countries (Ethiopia, Ugandaand Kenya) have not capitalized on the reducedsupply from Sudan, although Uganda remainsthe main supplier to the Northern states. Theexception is perhaps Ethiopia which has becomea more important source market for cereals forSouth Sudan in recent months. 15Figure 7.1 – Depreciation and inflationDue to low transport capacity, poor roadconditions, long distances, insecurity, numerouscheck point and complex administrativeprocesses involving high transaction costs 14 ,domestic food markets are poorly integrated.Prices vary substantively between the mainurban consumer centers (Juba, Bor, Wau, Aweil,13 See World Bank (2012). Agricultural Potential, RuralRoads and Farm Competitiveness in South Sudan. Report No.68399-SS. World Bank, Washington D.C.14 See Cost-to-Market Report (South Sudan national Bureauof Statistics, 2010) which found that average payment per100 km exceeds 100 SDG. Payment on the Nimule - Jubaroute was the highest at more than 4000 SDG per 100 km.15 World <strong>Food</strong> Programme (2012). Mission Report on Cashand Vouchers, 20 February- 2 March 2012. South Sudan43
Map 7.1 – Road accessMarket prices of food commodities have beenrising persistently in South Sudan. Grainshortage, poor road conditions, high fuel pricesand depreciation of the Sudanese poundunderlie these price inflations. The overall yearon-yearinflation reached almost 80 percent inMay 2012 (see Figure 7.1).Terms of Trade between food items andlivestock have also deteriorated in recentmonths. For example, based on WFP’s pricemonitoring data, terms of trade between whitesorghum and medium sized goats (male)declined by some 35 percent in the first monthsof 2012 compared to the five year average(2007 – 2011).The Government of South Sudan derives closeto 98 percent of its revenue from oil productionand presently depends on Sudan to export itsoil. Therefore, South Sudan’s economy isvulnerable to fluctuations in oil prices in theglobal market and is also heavily dependent onits political relationship with Sudan.Any disruption in oil production, as witnessed in2012, threatens the macro-economic stability ofthe country and undermines its ability to meetits immediate food needs through imports and,in the long-term, develop the large potential inagriculture, livestock and fisheries.In the absence of sufficient own production, theSouth Sudanese are heavily reliant on marketsfor their food consumption which meansconsumption is significantly affected by therecent rise in food prices.As shown in chapter 1 and 3, households buy onaverage 63 percent of their calorie intake and astaggering 79 percent of total householdexpenditure goes to buying food.In the face of continuous and accelerating highfood prices, shortage of foreign exchange andlimited transport capacity the ability of SouthSudanese households to purchase food inmarkets will be further eroded.44
South Sudan: How a new country can feed its peopleMap 7.2 – Spatial price inflation45
There are very few good roads in South Sudan46
South Sudan: How a new country can feed its peopleHow South Sudan can feed its people8 HOW SOUTH SUDAN CAN FEEDITS PEOPLE“As South Sudanese, we must concentrate onour own challenges. We have a lot of challenges;our country needs a lot of development. Weneed infrastructure, we need health centers andfacilities in every location, we need water, andelectricity. But who will do these things for us?We must work very hard. We have the problemof food shortage, every year we cry of hungeryet we have a big fertile land. We must tilt ourland. Does this really need someone else to showus? Who among us does not know how to growtomatoes or maize? This year, we must try toproduce our own food, so that next year wedon’t beg from anybody again.”President Salva Kiir, May 2012To maintain peace, ensure prosperity andprogress, one of the most urgentchallenges for South Sudan is how to feedits population.As discussed in this report, the richness innatural resources and the abundance ofavailable agricultural land is incongruous withthe depth and extent of hunger in South Sudan.Widespread poverty, undernourishment, lack ofeducation, ongoing conflict and instability,natural disasters and limited market and roadinfrastructure provide explanations for whyhunger amongst the population is a commonphenomenon.Supporting access to food through mediumtermlivelihood/resilience building and food andnon-food transfers is therefore necessary in theimmediate future to sustain life, but this needsto be coupled with large scale investments inagriculture, infrastructure and education toensure sustainable food security.Table 8.1 – Proxies of food security indicators used for scoringAvailability Shortfall in cereal production (averageof last 3 years) The county’s median distance tonearest roadAccess Percentage of households living inmodern housing Percentage of households not owningany of the following assets: TV, radio,phone (incl. mobile), computer,refrigerator, satellite dish, fanUtilization Percentage of households whose mainsource of drinking water comes fromunprotected sourcesPercentage of households with noaccess to toilet facilitiesMap 8.1 provides guidance for geographictargeting of food assistance programmes at thecounty level. This map is based on food securityproxy indicators available from the 2008population census. Proxy indicators for foodavailability, access and utilization in Table 8.1were scored, combined, using equal weight, andcategorized to provide a relative food securityclassification for each county. The darker shadeindicates higher relative levels of foodinsecurity.47
South Sudan: How a new country can feed its people<strong>Food</strong> security indicators<strong>Food</strong> insecurity is particularly rife in mostcounties of Unity 16 , counties in the east ofJonglei bordering Ethiopia, the lower parts ofUpper Nile and in the high drought risk areas inthe tip of Eastern Equatoria. Most counties inNorthern and Western Bahr el Ghazal score notmuch better.Pastoralism is another dominant livelihood inmany of these areas, especially in EasternEquatoria and Jonglei. Population groupsdepending on these income sources have thelowest food consumption score and would needto be specifically targeted.Map 8.1 – Relative food insecurityThere is a remarkable overlap between thisrelative food insecurity map and the mapsshowing the geographic distribution of conflict,poverty and natural disasters. The mainlivelihood activity in these areas is the collectionof natural resources which is relied upon by alarge percentage of the population and isultimately an unsustainable source of incomebut has increased significantly since 2006 (seeChapter 3).Figure 8.1 gives further insight into what isdriving these high levels of food insecurity. Itshows the share each food security component(availability, access and utilization) imparts tothe total food insecurity score of that county inrelative terms using the indicators definedabove.16 Unity has also the highest hunger index – see page 948
South Sudan: How a new country can feed its peopleEastern and Central Equatoria: Key contributingfactor is poverty. <strong>Food</strong> availability is in arelatively better state due to a relatively betterroad network, except in Kapoeta East.Western and Northern Bahr el Ghazal:The key driving factor relative to other countiesis the food supply situation. Grain shortfalls arelarge and road network largely absent.Warrap and Unity: Widespread poverty andthus limited access to food is key determinant.However, food shortfalls are the common stateof affairs and sanitation and safe water access afar cry.Jonglei: Pochalla County scores the worst on allthree measures. Much of Jonglei is inaccessibleand food shortfalls are common.Upper Nile: Utilization factors provide the mainrelative impact on the high food security scorein south of the Upper Nile state.<strong>Food</strong> supply specifically targeted at overcomingaccess and supply constraints are mostappropriate in Unity, Jonglei and Northern Bahrel Ghazal. Nutrition-based interventions have awider scope and also include Upper Nile Stateand Eastern Equatoria. Market-basedinterventions including food vouchers are moreappropriate to the more accessible and surplusareas.Figure 8.1 – Relative contribution to food insecurityfor counties with relative high levels of foodinsecurity*Eastern EquatoriaCentral EquatoriaWestern B. GhazalNorthern B. GhazalWarrapUnityJongleiUpper NileBudiKapoeta EastIkotosKapoeta SouthKapoeta NorthLopa/LafonTerekekaRagaAweil CentreAweil WestAweil EastAweil NorthTonj EastLeerKochGuitMayomPariangPanyijarRubkonaPiborPochallaAyodBor SouthAkoboKhorflusBalietUlangLuakpiny/NasirMaiwutAvailabilityAccessUtilizationSource: Population Census, 2008*Western Equatoria and Lakes are not shown because therewere no counties with severely food insecure households atthe time of this analysis49
South Sudan: How a new country can feed its peopleAnnex 1 – South Sudan <strong>Food</strong> <strong>Security</strong> Country Profile<strong>Food</strong> <strong>Security</strong> Profile for South Sudan (2010)<strong>Food</strong> Energy AvailabilityDiet QualityAdequacy of consumptionVulnerabilityNutritionVariableDaily food energyconsumption percapita(kilocalories)Percentage ofpopulationwith foodenergydeficiencyDiet diversity(no. of foodgroups)Percentage ofhouseholdswith lowdietarydiversityShare of foodenergyderived fromstaples<strong>Food</strong> Consumption ScoreIncidenceStunting Wasting UnderweightPopulation % of total Under five of highbelow poverty expenditure mortality per fever /Poor Borderline Acceptable line spent on food 1000 malaria Moderate Severe Moderate Severe Moderate SevereNational 1,890 47 3.5 51.3 61 16.1 20.8 63.1 50.6 79 105 32.5 25.0 13.8 20.9 7.6 30.3 12.0StateUpper Nile 1,520 69 4.5 34.4 39 15.4 18.7 65.9 25.7 73 161 28.2 23.7 13.1 22.3 7.6 28.8 11.0Jonglei 1,960 48 3.1 57.1 64 13.9 16.8 69.3 48.3 86 69 30.6 21.9 13.8 27.1 12.9 34.3 14.3Unity 1,430 72 3.7 49.1 63 12.9 15.1 71.9 68.4 80 69 25.4 35.7 20.6 34.1 13.6 49.0 24.0Warrap 1,650 63 2.4 79.5 70 30.4 23.9 45.7 64.2 83 105 26.6 23.4 13.7 26.2 8.2 34.6 13.0Nothern Bahr Al Ghazal 1,840 44 3.1 63.6 79 27.4 31.6 40.9 75.6 85 170 29.7 22.1 10.8 26.9 8.7 34.2 12.1Western Bahr Al Ghazal 1,440 74 3.9 45.5 42 11.6 20.4 68 43.2 82 116 27.6 21.1 11.7 14.7 5.6 25.1 9.3Lakes 1,830 54 2.5 73.2 53 18.7 21.8 59.5 48.9 80 66 33.2 25.5 11.6 18.6 7.9 27.9 11.3Western Equatoria 2,490 23 4.4 24.2 63 5.3 15.5 79.2 42.1 82 65 36.0 28.1 15.1 11.9 4.0 21.1 6.4Central Equatoria 2,070 41 4.1 35.1 66 8.3 13.1 78.6 43.5 64 153 40.8 26.2 12.9 12.6 3.5 22.1 8.9Eastern Equatoria 2,400 27 3.7 41.4 60 16.8 30.2 53 49.8 84 198 45.2 27.8 16.6 12.8 3.2 29.2 12.4Urban 1,915 4.9 18 53 4 24.4 69 122 30.5 21.7 10.4 15.2 4.5 23.5 8.9Rural 1,781 3.2 58 63 19 55.4 81 94 33.1 25.9 14.7 22.5 8.4 32.2 12.9Expenditure quintiles1 (lowest 20%) 970 1.7 95 72 87.6 802 1,482 2.9 67 67 81.2 833 1,703 3.6 47 62 63.1 824 2,075 4.3 29 56 14.5 795 (Highest 20%) 2,782 4.9 18 50 3.3 74Male-headed household 1,824 47.3 80Female-headed household 1,749 56.6 79Livelihoods (SHHS, 2010)Agriculture 17.3 20.5 62.2Collection of natural resources 17.4 24.0 58.6Sale of Alcohol 16.4 23.5 60.2Pastoralism 19.2 20.6 60.2Salaries 8.3 13.7 78.0Casual labour 13.2 19.6 67.2Trade 17.7 20.4 61.9Aid/gifts/remittances 16.3 24.3 59.4Livelihood groups (HBS, 2009)Crop farming 1,811 3.2 59 64 56 82Animal husbandry 1,704 3.0 67 55 49 85Wages and salari 1,936 5.0 16 53 25 70Owned business e 1,849 4.6 24 52 33 72Property income 2,014 4.8 19 55 33 72Remittances 1,792 4.3 27 50 26 73Pension 1,534 4.5 31 64 18 64Aid 1,458 4.2 33 53 23 69Others 1,501 3.7 48 61 57 7450