4.15 MB - Food Security Clusters
4.15 MB - Food Security Clusters
4.15 MB - Food Security Clusters
- No tags were found...
You also want an ePaper? Increase the reach of your titles
YUMPU automatically turns print PDFs into web optimized ePapers that Google loves.
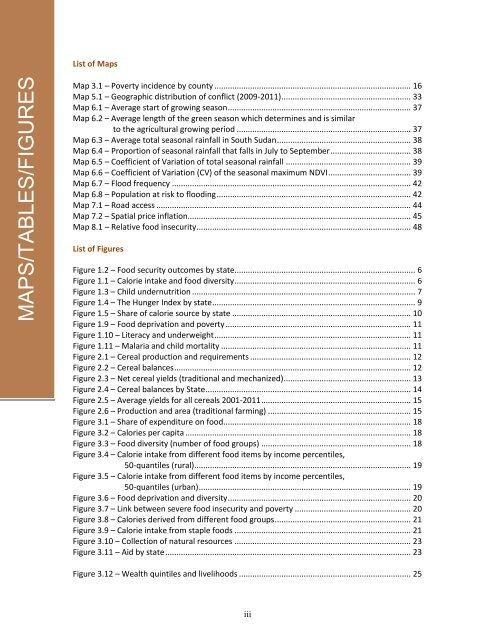
MAPS/TABLES/FIGURESList of MapsMap 3.1 – Poverty incidence by county ........................................................................................ 16Map 5.1 – Geographic distribution of conflict (2009-2011) .......................................................... 33Map 6.1 – Average start of growing season .................................................................................. 37Map 6.2 – Average length of the green season which determines and is similarto the agricultural growing period .............................................................................. 37Map 6.3 – Average total seasonal rainfall in South Sudan ............................................................ 38Map 6.4 – Proportion of seasonal rainfall that falls in July to September .................................... 38Map 6.5 – Coefficient of Variation of total seasonal rainfall ........................................................ 39Map 6.6 – Coefficient of Variation (CV) of the seasonal maximum NDVI ..................................... 39Map 6.7 – Flood frequency ........................................................................................................... 42Map 6.8 – Population at risk to flooding ....................................................................................... 42Map 7.1 – Road access .................................................................................................................. 44Map 7.2 – Spatial price inflation.................................................................................................... 45Map 8.1 – Relative food insecurity ................................................................................................ 48List of FiguresFigure 1.2 – <strong>Food</strong> security outcomes by state................................................................................. 6Figure 1.1 – Calorie intake and food diversity ................................................................................. 6Figure 1.3 – Child undernutrition .................................................................................................... 7Figure 1.4 – The Hunger Index by state ........................................................................................... 9Figure 1.5 – Share of calorie source by state ................................................................................ 10Figure 1.9 – <strong>Food</strong> deprivation and poverty ................................................................................... 11Figure 1.10 – Literacy and underweight ........................................................................................ 11Figure 1.11 – Malaria and child mortality ..................................................................................... 11Figure 2.1 – Cereal production and requirements ........................................................................ 12Figure 2.2 – Cereal balances .......................................................................................................... 12Figure 2.3 – Net cereal yields (traditional and mechanized) ......................................................... 13Figure 2.4 – Cereal balances by State ............................................................................................ 14Figure 2.5 – Average yields for all cereals 2001-2011 ................................................................... 15Figure 2.6 – Production and area (traditional farming) ................................................................ 15Figure 3.1 – Share of expenditure on food .................................................................................... 18Figure 3.2 – Calories per capita ..................................................................................................... 18Figure 3.3 – <strong>Food</strong> diversity (number of food groups) ................................................................... 18Figure 3.4 – Calorie intake from different food items by income percentiles,50-quantiles (rural) ................................................................................................. 19Figure 3.5 – Calorie intake from different food items by income percentiles,50-quantiles (urban) ............................................................................................... 19Figure 3.6 – <strong>Food</strong> deprivation and diversity .................................................................................. 20Figure 3.7 – Link between severe food insecurity and poverty .................................................... 20Figure 3.8 – Calories derived from different food groups ............................................................. 21Figure 3.9 – Calorie intake from staple foods ............................................................................... 21Figure 3.10 – Collection of natural resources ............................................................................... 23Figure 3.11 – Aid by state .............................................................................................................. 23Figure 3.12 – Wealth quintiles and livelihoods ............................................................................. 25iii


