4.15 MB - Food Security Clusters
4.15 MB - Food Security Clusters
4.15 MB - Food Security Clusters
- No tags were found...

You also want an ePaper? Increase the reach of your titles
YUMPU automatically turns print PDFs into web optimized ePapers that Google loves.
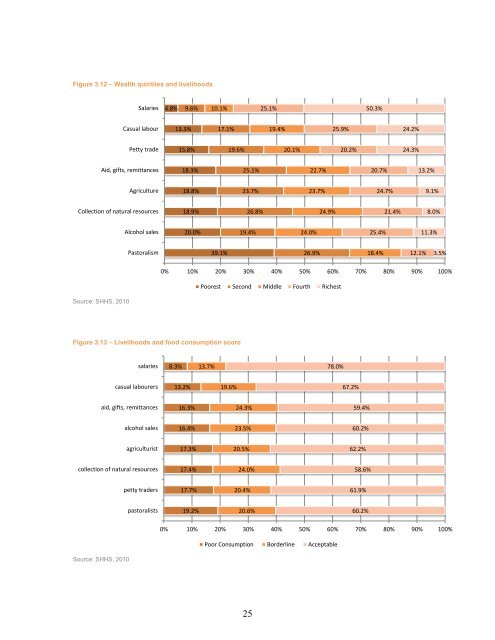
Figure 3.12 – Wealth quintiles and livelihoodsSalaries4.8%9.6%10.1%25.1%50.3%Casual labour13.3%17.1%19.4%25.9%24.2%Petty trade15.8%19.6%20.1%20.2%24.3%Aid, gifts, remittances18.3%25.1%22.7%20.7%13.2%Agriculture18.8%23.7%23.7%24.7%9.1%Collection of natural resources18.9%26.8%24.9%21.4%8.0%Alcohol sales20.0%19.4%24.0%25.4%11.3%Pastoralism39.1%26.9%18.4%12.1%3.5%0% 10% 20% 30% 40% 50% 60% 70% 80% 90% 100%Poorest Second Middle Fourth RichestSource: SHHS, 2010Figure 3.13 – Livelihoods and food consumption scoresalaries8.3%13.7%78.0%casual labourers13.2%19.6%67.2%aid, gifts, remittances16.3%24.3%59.4%alcohol sales16.4%23.5%60.2%agriculturist17.3%20.5%62.2%collection of natural resources17.4%24.0%58.6%petty traders17.7%20.4%61.9%pastoralists19.2%20.6%60.2%0% 10% 20% 30% 40% 50% 60% 70% 80% 90% 100%Poor Consumption Borderline AcceptableSource: SHHS, 201025