4.15 MB - Food Security Clusters
4.15 MB - Food Security Clusters
4.15 MB - Food Security Clusters
- No tags were found...

Create successful ePaper yourself
Turn your PDF publications into a flip-book with our unique Google optimized e-Paper software.
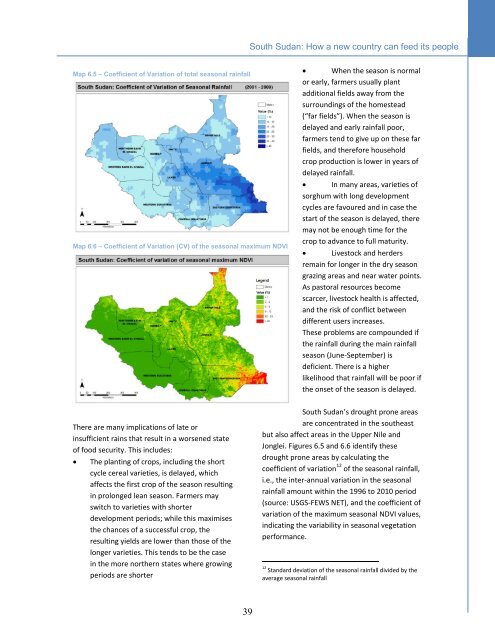
South Sudan: How a new country can feed its peopleMap 6.5 – Coefficient of Variation of total seasonal rainfallMap 6.6 – Coefficient of Variation (CV) of the seasonal maximum NDVI When the season is normalor early, farmers usually plantadditional fields away from thesurroundings of the homestead(“far fields”). When the season isdelayed and early rainfall poor,farmers tend to give up on these farfields, and therefore householdcrop production is lower in years ofdelayed rainfall. In many areas, varieties ofsorghum with long developmentcycles are favoured and in case thestart of the season is delayed, theremay not be enough time for thecrop to advance to full maturity. Livestock and herdersremain for longer in the dry seasongrazing areas and near water points.As pastoral resources becomescarcer, livestock health is affected,and the risk of conflict betweendifferent users increases.These problems are compounded ifthe rainfall during the main rainfallseason (June-September) isdeficient. There is a higherlikelihood that rainfall will be poor ifthe onset of the season is delayed.There are many implications of late orinsufficient rains that result in a worsened stateof food security. This includes:The planting of crops, including the shortcycle cereal varieties, is delayed, whichaffects the first crop of the season resultingin prolonged lean season. Farmers mayswitch to varieties with shorterdevelopment periods; while this maximisesthe chances of a successful crop, theresulting yields are lower than those of thelonger varieties. This tends to be the casein the more northern states where growingperiods are shorterSouth Sudan’s drought prone areasare concentrated in the southeastbut also affect areas in the Upper Nile andJonglei. Figures 6.5 and 6.6 identify thesedrought prone areas by calculating thecoefficient of variation 12 of the seasonal rainfall,i.e., the inter-annual variation in the seasonalrainfall amount within the 1996 to 2010 period(source: USGS-FEWS NET), and the coefficient ofvariation of the maximum seasonal NDVI values,indicating the variability in seasonal vegetationperformance.12 Standard deviation of the seasonal rainfall divided by theaverage seasonal rainfall39