4.15 MB - Food Security Clusters
4.15 MB - Food Security Clusters
4.15 MB - Food Security Clusters
- No tags were found...

You also want an ePaper? Increase the reach of your titles
YUMPU automatically turns print PDFs into web optimized ePapers that Google loves.
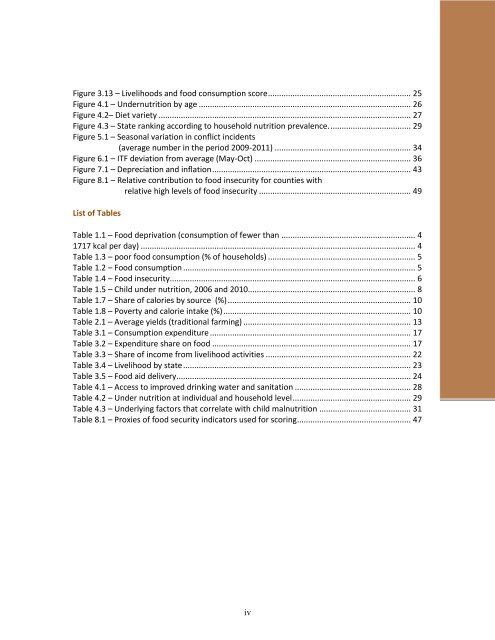
Figure 3.13 – Livelihoods and food consumption score ................................................................ 25Figure 4.1 – Undernutrition by age ............................................................................................... 26Figure 4.2– Diet variety ................................................................................................................. 27Figure 4.3 – State ranking according to household nutrition prevalence. .................................... 29Figure 5.1 – Seasonal variation in conflict incidents(average number in the period 2009-2011) ............................................................. 34Figure 6.1 – ITF deviation from average (May-Oct) ...................................................................... 36Figure 7.1 – Depreciation and inflation ......................................................................................... 43Figure 8.1 – Relative contribution to food insecurity for counties withrelative high levels of food insecurity .................................................................... 49List of TablesTable 1.1 – <strong>Food</strong> deprivation (consumption of fewer than ............................................................ 41717 kcal per day) ........................................................................................................................... 4Table 1.3 – poor food consumption (% of households) .................................................................. 5Table 1.2 – <strong>Food</strong> consumption ........................................................................................................ 5Table 1.4 – <strong>Food</strong> insecurity.............................................................................................................. 6Table 1.5 – Child under nutrition, 2006 and 2010........................................................................... 8Table 1.7 – Share of calories by source (%) .................................................................................. 10Table 1.8 – Poverty and calorie intake (%) .................................................................................... 10Table 2.1 – Average yields (traditional farming) ........................................................................... 13Table 3.1 – Consumption expenditure .......................................................................................... 17Table 3.2 – Expenditure share on food ......................................................................................... 17Table 3.3 – Share of income from livelihood activities ................................................................. 22Table 3.4 – Livelihood by state ...................................................................................................... 23Table 3.5 – <strong>Food</strong> aid delivery ......................................................................................................... 24Table 4.1 – Access to improved drinking water and sanitation .................................................... 28Table 4.2 – Under nutrition at individual and household level ..................................................... 29Table 4.3 – Underlying factors that correlate with child malnutrition ......................................... 31Table 8.1 – Proxies of food security indicators used for scoring ................................................... 47iv