4.15 MB - Food Security Clusters
4.15 MB - Food Security Clusters
4.15 MB - Food Security Clusters
- No tags were found...

Create successful ePaper yourself
Turn your PDF publications into a flip-book with our unique Google optimized e-Paper software.
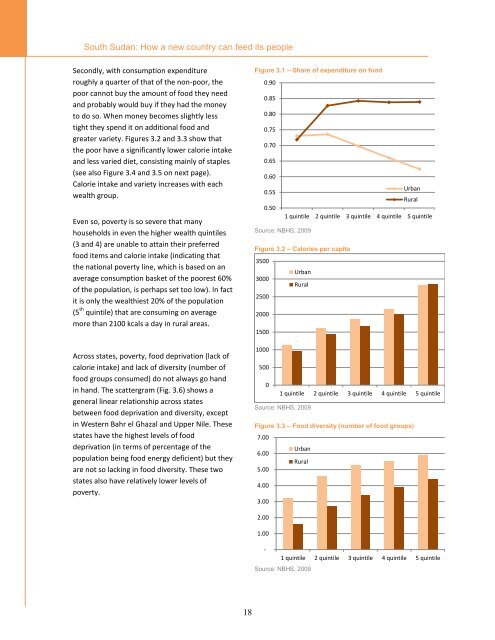
South Sudan: How a new country can feed its peopleSecondly, with consumption expenditureroughly a quarter of that of the non-poor, thepoor cannot buy the amount of food they needand probably would buy if they had the moneyto do so. When money becomes slightly lesstight they spend it on additional food andgreater variety. Figures 3.2 and 3.3 show thatthe poor have a significantly lower calorie intakeand less varied diet, consisting mainly of staples(see also Figure 3.4 and 3.5 on next page).Calorie intake and variety increases with eachwealth group.Even so, poverty is so severe that manyhouseholds in even the higher wealth quintiles(3 and 4) are unable to attain their preferredfood items and calorie intake (indicating thatthe national poverty line, which is based on anaverage consumption basket of the poorest 60%of the population, is perhaps set too low). In factit is only the wealthiest 20% of the population(5 th quintile) that are consuming on averagemore than 2100 kcals a day in rural areas.Across states, poverty, food deprivation (lack ofcalorie intake) and lack of diversity (number offood groups consumed) do not always go handin hand. The scattergram (Fig. 3.6) shows ageneral linear relationship across statesbetween food deprivation and diversity, exceptin Western Bahr el Ghazal and Upper Nile. Thesestates have the highest levels of fooddeprivation (in terms of percentage of thepopulation being food energy deficient) but theyare not so lacking in food diversity. These twostates also have relatively lower levels ofpoverty.Figure 3.1 – Share of expenditure on food0.900.850.80Source: Calculated based on data from NBHS, 20090.750.700.650.60Urban0.55Rural0.501 quintile 2 quintile 3 quintile 4 quintile 5 quintileSource: NBHS, 2009Figure 3.2 – Calories per capita3500Urban3000Rural2500Source: Calculated based on data from NBHS, 200920001500100050001 quintile 2 quintile 3 quintile 4 quintile 5 quintileSource: NBHS, 2009Figure 3.3 – <strong>Food</strong> diversity (number of food groups)7.00Urban6.00Rural5.004.003.002.001.00-1 quintile 2 quintile 3 quintile 4 quintile 5 quintileSource: NBHS, 200918